USDCAD trade ideas
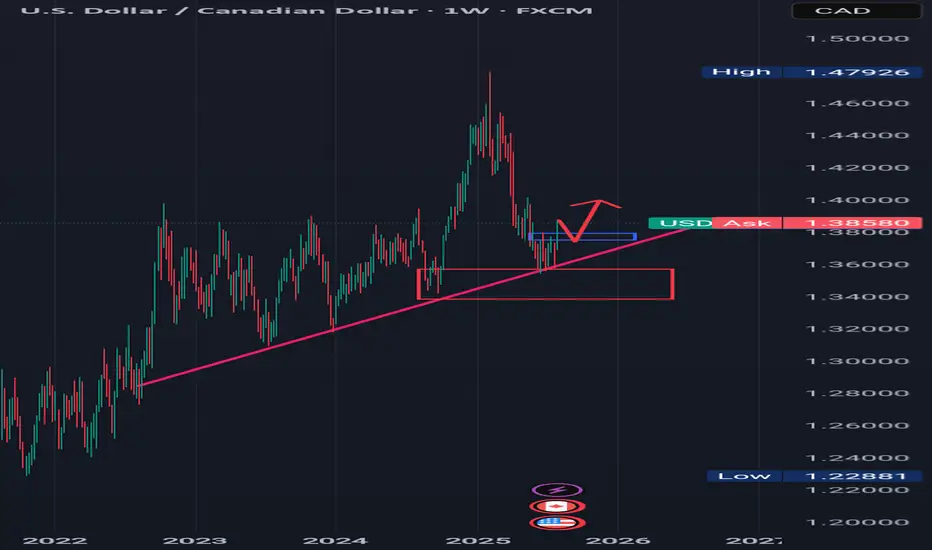
TREND REVERSAL CONFIRMATION Looking at the weekly timeframe for USDCAD, we can see that price action has respected a rising trendline and also reacted to a weekly bullish order block.
The Sell momentum for USDCAD has come to an end, so now we saw price action accumulating around the rising trend line and bullish order block.
Now there's a minor resistance which is indicated with a small blue rectangle in which price action has broken to the upside, I'm expecting price to complete an impulse correction leg or retrace to the blue rectangle or minor resistance and then from there continue to the upside.
........,...,.............................................
Please share your thoughts on this analysis, do you think the downward trend is over.
USD/CAD Eyes Breakout Above 1.38 as Weekly MACD Flashes BullishUSD/CAD Eyes Breakout Above 1.38 as Weekly MACD Flashes Bullish Signal
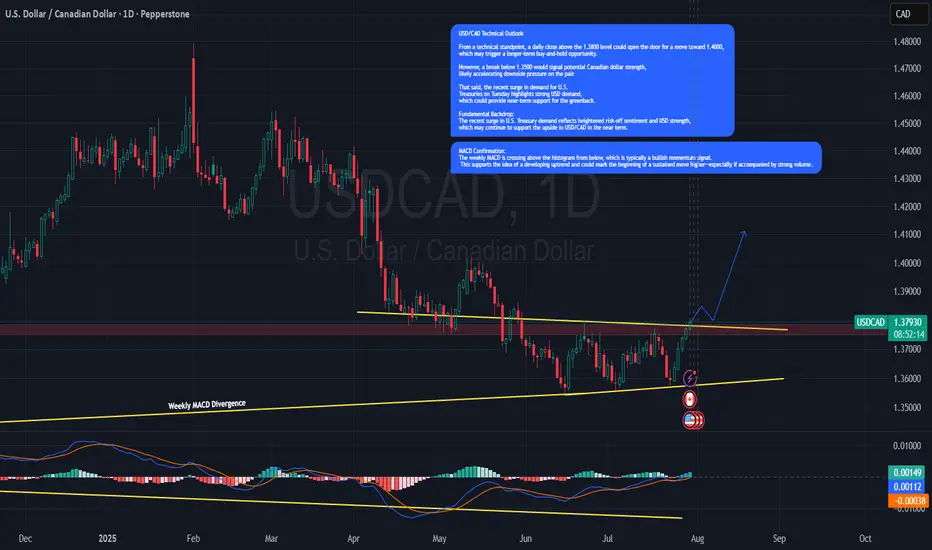
USD/CAD Weekly Technical Outlook
The pair is approaching a key resistance zone around 1.3800 . A weekly close above this level could signal a push toward the 1.4000 handle, opening the door for a longer-term bullish breakout and potential buy-and-hold scenario.
From the downside, a break below 1.3500 would likely trigger Canadian dollar strength, possibly driving the pair much lower.
MACD Confirmation:
The weekly MACD is crossing above the histogram from below, which is typically a bullish momentum signal. This supports the idea of a developing uptrend and could mark the beginning of a sustained move higher—especially if accompanied by strong volume.
Fundamental Backdrop:
The recent surge in U.S. Treasury demand reflects heightened risk-off sentiment and USD strength, which may continue to support the upside in USD/CAD in the near term.
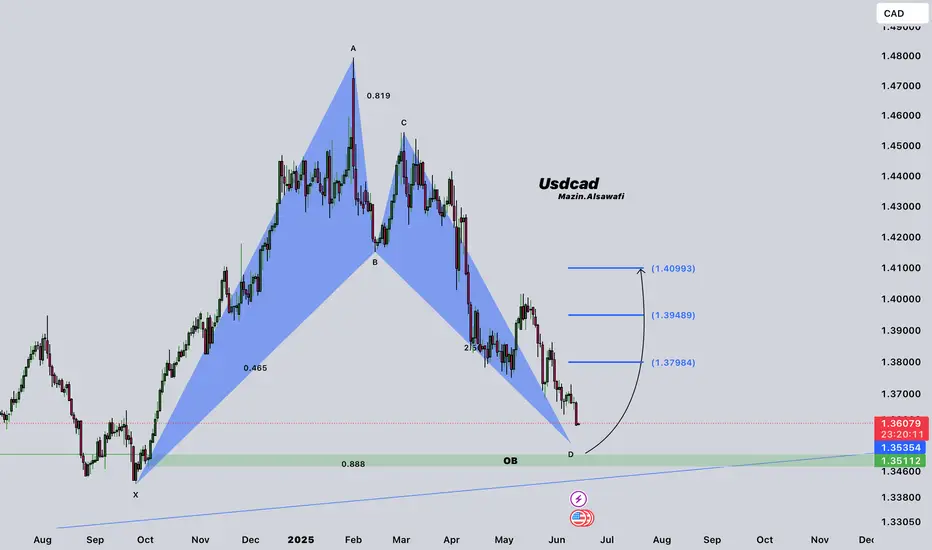
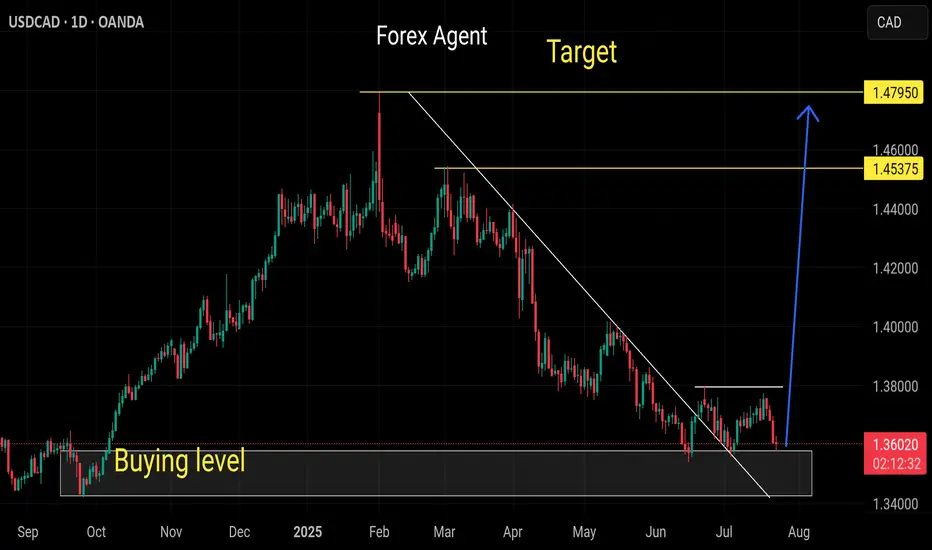
USDCAD analysis 1day frame We have bat 🦇 pattern and also ob ..I expect from this area 1.35114-1.34500 go buy for long to the targets in the chart
USDCAD Wave Analysis – 31 July 2025
- USDCAD broke resistance zone
- Likely rise to resistance level 1.3900
USDCAD currency pair recently broke the resistance zone located between the resistance level 1.3785 (upper border of the sideways price range from the start of June) and the 50% Fibonacci correction of the downward impulse from May.
The breakout of this resistance zone accelerated the active impulse wave 3, which belongs to medium-term impulse wave (B) from the start of July.
USDCAD currency pair can be expected to rise further to the next resistance level 1.3900 (target price for the completion of the active impulse wave 3).

USD/CAD H4 | Potential bearish reversalUSD/CAD is rising towards an overlap resistance and could potentially reverse off this level to drop lower.
Sell entry is at 1.3701 which is an overlap resistance that aligns with the 61.8% Fibonacci retracement.
Stop loss is at 1.3740 which is a level that sits above the 78.6% Fibonacci retracement and an overlap resistance.
Take profit is at 1.3653 which is a pullback support.
High Risk Investment Warning
Trading Forex/CFDs on margin carries a high level of risk and may not be suitable for all investors. Leverage can work against you.
Stratos Markets Limited (tradu.com ):
CFDs are complex instruments and come with a high risk of losing money rapidly due to leverage. 66% of retail investor accounts lose money when trading CFDs with this provider. You should consider whether you understand how CFDs work and whether you can afford to take the high risk of losing your money.
Stratos Europe Ltd (tradu.com ):
CFDs are complex instruments and come with a high risk of losing money rapidly due to leverage. 66% of retail investor accounts lose money when trading CFDs with this provider. You should consider whether you understand how CFDs work and whether you can afford to take the high risk of losing your money.
Stratos Global LLC (tradu.com ):
Losses can exceed deposits.
Please be advised that the information presented on TradingView is provided to Tradu (‘Company’, ‘we’) by a third-party provider (‘TFA Global Pte Ltd’). Please be reminded that you are solely responsible for the trading decisions on your account. There is a very high degree of risk involved in trading. Any information and/or content is intended entirely for research, educational and informational purposes only and does not constitute investment or consultation advice or investment strategy. The information is not tailored to the investment needs of any specific person and therefore does not involve a consideration of any of the investment objectives, financial situation or needs of any viewer that may receive it. Kindly also note that past performance is not a reliable indicator of future results. Actual results may differ materially from those anticipated in forward-looking or past performance statements. We assume no liability as to the accuracy or completeness of any of the information and/or content provided herein and the Company cannot be held responsible for any omission, mistake nor for any loss or damage including without limitation to any loss of profit which may arise from reliance on any information supplied by TFA Global Pte Ltd.
The speaker(s) is neither an employee, agent nor representative of Tradu and is therefore acting independently. The opinions given are their own, constitute general market commentary, and do not constitute the opinion or advice of Tradu or any form of personal or investment advice. Tradu neither endorses nor guarantees offerings of third-party speakers, nor is Tradu responsible for the content, veracity or opinions of third-party speakers, presenters or participants.
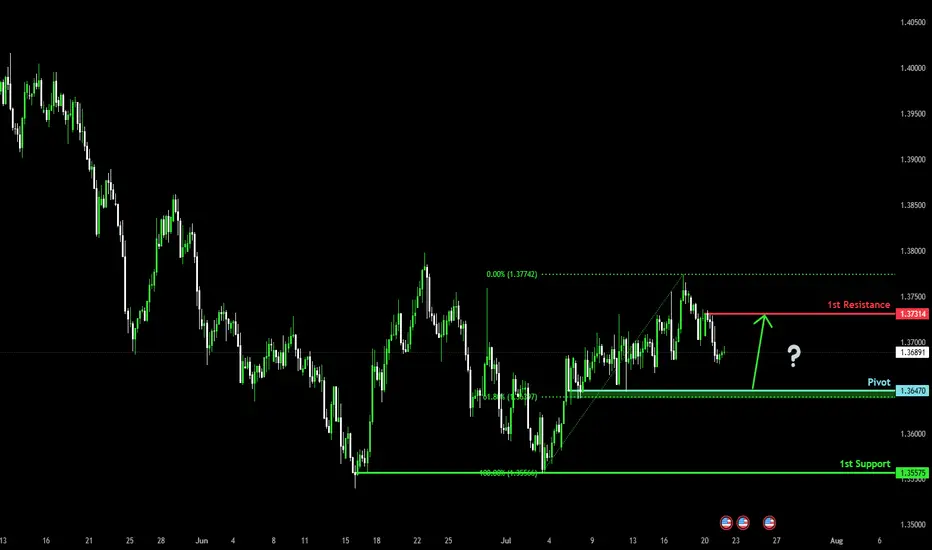
Falling towards pullback support?The Loonie (USD/CAD is falling towards the pivot, which has been identified as a pullback support that aligns with the 61.8% Fibonacci retracement and could bounce to the 1st resistance.
Pivot: 1.3647
1st Support: 1.3557
1st Resistance: 1.3731
Risk Warning:
Trading Forex and CFDs carries a high level of risk to your capital and you should only trade with money you can afford to lose. Trading Forex and CFDs may not be suitable for all investors, so please ensure that you fully understand the risks involved and seek independent advice if necessary.
Disclaimer:
The above opinions given constitute general market commentary, and do not constitute the opinion or advice of IC Markets or any form of personal or investment advice.
Any opinions, news, research, analyses, prices, other information, or links to third-party sites contained on this website are provided on an "as-is" basis, are intended only to be informative, is not an advice nor a recommendation, nor research, or a record of our trading prices, or an offer of, or solicitation for a transaction in any financial instrument and thus should not be treated as such. The information provided does not involve any specific investment objectives, financial situation and needs of any specific person who may receive it. Please be aware, that past performance is not a reliable indicator of future performance and/or results. Past Performance or Forward-looking scenarios based upon the reasonable beliefs of the third-party provider are not a guarantee of future performance. Actual results may differ materially from those anticipated in forward-looking or past performance statements. IC Markets makes no representation or warranty and assumes no liability as to the accuracy or completeness of the information provided, nor any loss arising from any investment based on a recommendation, forecast or any information supplied by any third-party.
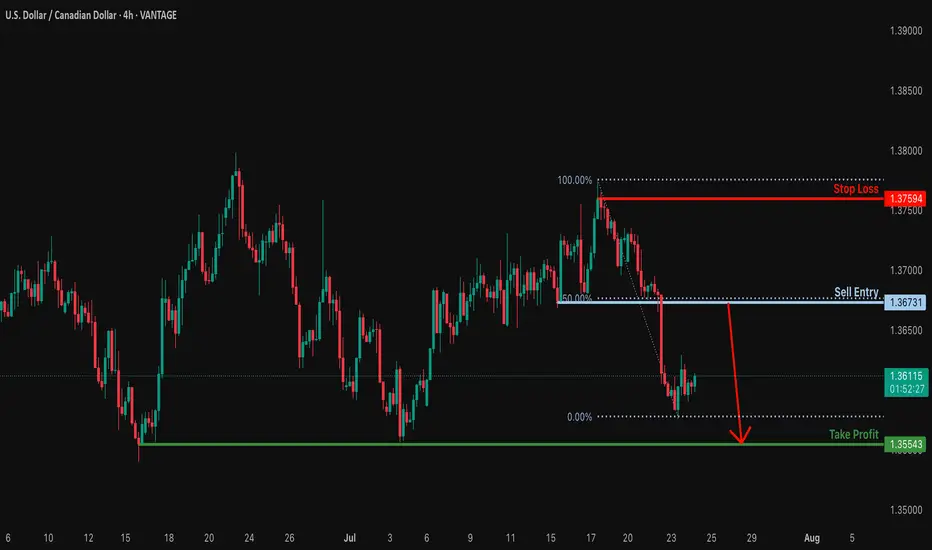
Heading into 50% Fibonacci resistance?USD/CAD is rising towards the resistance which is a pullback reistance that lines up with the 50% Fibonacci retracement and could reverse from this level to our take profit.
Entry: 1.3673
Why we like it:
There is a pullback resistance that lines up with the 50% Fibonacci retracement.
Stop loss: 1.3759
Why we like it:
There is a swing high resistance.
Take profit: 1.3554
Why we like it:
There is a multi swing low support.
Enjoying your TradingView experience? Review us!
Please be advised that the information presented on TradingView is provided to Vantage (‘Vantage Global Limited’, ‘we’) by a third-party provider (‘Everest Fortune Group’). Please be reminded that you are solely responsible for the trading decisions on your account. There is a very high degree of risk involved in trading. Any information and/or content is intended entirely for research, educational and informational purposes only and does not constitute investment or consultation advice or investment strategy. The information is not tailored to the investment needs of any specific person and therefore does not involve a consideration of any of the investment objectives, financial situation or needs of any viewer that may receive it. Kindly also note that past performance is not a reliable indicator of future results. Actual results may differ materially from those anticipated in forward-looking or past performance statements. We assume no liability as to the accuracy or completeness of any of the information and/or content provided herein and the Company cannot be held responsible for any omission, mistake nor for any loss or damage including without limitation to any loss of profit which may arise from reliance on any information supplied by Everest Fortune Group.
USDCAD BUYUSD/CAD returns below 1.3600, with YTD lows, at 1.3540 coming into view
The US Dollar extends its decline for the fourth consecutive day, with the Canadian Dollar supported by a brighter market mood, as the trade deal between the US and Japan provided some certainty about the outlook of global trade and boosted hopes of more such deals.
In the USD/CAD 2025 Forecast, FXStreet analyst Joshua Gibson suggests uncertainty and risk-off sentiment could strengthen the US Dollar (USD) early in 2025, while the Canadian Dollar (CAD) is expected to weaken in the first quarter. However, CAD investors may reassess prospects as the year progresses, focusing on the Federal Reserve (Fed) - Bank of Canada (BoC) policy dynamics.
From a technical point of view, USD/CAD could face a technical ceiling near the 1.4400 level after the Canadian Dollar's sharp 8.5% decline in 2024 sent the pair to 56-month highs. However, technical indicators like the MACD suggest caution, as short positions may only become viable once clear sell signals emerge, likely during the first quarter.
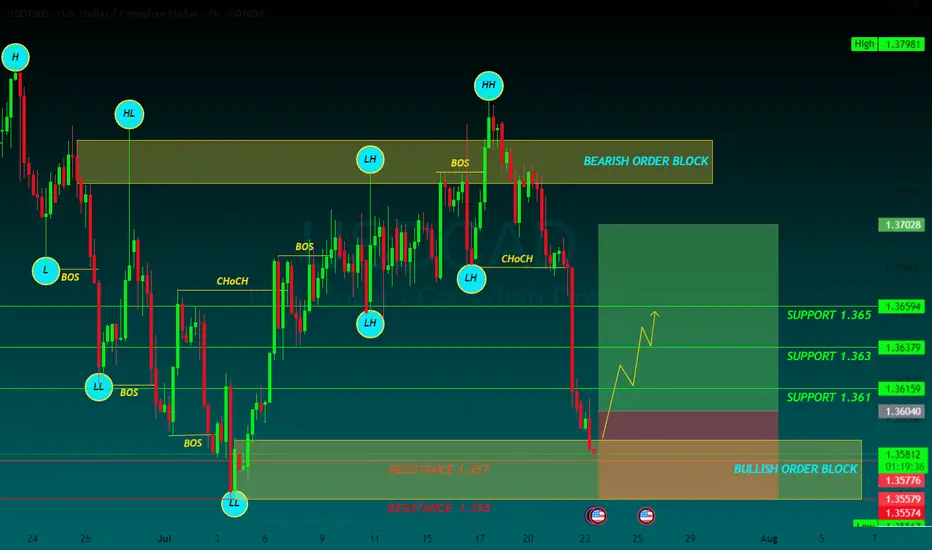
SUPPORT 1.361
SUPPORT 1.353
SUPPORT 1.361
RESISTANCE 1.357
RESISTANCE 1.355
Buy usdcad Buy usdcad and gbpcad. You can set tp 1 at 1.37. Feel free to add Eurcad if daily candle closes as bullish on IDC chart. I'll keep you updated

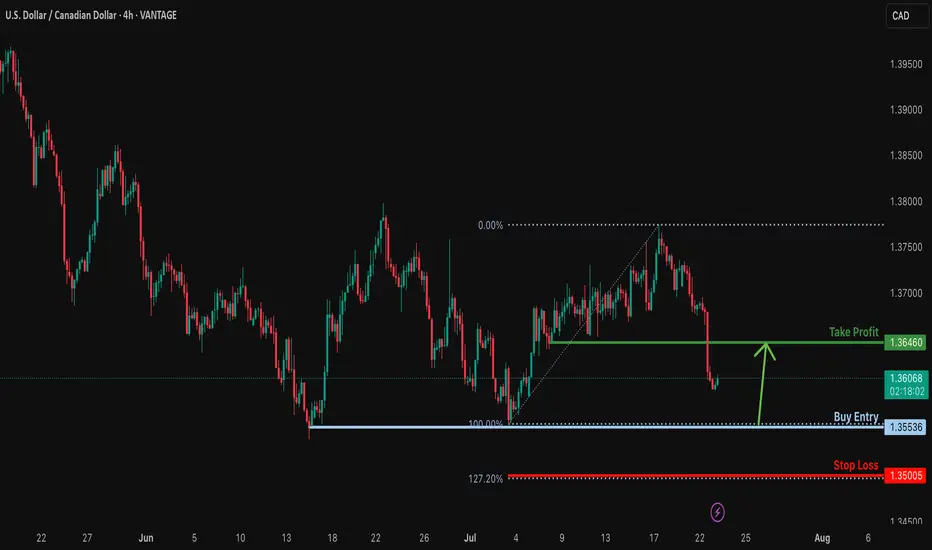
Bullish reversal?USD/CAD is faalling towards the support level which is a multi swing low support and could bounce from this level to our take profit.
Entry: 1.3553
Why we like it:
There is a multi swing low support.
Stop loss: 1.3500
Why we like it:
There is a support at the 127.2% Fibonacc extension.
Take profit: 1.3646
Why we like it:
There is a pullback resistance.
Enjoying your TradingView experience? Review us!
Please be advised that the information presented on TradingView is provided to Vantage (‘Vantage Global Limited’, ‘we’) by a third-party provider (‘Everest Fortune Group’). Please be reminded that you are solely responsible for the trading decisions on your account. There is a very high degree of risk involved in trading. Any information and/or content is intended entirely for research, educational and informational purposes only and does not constitute investment or consultation advice or investment strategy. The information is not tailored to the investment needs of any specific person and therefore does not involve a consideration of any of the investment objectives, financial situation or needs of any viewer that may receive it. Kindly also note that past performance is not a reliable indicator of future results. Actual results may differ materially from those anticipated in forward-looking or past performance statements. We assume no liability as to the accuracy or completeness of any of the information and/or content provided herein and the Company cannot be held responsible for any omission, mistake nor for any loss or damage including without limitation to any loss of profit which may arise from reliance on any information supplied by Everest Fortune Group.
Strong buy usdcadStrong bullish wave expected from this buy zone
Wait to sweep low then buy with short time confirmation
Weekly and monthly still oversold pair
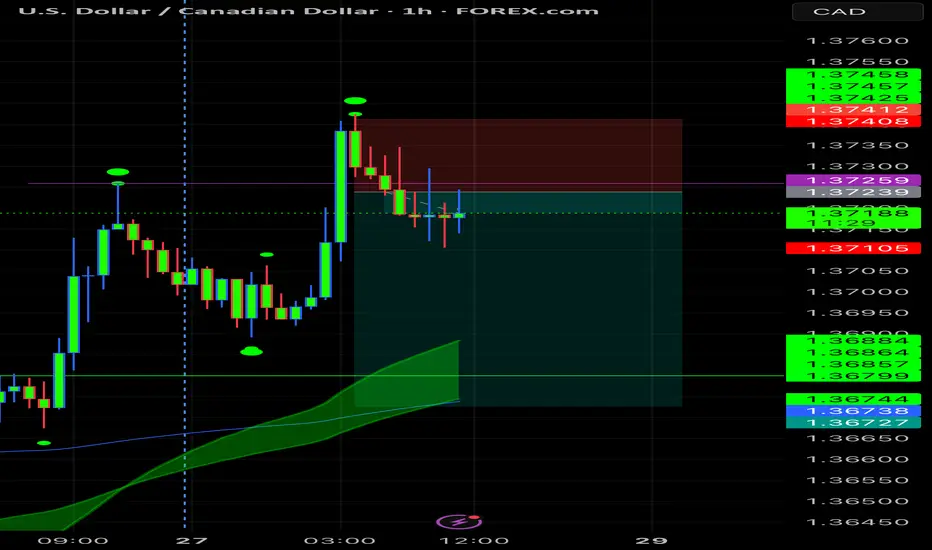
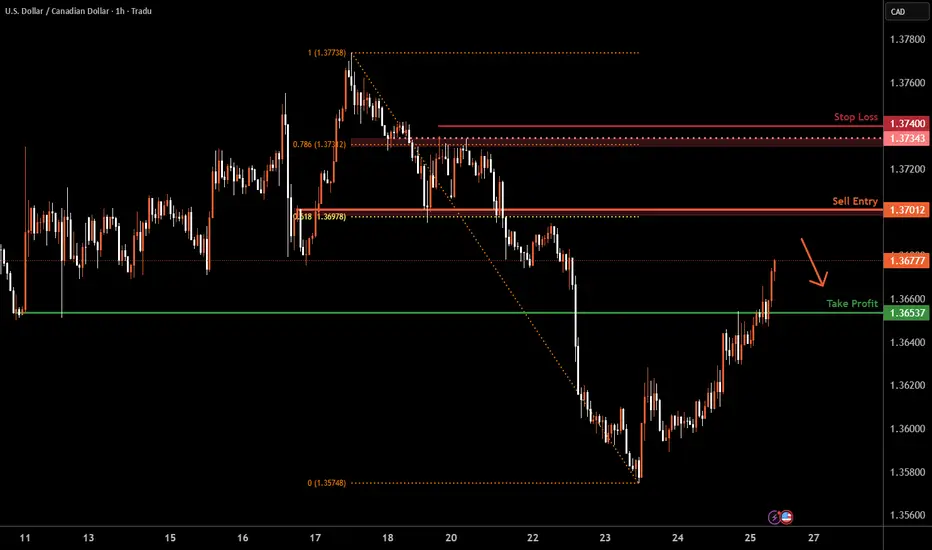
SELL USDCADIn todays session we are monitoring USDCAD for selling opportunities, we have our first entry at 1.36719 and our target is 1.36080 our stop is above 1.3700 , use proper risk management and risk what you can afford. Cheers fam.

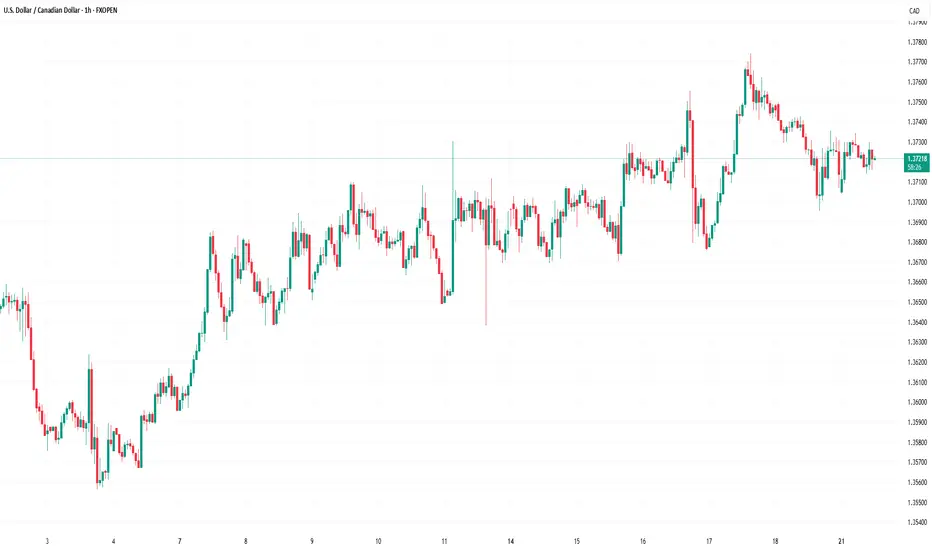
Market Analysis: USD/CAD Consolidates GainsMarket Analysis: USD/CAD Consolidates Gains
USD/CAD declined and now consolidates below the 1.3750 level.
Important Takeaways for USD/CAD Analysis Today
- USD/CAD started a fresh decline after it failed to clear the 1.3775 resistance.
- There is a key bullish trend line forming with support at 1.3715 on the hourly chart at FXOpen.
USD/CAD Technical Analysis
On the hourly chart of USD/CAD at FXOpen, the pair climbed toward the 1.3775 resistance zone before the bears appeared. The US Dollar formed a swing high near 1.3774 and recently declined below the 1.3750 support against the Canadian Dollar.
There was also a close below the 50-hour simple moving average and 1.3735. The pair is now consolidating losses below the 50% Fib retracement level of the downward move from the 1.3774 swing high to the 1.3695 low. But the bulls are active near the 1.3700 level.
If there is a fresh increase, the pair could face resistance near the 1.3735 level. The next key resistance on the USD/CAD chart is near the 1.3755 level or the 61.8% Fib retracement level.
If there is an upside break above 1.3755, the pair could rise toward 1.3775. The next major resistance is near the 1.3800 zone, above which it could rise steadily toward 1.3880.
Immediate support is near the 1.3715 level and a key bullish trend line. The first major support is near 1.3675. A close below the 1.3675 level might trigger a strong decline. In the stated case, USD/CAD might test 1.3650. Any more losses may possibly open the doors for a drop toward the 1.3620 support.
This article represents the opinion of the Companies operating under the FXOpen brand only. It is not to be construed as an offer, solicitation, or recommendation with respect to products and services provided by the Companies operating under the FXOpen brand, nor is it to be considered financial advice.
USDCAD possible 300pips ideaWe have this double bottom formation, re-tested the neckline at 1.3750
We could see a higher low forming around the 50% to 61% fib.
So area of interest to go long here would be at 1.3650 to 1.3620
Will update if oportunity to get in shows up.
Bullish bounce off pullback support?USD/CAD is falling towards the support level which is a pullback support that lines up with the 38.2% Fibonacci retracement and could bounce from this level to our take profit.
Entry: 1.3681
Why we like it:
There is a pullback support level that aligns with the 38.2% Fibonacci retracement.
Stop loss: 1.3645
Why we like it:
There is a pullback support that lines up with the 61.8% Fibonacci retracement.
Take profit: 1.3782
Why we like it:
There is a pullback resistance.
Enjoying your TradingView experience? Review us!
Please be advised that the information presented on TradingView is provided to Vantage (‘Vantage Global Limited’, ‘we’) by a third-party provider (‘Everest Fortune Group’). Please be reminded that you are solely responsible for the trading decisions on your account. There is a very high degree of risk involved in trading. Any information and/or content is intended entirely for research, educational and informational purposes only and does not constitute investment or consultation advice or investment strategy. The information is not tailored to the investment needs of any specific person and therefore does not involve a consideration of any of the investment objectives, financial situation or needs of any viewer that may receive it. Kindly also note that past performance is not a reliable indicator of future results. Actual results may differ materially from those anticipated in forward-looking or past performance statements. We assume no liability as to the accuracy or completeness of any of the information and/or content provided herein and the Company cannot be held responsible for any omission, mistake nor for any loss or damage including without limitation to any loss of profit which may arise from reliance on any information supplied by Everest Fortune Group.

USDCAD SELLUSD/CAD rallies to 1.3680 as the market focuses on a hawkish Fed
The US Dollar extends its recovery for the second consecutive day, supported by strong US data. Upbeat US business activity and Jobless Claims support the Fed's "wait and see" rhetoric. In Canada, the weak Retail Sales data keep hopes for a BoC rate cut alive.
The year will be politically marked by Trump’s return to the White House. A Republican government is seen as positive for financial markets, but Trump’s pledge to cut taxes and impose tariffs on foreign goods and services may introduce uncertainty to both the political and economic landscape.
Canada’s political crisis peaked in late 2024 with a no-confidence vote against Prime Minister Justin Trudeau, leading to snap elections and a weakened Liberal minority government. Policy uncertainty and economic challenges dominate 2025’s outlook, raising concerns over market stability and investor confidence.
The BoC is set to continue easing interest rates through 2025, at least at a faster pace than the Fed is expected to, which could apply pressure on CAD’s already-rising rate differential.
SUPPORT 1.36991
SUPPORT 1.36739
SUPPORT 1.36495
RESISTANCE 1.37346
RESISTANCE 1.37455
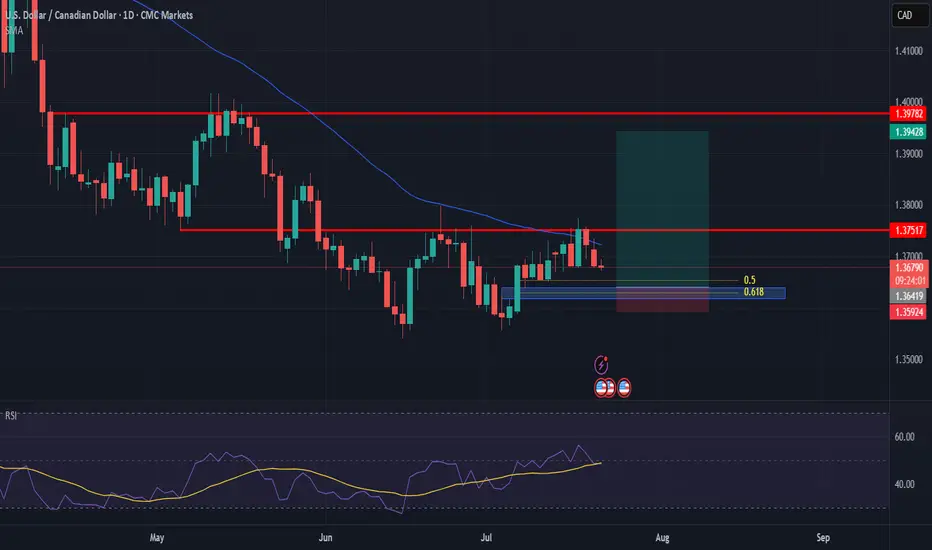
UC BULLISH C-D HARMONIC PATTERN Looking for price to finally break above the daily resistance for price to start a bullish rally towards Weekly resistance marked in green.

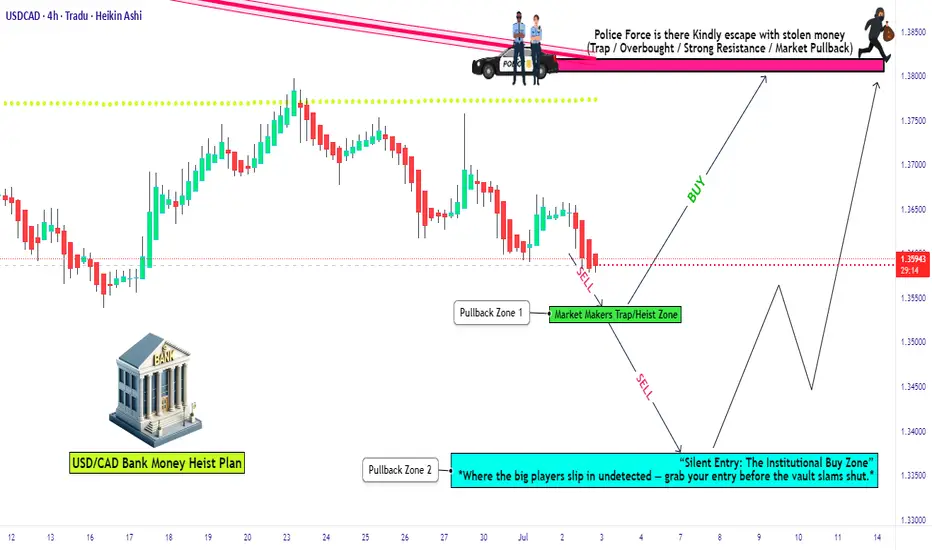
USD/CAD Institutional Buy Zone – Thief Trading Alert!🔥 USD/CAD "LOONIE BANK HEIST" 🔥 – THIEF TRADING STYLE (BULLISH SNIPER PLAN)
💸 ATTENTION: Market Robbers & Profit Pirates!
"Steal Like a Pro – Escape Before the Cops Arrive!"
🎯 MASTER TRADE PLAN (Based on Thief Trading Tactics):
Entry Zone (Pullback Heist):
📌 Pullback-1: Market Maker Trap Zone (1.35400+) – Wait for retest!
📌 Pullback-2: Institutional Buy Zone (1.33500+) – Confirm bullish momentum!
"Patience = Perfect Heist Timing. Don’t rush—ambush the trend!"
🎯 Profit Target: 1.38100 (or escape earlier if momentum fades).
🛑 Stop Loss (Escape Route): Nearest 4H Swing Low (wick/close) – Adjust based on risk & lot size!
🚨 SCALPERS’ WARNING:
"Only snipe LONG! Big pockets? Strike now. Small stack? Join swing robbers & trail your SL!"
📉 WHY THIS HEIST? (Bullish Triggers):
Technical + Fundamental alignment (COT, Macro, Sentiment).
Overbought but institutional demand holding strong.
"Bears are trapped—time to rob their stops!"
⚠️ CRITICAL ALERT:
News = Volatility = Police Ambush!
Avoid new trades during high-impact news.
Trailing SL = Your Getaway Car! Lock profits before reversals.
💥 BOOST THIS HEIST!
"Hit 👍, 🔔 Follow, and 🚀 Boost to fuel our next robbery! Let’s drain the banks together!"
🔮 NEXT HEIST COMING SOON… Stay tuned, partner! 🎭💰
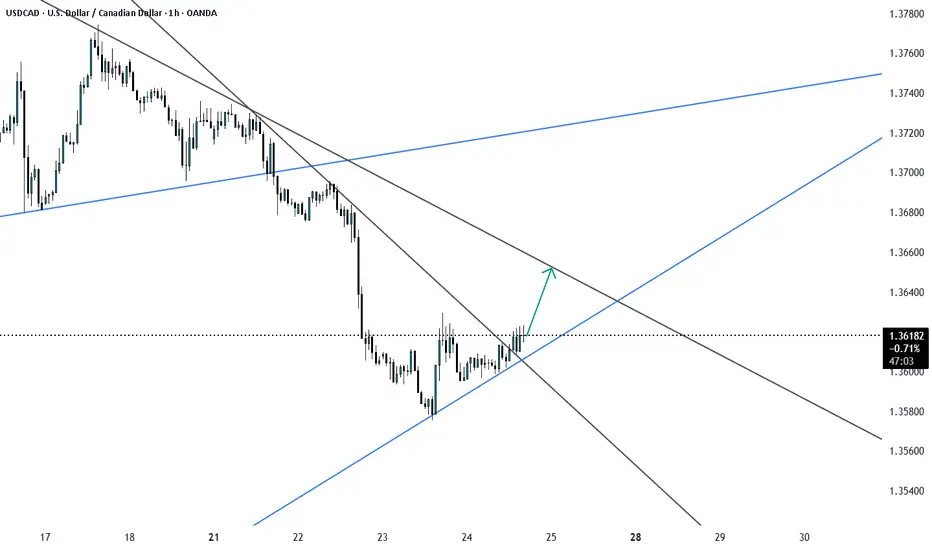
USDCAD Break the trendline resistance USDCAD has brokend the trendline resistance is likely to to go next resistance as shown in the chart. The set up is valid till the uptrend trendline is respected by the price.
USDCAD Analysis – July 16, 2025
Following the ceasefire between Iran and Israel, oil prices have weakened, reducing support for the Canadian dollar, which is closely tied to crude. As a result, CAD could remain among the weaker currencies over the next two weeks.
Meanwhile, the US dollar may gain strength following the CPI data released on July 15, 2025, potentially setting up a favorable swing opportunity for USDCAD bulls.
🟥 High-Risk Setup – R:R 7.0
This aggressive setup targets a sharp upside move with a tight stop loss, aiming for a high reward relative to the risk. It's suitable for traders comfortable with volatility and willing to accept a lower probability for a higher payout.
🟦 Moderate-Risk Setup – R:R 2.5
A more balanced scenario with a wider stop and a closer target, offering a higher probability of success and smoother trade management. This setup aligns well with swing trading strategies seeking consistent results.
Both setups are based on the current price action structure visible on the chart.
Trade safe, manage your risk, and follow your plan. ✅

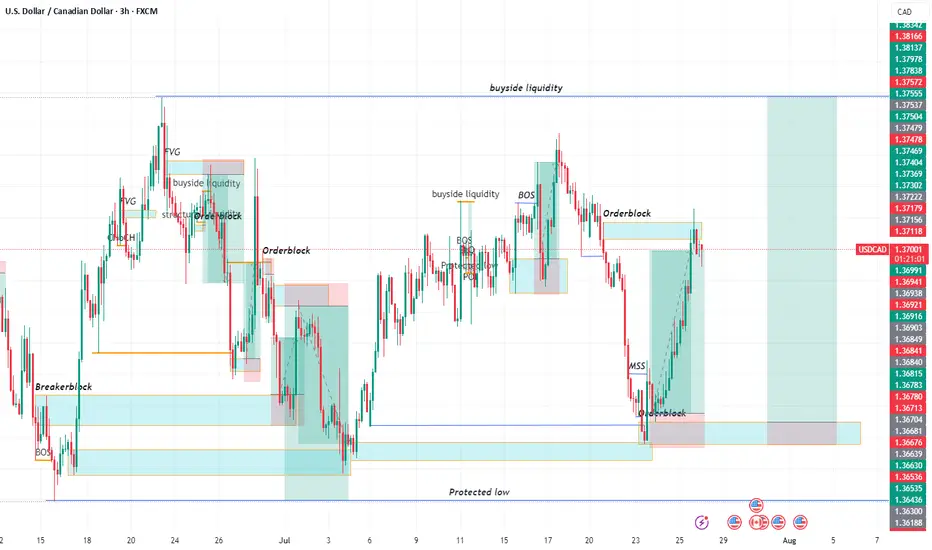
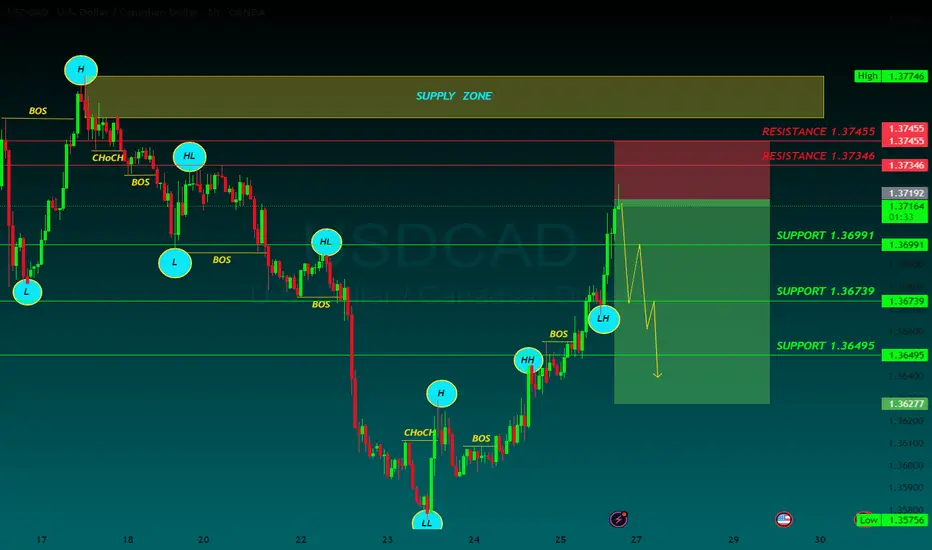
USDCAD Sell Move PossibleAs USDCAD is in Downtrend, we can expect a sell side move from this OB in NY Session towards low SSL.
Friday Closing also coming near so plan trade accordingly.
