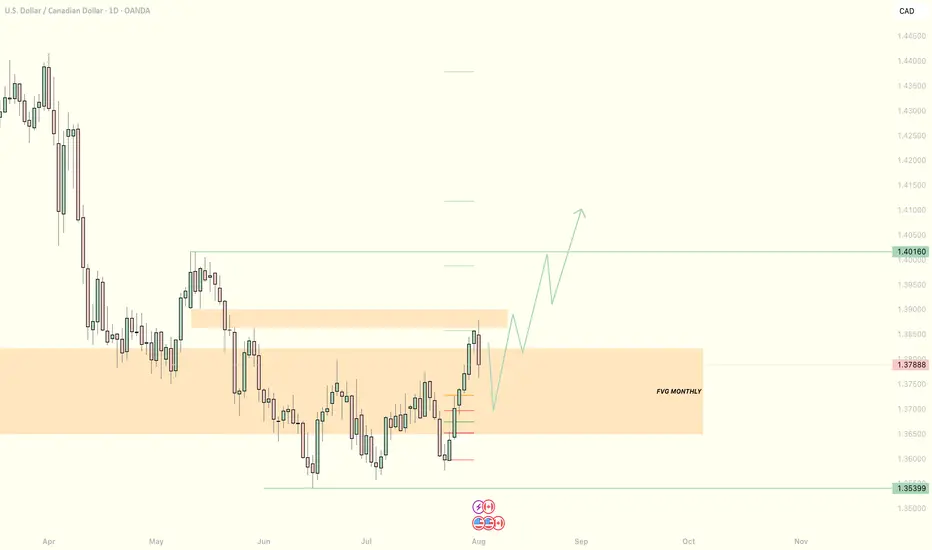
BUY USDCADUSDCAD is currently i a good and clearpoint of interest , i expect the market to push ever since it has already changed its bearish character to bullish , with a supporting trendline liquidity whivch has been swapped out with a bearish push
use proper risk management
and goodluck.. manage ur trades well
USDCAD trade ideas


USD/CAD BULLS WILL DOMINATE THE MARKET|LONG
Hello, Friends!
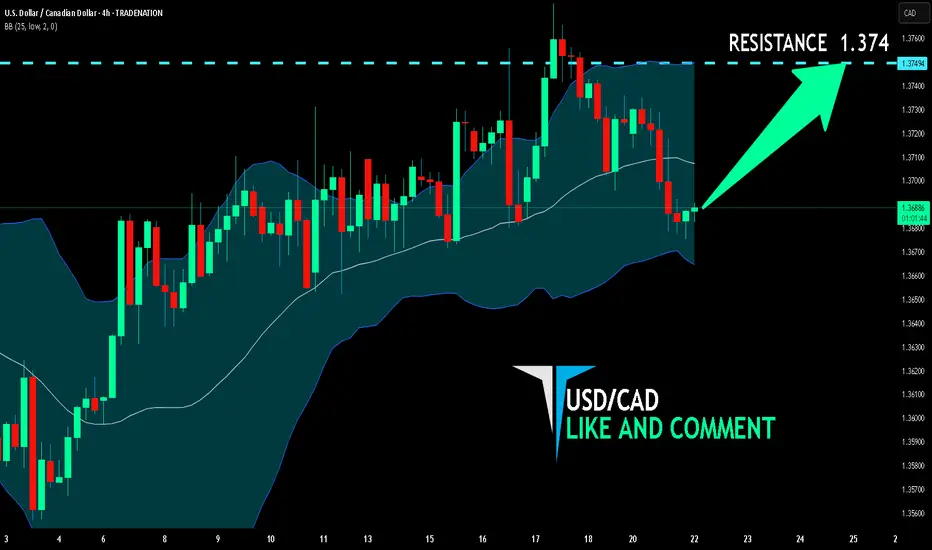
USD/CAD pair is in the uptrend because previous week’s candle is green, while the price is clearly falling on the 4H timeframe. And after the retest of the support line below I believe we will see a move up towards the target above at 1.374 because the pair is oversold due to its proximity to the lower BB band and a bullish correction is likely.
Disclosure: I am part of Trade Nation's Influencer program and receive a monthly fee for using their TradingView charts in my analysis.
✅LIKE AND COMMENT MY IDEAS✅
USDCAD about to Burst soon!Consolidating in 1H and 30M.
Maybe something big is going to happen during the London Session.
We wait for a nice bearish candle to enter. Also, it will be nice to see price go below the blue line drawn, as it will give us further confirmation about the downwards move.

USDCAD(20250721)Today's AnalysisMarket news:
Waller refused to comment on whether he would dissent at the July meeting, saying that the private sector was not performing as well as people thought, and said that if the president asked him to be the chairman of the Federal Reserve, he would agree.
Technical analysis:
Today's buying and selling boundaries:
1.3725
Support and resistance levels:
1.3785
1.3763
1.3748
1.3702
1.3687
1.3665
Trading strategy:
If the price breaks through 1.3725, consider buying, and the first target price is 1.3748
If the price breaks through 1.3702, consider selling, and the first target price is 1.3687
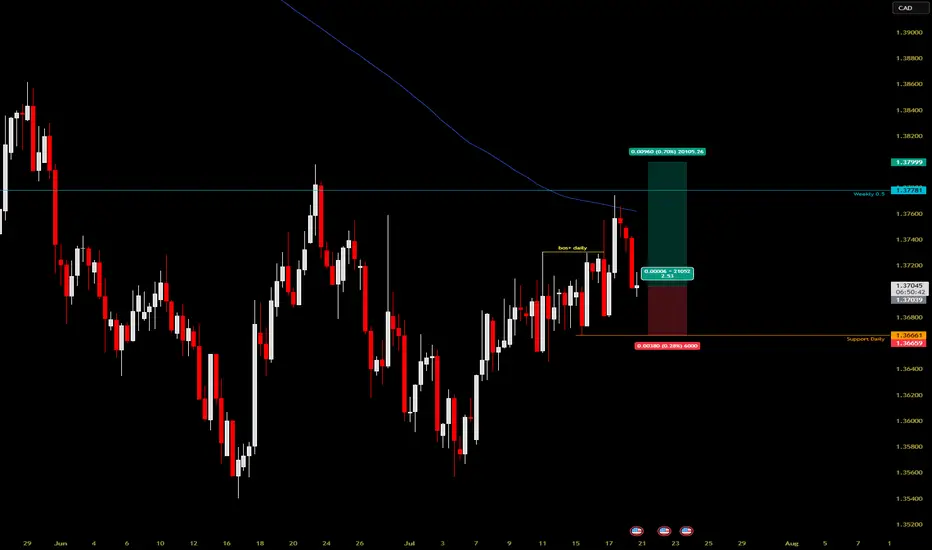
USDCAD LongsEntry
1.3704
Stoploss at the Daily support
1.36661
TargetMarket structure daily high
1.38000
Commitment of traders data showed increase Canadian $ selling and increase USD buying pressure.
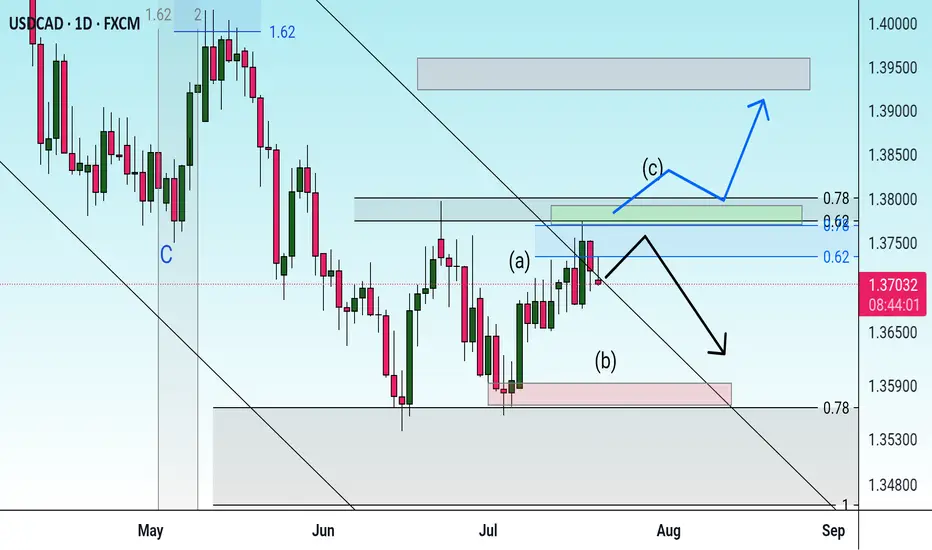
Possibility of correction As long as the price does not stabilize above the green resistance area, there is a possibility of a trend change and the start of a downtrend.
USDCAD: Long Trading Opportunity
USDCAD
- Classic bullish pattern
- Our team expects retracement
SUGGESTED TRADE:
Swing Trade
Buy USDCAD
Entry - 1.3618
Stop - 1.3586
Take - 1.3685
Our Risk - 1%
Start protection of your profits from lower levels
Disclosure: I am part of Trade Nation's Influencer program and receive a monthly fee for using their TradingView charts in my analysis.
❤️ Please, support our work with like & comment! ❤️

USDCAD setting up for sell opportunitiesHello,
USDCAD is gearing up for a potential drop on the 8-hour timeframe. From a technical perspective, the pair is currently in a corrective phase after a strong bearish move from the recent highs. As price nears key moving averages, we anticipate the correction to complete, paving the way for another leg down. The MACD is also approaching the zero line, signaling that sellers could be preparing to take control.
On the fundamental side, this week is packed with high-impact events that could drive volatility. Key catalysts include:
Wednesday: FOMC meeting minutes release & a speech from President Trump.
Thursday: Initial jobless claims and crude oil inventory data.
Friday: S&P Global Manufacturing PMI and Global Services PMI.
These events are expected to influence the US dollar significantly. A weaker dollar could favor further downside in USDCAD. Additionally, trade policy remains a major market driver—Trump had initially imposed tariffs on Canada but later postponed them for a month, adding another layer of uncertainty.
With both technical and fundamental factors aligning, we maintain a bearish outlook on USDCAD in the near term. You can trade this pair using brokers that integrate with TradingView. tradingview.com/brokers/ such as TradeNation.
Good luck!

USDCAD Bearish continuation below 1.3670The USDCAD pair is currently trading with a bearish bias, aligned with the broader downward trend. Recent price action shows a retest of the falling resistance, suggesting a continuation breakdown within the downtrend.
Key resistance is located at 1.3670, a prior consolidation zone. This level will be critical in determining the next directional move.
A bearish rejection from 1.3670 could confirm the resumption of the downtrend, targeting the next support levels at 1.3570, followed by 1.3540 and 1.3500 over a longer timeframe.
Conversely, a decisive breakout and daily close above 1.3670 would invalidate the current bearish setup, shifting sentiment to bullish and potentially triggering a move towards 1.3690, then 1.3720.
Conclusion:
The short-term outlook remains bearish unless the pair breaks and holds above 1.3670. Traders should watch for price action signals around this key level to confirm direction. A rejection favours fresh downside continuation, while a breakout signals a potential trend reversal or deeper correction.
This communication is for informational purposes only and should not be viewed as any form of recommendation as to a particular course of action or as investment advice. It is not intended as an offer or solicitation for the purchase or sale of any financial instrument or as an official confirmation of any transaction. Opinions, estimates and assumptions expressed herein are made as of the date of this communication and are subject to change without notice. This communication has been prepared based upon information, including market prices, data and other information, believed to be reliable; however, Trade Nation does not warrant its completeness or accuracy. All market prices and market data contained in or attached to this communication are indicative and subject to change without notice.

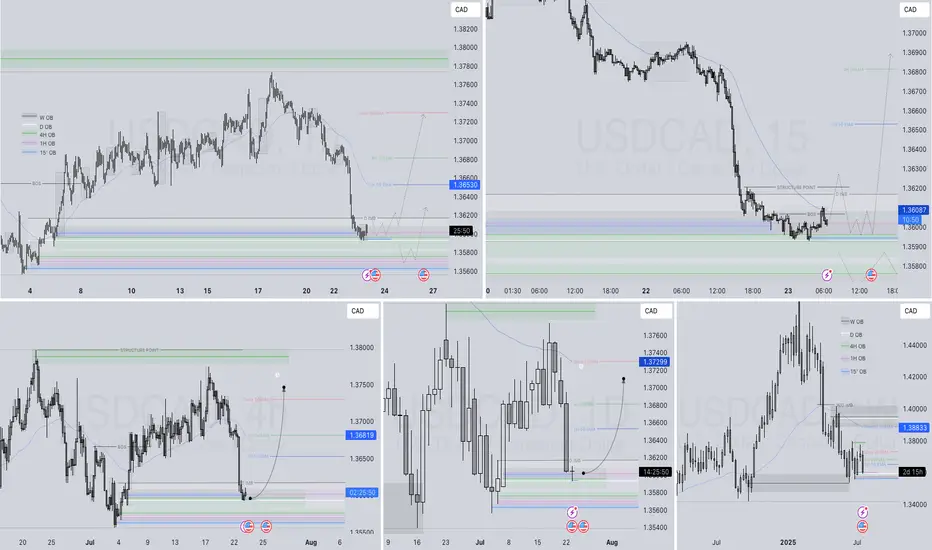
USCAD Q3 | D23 | W30 | Y25📊USCAD Q3 | D23 | W30 | Y25
Daily Forecast🔍📅
Here’s a short diagnosis of the current chart setup 🧠📈
Higher time frame order blocks have been identified — these are our patient points of interest 🎯🧭.
It’s crucial to wait for a confirmed break of structure 🧱✅ before forming a directional bias.
This keeps us disciplined and aligned with what price action is truly telling us.
📈 Risk Management Protocols
🔑 Core principles:
Max 1% risk per trade
Only execute at pre-identified levels
Use alerts, not emotion
Stick to your RR plan — minimum 1:2
🧠 You’re not paid for how many trades you take, you’re paid for how well you manage risk.
🧠 Weekly FRGNT Insight
"Trade what the market gives, not what your ego wants."
Stay mechanical. Stay focused. Let the probabilities work.
FRGNT
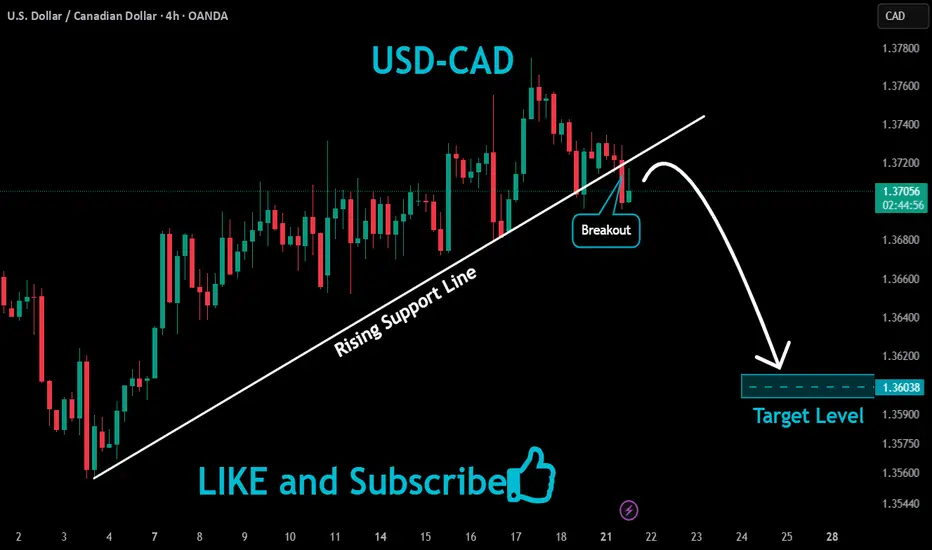
USDCAD Bearish Breakout!
HI,Traders !
#USDCAD was trading along
The rising support line but
Now we are seeing a bearish
Breakout so we are bearish
Biased and we will be expecting
A further bearish move down !
Comment and subscribe to help us grow !
Bearish Break of Trendline + Retest | Short SetupPrice has broken below the ascending trendline, indicating a potential shift in market structure. The recent bearish momentum suggests sellers are gaining control. After the breakout, price is now retesting the underside of the trendline, providing a potential short entry opportunity.
Entry: On retest confirmation below the trendline
Stop Loss: Above the recent swing high (red zone)
Take Profit: Toward the previous demand zone (highlighted blue support area)
This setup aligns with trendline break-and-retest principles and anticipates a move back toward significant demand.

USDCAD BUYLooking for USDCAD to push lower and activate orders underneath the daily swing low that is highlighted.
To have an entry we are looking to approach and take low in a corrective manner, to form the first 15minute swing low after taking the zone and then to push down one last time to activate more buy orders before pushing up to the high of the first consolidation highlighted on the chart.
Must see CVD absorption once the low is taken before looking for a 1 minute reversal for the entry.
Stoploss below what will be the newly formed low (allow 3 pips below this)

USDCAD Will Move Higher! Long!
Take a look at our analysis for USDCAD.
Time Frame: 2h
Current Trend: Bullish
Sentiment: Oversold (based on 7-period RSI)
Forecast: Bullish
The market is testing a major horizontal structure 1.368.
Taking into consideration the structure & trend analysis, I believe that the market will reach 1.373 level soon.
P.S
We determine oversold/overbought condition with RSI indicator.
When it drops below 30 - the market is considered to be oversold.
When it bounces above 70 - the market is considered to be overbought.
Disclosure: I am part of Trade Nation's Influencer program and receive a monthly fee for using their TradingView charts in my analysis.
Like and subscribe and comment my ideas if you enjoy them!

Buying usdcadUsdcad completed its bearish wave now ready for the bullish correction
Daily sell trend already breaks and Candel close above the sell trend

Tricky USDCAD . let the market decide - we follow Hello traders , here is the full multi time frame analysis for this pair, let me know in the comment section below if you have any questions , the entry will be taken only if all rules of the strategies will be satisfied. wait for more price action to develop before taking any position. I suggest you keep this pair on your watchlist and see if the rules of your strategy are satisfied.
🧠💡 Share your unique analysis, thoughts, and ideas in the comments section below. I'm excited to hear your perspective on this pair .
💭🔍 Don't hesitate to comment if you have any questions or queries regarding this analysis.

My USDCAD bullish senarioAs dxy looks like it wants to retrace higher, I would expect the same outcome with USDCAD . Ive outlined what im looking for as price retrace from a key area back into 50% of daily fib to look for long side buys. Let's see how this pans out
In the big picture ,it is seen as the end of Wave 4 This is likely to be the strart of downtrened in wave 1 of wave 5.

Usd/Cadafter three bottoms its time to go up , return to my last chart on CAD u can see what i have said, buy.

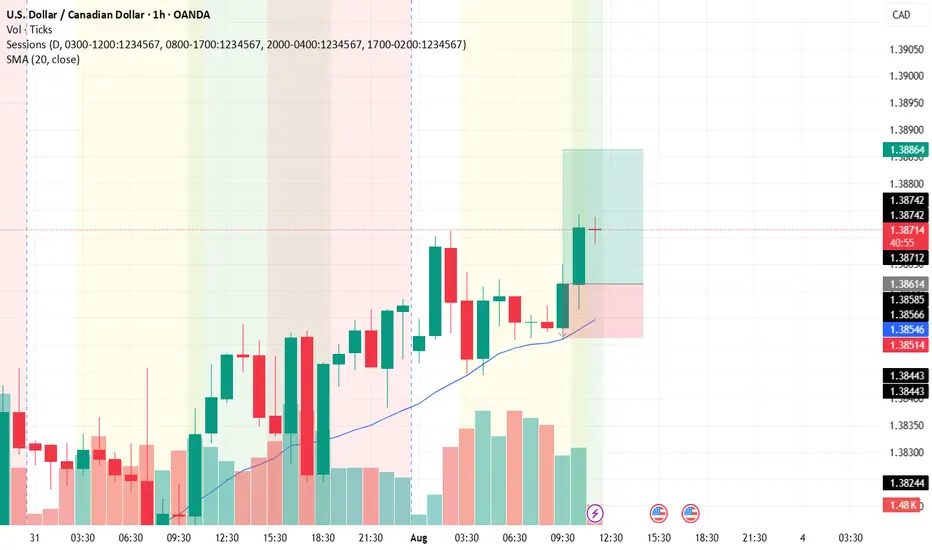
USD/CADThis is a trade setup for USD/CAD, based on volume and trend analysis.
Entry Price: 1.38614
Stop-Loss (SL): 1.38514
Take-Profit (TP): 1.38864
The trade is intended to be executed instantly at the mentioned price, in alignment with both volume behavior and the current trend direction.
Disclaimer: This setup is shared purely for backtesting purposes and to document trade ideas. It is not financial advice. Always perform your own analysis before making any trading decisions.
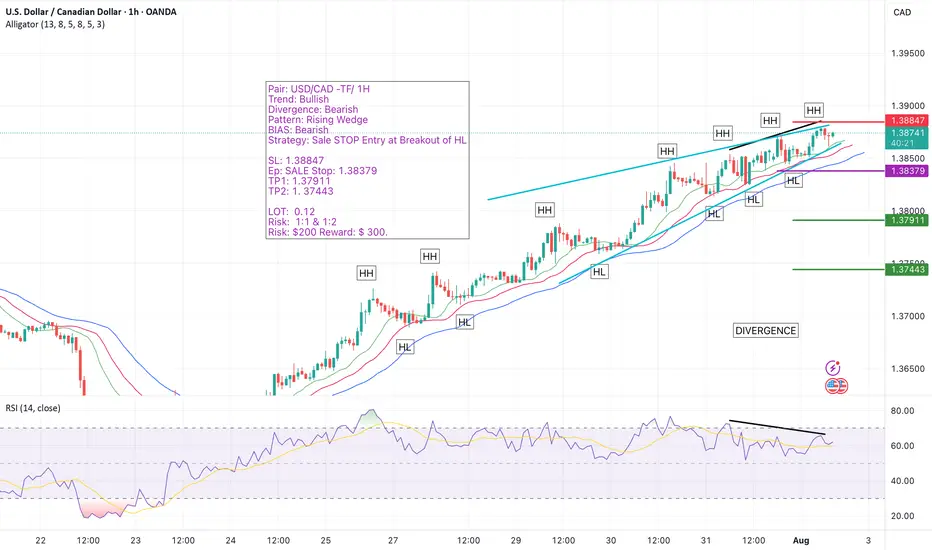
USD/CAD 1H Setup – Bearish Reversal Incoming? We’re closely watching the USD/CAD pair on the 1-hour timeframe, and the chart is flashing multiple high-probability reversal signals.
🔹 The trend has been bullish, but momentum is weakening.
🔹 A clear bearish divergence has formed on the oscillator.
🔹 A rising wedge — one of the most reliable reversal patterns — is fully developed and ready to break.
🔹 All signs point toward an imminent bearish shift, and we're preparing to catch the move early with a Sell Stop below the key Higher Low (HL).
📌 Trade Setup at a Glance:
Pair: USD/CAD
Timeframe: 1H
Trend: Bullish (for now)
Divergence: Bearish
Pattern: Rising Wedge
Bias: Bearish
Strategy: Sell Stop at HL Breakout
🟡 Entry: 1.38379 (Sell Stop)
🔴 Stop Loss: 1.38847
🟢 Take Profit 1: 1.37911 (R:R 1:1)
🟢 Take Profit 2: 1.37443 (R:R 1:2)
📊 Position Sizing & Risk Management
🔹 Lot Size: 0.25
🔹 Risk Per Trade: $200
🔹 Total Reward Target: Up to $300
🔹 Executing two trades – one targeting TP1, the second targeting TP2.
📈 Why This Setup Matters:
✅ Bearish divergence shows clear loss of bullish strength
✅ Rising wedge pattern aligns perfectly with reversal expectations
✅ Well-structured entry with favorable risk-to-reward
✅ Using a split-target strategy to lock in profits smartly
📣 Let’s Discuss!
💬 Drop your thoughts and analysis in the comments — how are you trading USD/CAD?
🔔 Follow me for more high-probability trade setups, chart breakdowns, and real-time analysis. Let’s trade smart and grow together! 🚀
#USDCAD #ForexSetup #RisingWedge #BearishDivergence #PriceActionTrading #SmartMoney #TrendReversal #FXSignals #SellSetup #TradingStrategy #ChartPatterns #BreakoutStrategy #TradeSmart #1HourChart #RiskReward #ForexTrade #TechnicalSetup #TradeIdeas #TradingCommunity #ForexEducation #TradersOfTradingView #SmartEntry #SwingTrading #TradingMindset #TradingViewSetup #ForexAnalysis