USDCAD Will Go Up From Support! Long!
Take a look at our analysis for USDCAD.
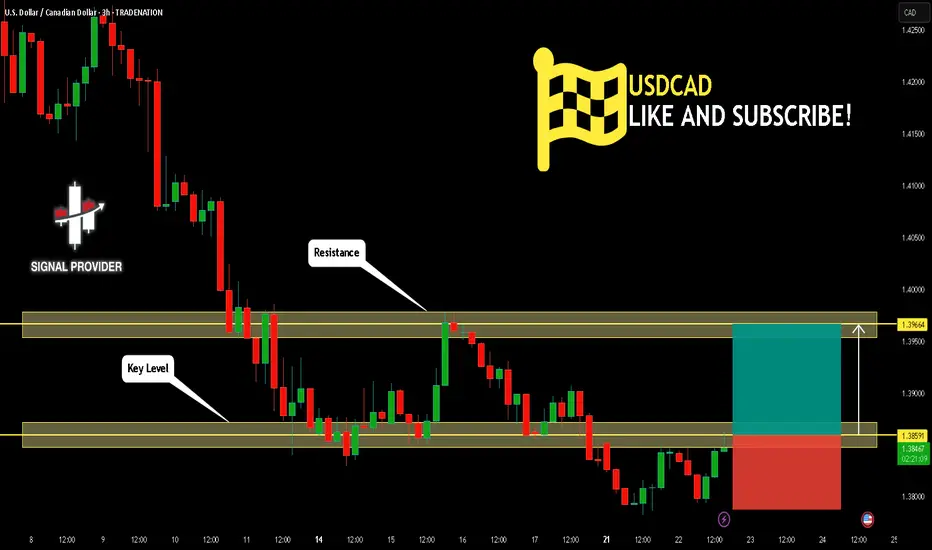
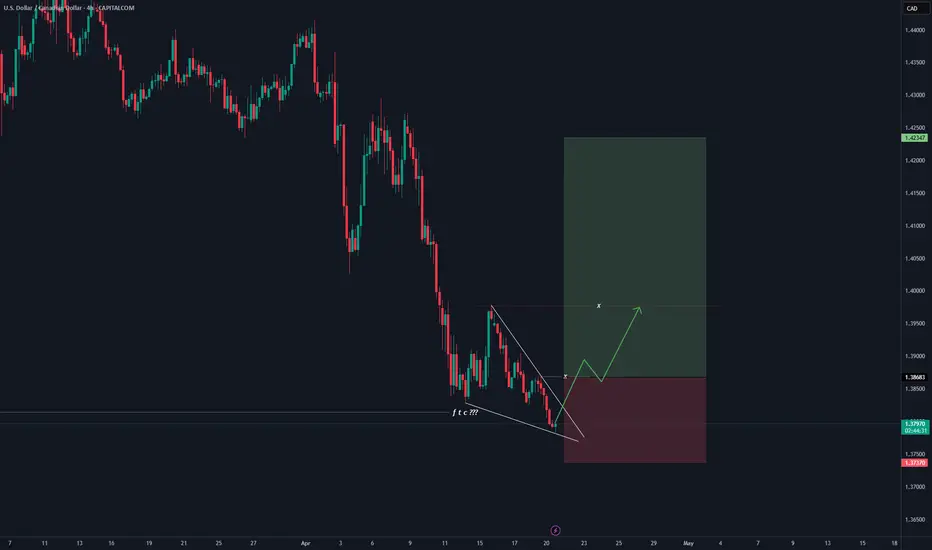
Time Frame: 3h
Current Trend: Bullish
Sentiment: Oversold (based on 7-period RSI)
Forecast: Bullish
The market is on a crucial zone of demand 1.385.
The oversold market condition in a combination with key structure gives us a relatively strong bullish signal with goal 1.396 level.
P.S
Please, note that an oversold/overbought condition can last for a long time, and therefore being oversold/overbought doesn't mean a price rally will come soon, or at all.
Disclosure: I am part of Trade Nation's Influencer program and receive a monthly fee for using their TradingView charts in my analysis.
Like and subscribe and comment my ideas if you enjoy them!
USDCAD trade ideas
usdcad buy tradeThe Relative Strength Index (RSI) is showing an upward trend, indicating increasing momentum. Additionally, the Moving Average Convergence Divergence (MACD) is showing a bullish crossover, further supporting the potential for an upward move.
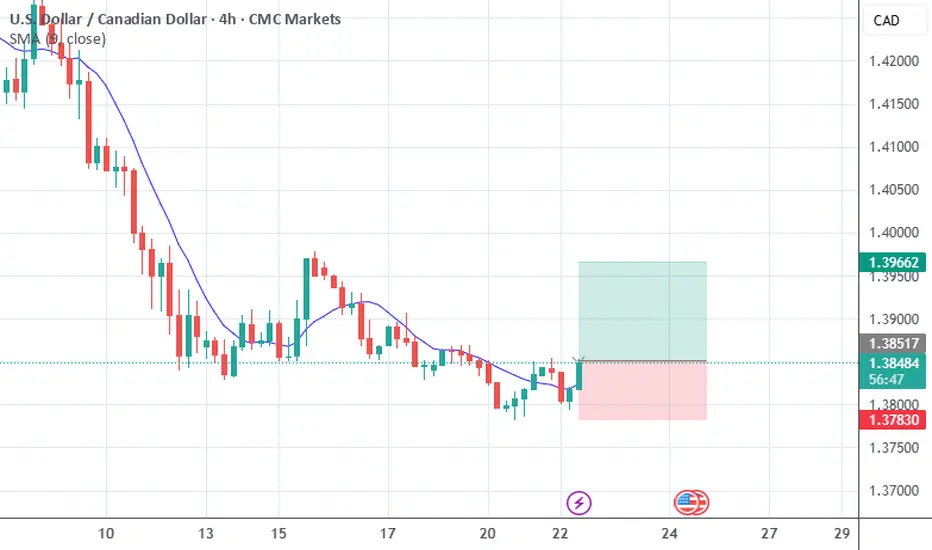
Daily Price Action USDCAD Tuesday 4/22/2025In this video, we will be looking into the potential price action of USDCAD.

USDCAD A break of the 4hr structure would call for the following, A break of the daily that would lead us breaking the 4hr BOT. Unless Trump does the unthinkable, this will be a good swing trade to hold.
Based on the weekly, it would indicate the end of the W. counter trend and a continuation of the bullish move

Trend BreakoutIf you're a low risk trader and want more confirmation go to a lower timeframe eg. 15 minutes wait for a double bottom once it breakout the neck line jump in ,but don't forget to to use a proper risk management
N.B this is not a financial advise

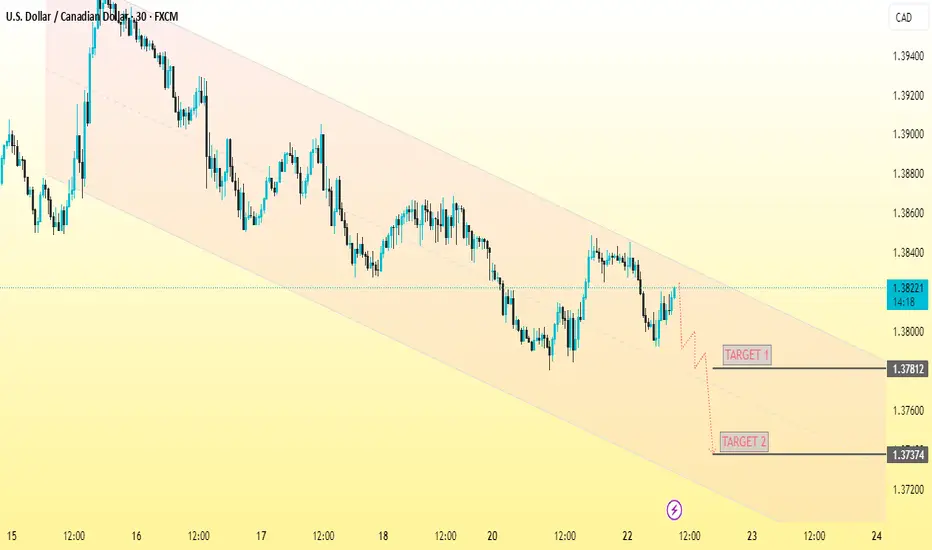
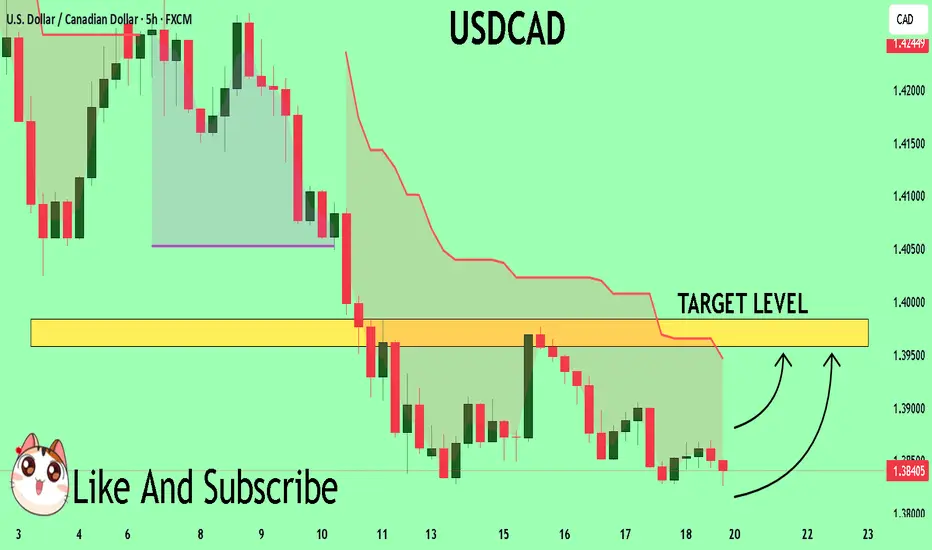
USD/CAD Analysis (30min TimeframeUSD/CAD
Timeframe: 30-Minute Chart
Trend: Bearish (within a descending channel)
---
Entry Point:
Entry Price: 1.38192 (current market price marked on chart)
---
Take Profit Targets:
TP1: 1.37812 (labeled "TARGET 1")
Final TP (TP2): 1.37374 (labeled "TARGET 2")
---
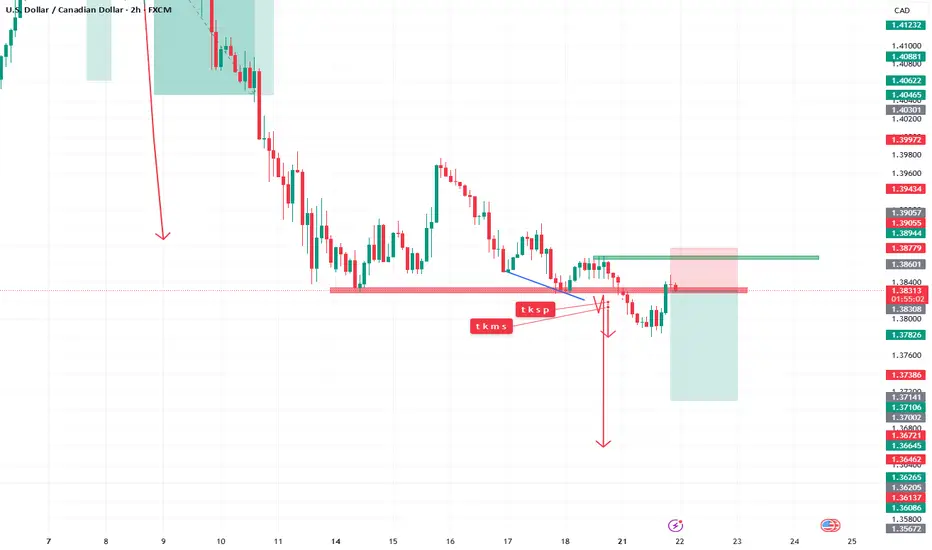
Support Levels:
1.37812 – First major support level (TP1)
1.37374 – Second strong support level (TP2, previous structure low)
---
Resistance Levels:
1.38192 – Current entry zone and minor resistance (short-term reaction level)
1.38400 - 1.38500 – Mid-channel resistance area
1.38700+ – Upper trendline resistance (from channel)
---
Chart Structure:
Descending Channel: Price is respecting a downward sloping parallel channel.
Bearish Momentum: Lower highs and lower lows.
Entry at Pullback: Entry aligns with a pullback to channel mid-zone.
---
Suggested Caption to Share with Your Client:
> USD/CAD Trade Setup (30-Min Chart):
Price is trending inside a descending channel.
Entry: 1.38192
TP1: 1.37812
Final TP: 1.37374
Trend: Bearish
Expecting continuation to downside after pullback.
Key Resistance: 1.38400–1.38700
Key Support: 1.37812, 1.37374
Watch for bearish confirmation at entry level before executing.
Long on CADThe price divergence on CAD is good for a typical double bottom
Trendline has also been broken

usdcad short/sellSignificant key levels reactions #trends #analysis #forex use proper risk management
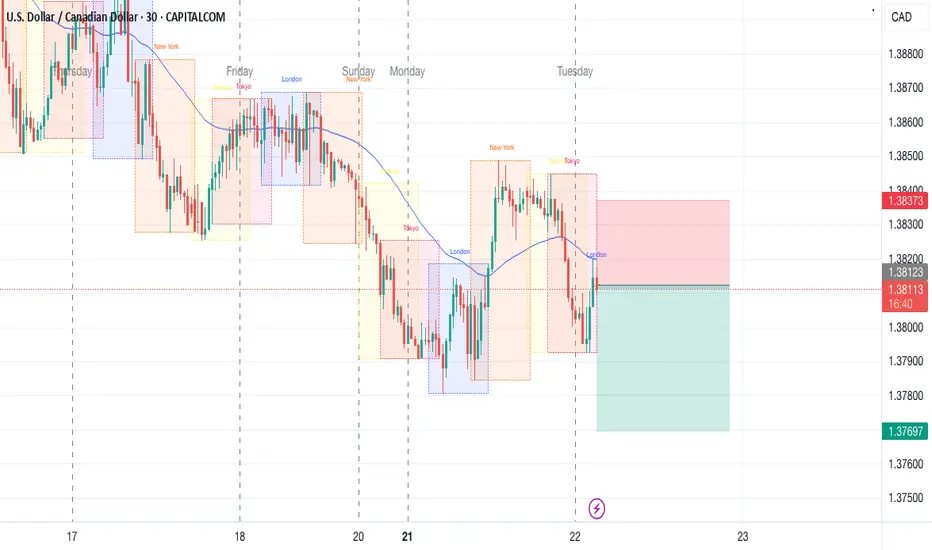
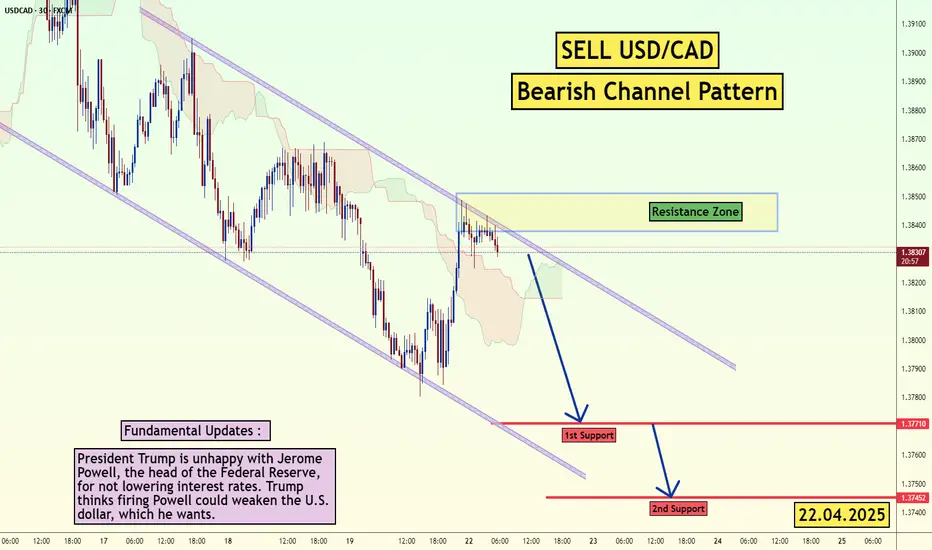
USD/CAD - Channel Pattern (22.04.2025)The USD/CAD Pair on the M30 timeframe presents a Potential Selling Opportunity due to a recent Formation of a Channel Pattern. This suggests a shift in momentum towards the downside in the coming hours.
Possible Short Trade:
Entry: Consider Entering A Short Position around Trendline Of The Pattern.
Target Levels:
1st Support – 1.3771
2nd Support – 1.3745
🎁 Please hit the like button and
🎁 Leave a comment to support for My Post !
Your likes and comments are incredibly motivating and will encourage me to share more analysis with you.
Best Regards, KABHI_TA_TRADING
Thank you.
USDCAD Will Explode! BUY!
My dear friends,
My technical analysis for USDCAD is below:
The market is trading on 1.3840 pivot level.
Bias - Bullish
Technical Indicators: Both Super Trend & Pivot HL indicate a highly probable Bullish continuation.
Target - 1.3958
About Used Indicators:
A pivot point is a technical analysis indicator, or calculations, used to determine the overall trend of the market over different time frames.
———————————
WISH YOU ALL LUCK
USDCAD Ready to Collapse? COT Signals a Bearish Storm!🔎 1. COT Context – Canadian Dollar (CAD)
Asset Managers: Consistently net short for most of the period, but since January 2025, there's been a strong recovery—net positions have become progressively less negative. By mid-April, they’re still short, but significantly less so.
Leveraged Money: Also heavily short in December 2024, but showing a clear bullish reversal starting in early 2025, with net positions turning increasingly positive on CAD.
✅ Interpretation: There's been a clear sentiment shift from bearish to bullish on CAD starting late 2024. This adds downward pressure on USDCAD.
💵 2. COT Context – US Dollar Index (USD)
Asset Managers: Consistently long, but reducing their net exposure since late March 2025.
Leveraged Money: Opposite of CAD – heavily short in December 2024, now recovering, though without strong momentum. Positions are hovering around neutral.
⚠️ Interpretation: While CAD grows stronger, USD shows signs of indecision or profit-taking. This amplifies the bearish bias on USDCAD.
📉 3. Technical Analysis – USDCAD
Current Price: 1.38369, right near a strong demand zone between 1.3700 – 1.3830, which has already been tested multiple times.
The current weekly candle is forming a doji or pin bar, hinting at a potential technical bounce.
Key Resistance: 1.45215 (monthly high).
Key Support: 1.3700. A breakdown below this could trigger a move toward 1.3480.
RSI: Neutral to slightly bearish, no major divergences observed.
🧠 Technical Outlook:
If the 1.3700–1.3830 zone holds, we might see a corrective bounce toward 1.4000–1.4100.
If that zone breaks, expect a bearish continuation toward 1.3580–1.3480.
📊 Trade Summary
Fundamental Bias (COT): Bearish USDCAD → Strong CAD, weakening USD.
Technical Bias: Neutral to bearish, potential for short-term bounce before continuation.
🧭 Trade Plan
🎯 Short on pullback toward 1.4000–1.4100 with stop above 1.4150, targeting 1.3600–1.3500.
🎯 Breakout trade below 1.3700 → Enter on daily close confirmation, target 1.3480.

USD/CAD SELL/SHORTBy utilizing levels, historical patterns, , we can formulate a hypothesis that the market might follow a similar trajectory if bearish sentiment prevails.
USDCAD sell Gold is moving up , USDCAD should go down, this is trade ill take , small one but nice risk reward ratio , so lets see what markerts have prepared for us today , as today is monday after holidays , can happen anything !
3 RRR
GL Traders
NOT ADVICE !!!
end of downtrendThe downtrend could end at the support level and also by hitting the support trend line.

USD/CAD 4h chartbuy on USD/CAD if the market break this reversal pattern
we have in daily tf a poi if the market just sweep the low of the poi will be a good setup
USDCAD RETRACEMENTI have my eyes on USDCAD for a comeback to sell lower to make lower lows, join me has we sell this trend together, remember you can never go wrong follow the overall trend.
