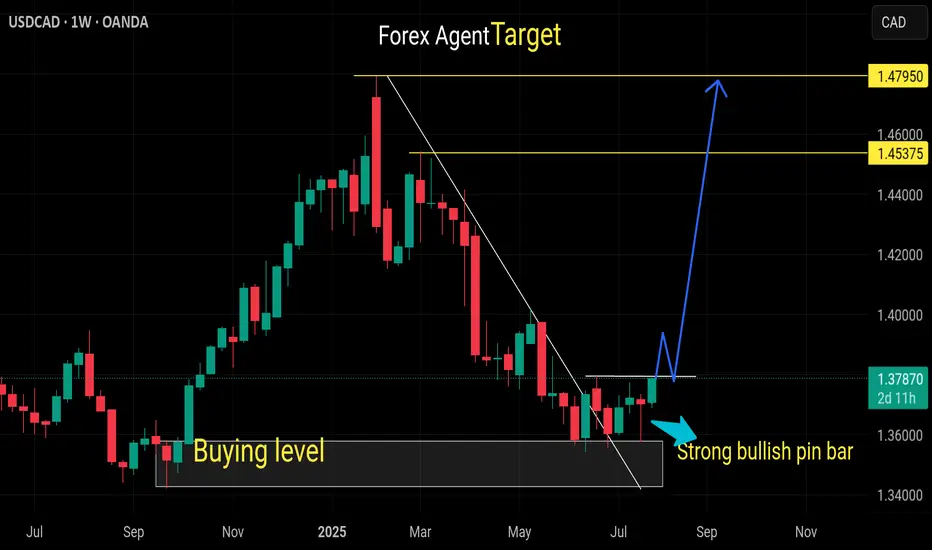
USDCAD Triple Bottom? Ready for long run?USDCAD formed a triple bottom on high time frame and is likely to Reach target of 1.4. the third bottom is also formed and is about finish soon the pattern. Enter the trade when the neck is broken or if the price come to 0.5 fib level from this bottom level.
USDCAD trade ideas

USDCAD resistance breakout at 1.3767The USDCAD remains in a bullish trend, with recent price action showing signs of a corrective pullback within the broader uptrend.
Support Zone: 1.3730 – a key level from previous consolidation. Price is currently testing or approaching this level.
A bullish rebound from 1.3730 would confirm ongoing upside momentum, with potential targets at:
1.3830 – initial resistance
1.3860 – psychological and structural level
1.3890 – extended resistance on the longer-term chart
Bearish Scenario:
A confirmed break and daily close below 1.3730 would weaken the bullish outlook and suggest deeper downside risk toward:
1.3716 – minor support
1.3690 – stronger support and potential demand zone
Outlook:
Bullish bias remains intact while the WTI Crude holds above 1.3730. A sustained break below this level could shift momentum to the downside in the short term.
This communication is for informational purposes only and should not be viewed as any form of recommendation as to a particular course of action or as investment advice. It is not intended as an offer or solicitation for the purchase or sale of any financial instrument or as an official confirmation of any transaction. Opinions, estimates and assumptions expressed herein are made as of the date of this communication and are subject to change without notice. This communication has been prepared based upon information, including market prices, data and other information, believed to be reliable; however, Trade Nation does not warrant its completeness or accuracy. All market prices and market data contained in or attached to this communication are indicative and subject to change without notice.

Buy usdcadOur last buying idea already running 100+ pips in buy
In my view usdcad ready to break this resistance
It can be today and next month candel
Weekly and monthly already oversold pair
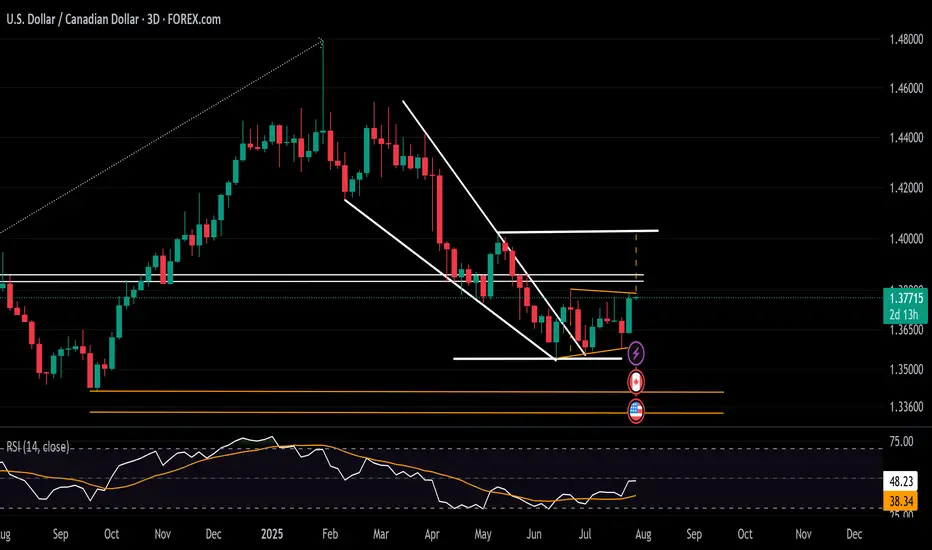
USDCAD Rebound Steadies Ahead of BOC and FOMC MeetingsAligned with the DXY holding above the 96 support and approaching the 100-resistance, the USDCAD is maintaining a rebound above the 1.3540 level.
It has maintained a hold beyond the boundaries of a contracting downtrend across 2025 and is aiming for the 1.38 resistance to confirm a steeper bullish breakout.
A sustained move above 1.38, which connects lower highs from June and July, while the RSI holds below the 50 neutral line, could extend gains toward the 1.40 level.
From the downside, should the breakout above 1.38 fail, the pair may remain trapped within the consolidation range extending from June, with initial support seen at 1.3580.
Written by Razan Hilal, CMT
USD/CAD LongLooking for a retest of 1.35600 zone for a bounce back up to 1.37650 supply zone
FX:USDCAD
Check the trend Given that there is a possibility of a triangle pattern forming, it is expected that the price will change direction at the current resistance level and a downtrend will begin. If the price consolidates above the green resistance level, the uptrend will likely continue.
USDCAD Bounce May Face Strong ResistanceUSDCAD is attempting to bounce back, supported by a stronger U.S. dollar index. The recent trade deals with Japan and the Eurozone have prompted traders to position more favorably toward the dollar. The sharp decline in EURUSD is also putting upward pressure on USDCAD.
This week will be crucial for both the U.S. and Canada, with a flood of economic data and major central bank events ahead. The Federal Reserve and the Bank of Canada are both expected to hold rates at tomorrow’s meetings. Although pressure from Trump is unlikely to sway FOMC members into a rate cut, the new trade deals do reduce policy uncertainty, which could increase the likelihood of a rate cut in September. Any minor hint of this scenario will likely be interpreted as dovish by the markets.
The Bank of Canada, in contrast, is expected to remain firmly dovish as tariffs continue to weigh heavily on growth. Meanwhile, Trump’s recent comments regarding Canadian tariffs are unlikely to boost economic confidence in Canada, although Carney is actively pushing for an improved trade agreement.
Aside from central bank meetings, both countries will release GDP data this week. Canada’s economy is expected to contract by 0.1% in May, with GDP figures arriving alongside employment change and the U.S. PCE report. A strong surprise from Canada could help limit the effect of the rising dollar index on USDCAD.
In the U.S., GDP, PCE, and payrolls data will make this one of the most unpredictable weeks for markets in recent months.
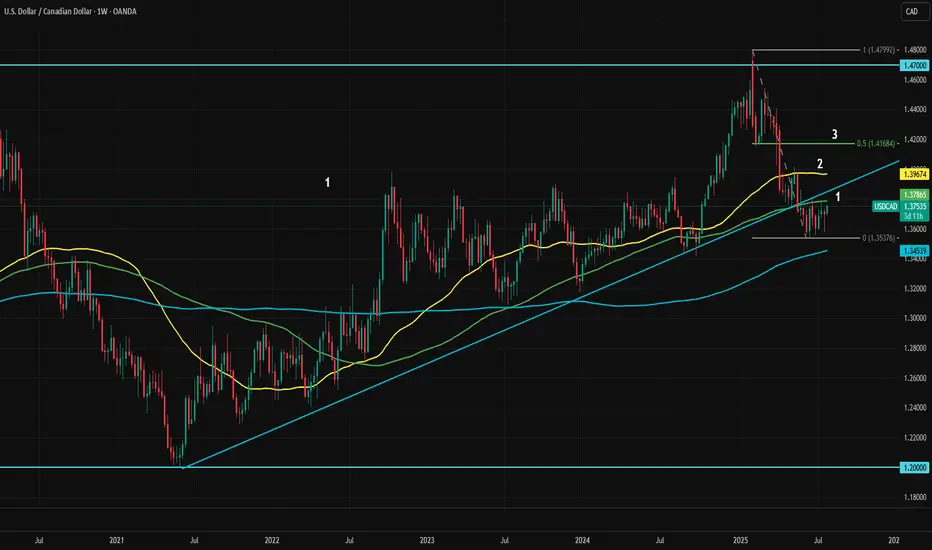
USDCAD is currently testing its 100-week moving average. The immediate resistance levels are 1.3786 and 1.3850, both marked as “1” in the chart as the first resistance area. If dollar index strength continues after the initial shock, the second resistance zone defined by the May top and the 50-week moving average will become the next target.
If dollar dominance persists in the medium term, the ultimate target would be 1.4170. This area is likely to act as strong resistance, as it includes the midpoint of the March to July pullback, the 23.6% Fibonacci retracement level of the 2021 to 2025 uptrend, and the February dip.
As long as this resistance holds, any upward moves can be considered potential selling opportunities. However, it remains uncertain which of the resistance levels will mark the top.
USDCAD – Bullish OutlookThe US Dollar continues to show strength against the Canadian Dollar. Price closed firmly at 1.3700, signaling strong bullish momentum and potential continuation.
📈 Trade Idea: Long USDCAD
🔹 Entry: 1.3700
🔹 Targets:
First Target: 1.3800
Second Target: 1.3900
Extended Target: 1.4000+
Strong USD fundamentals, coupled with technical strength on higher timeframes, support further upside in this pair. Watching for bullish follow-through and potential breakout above recent resistance.

USDCAD Wave Analysis – 25 July 2025
- USDCAD rising inside sideways price range inside
- Likely to reach resistance level 1.3800
USDCAD currency pair recently reversed from the key support level 1.3575 (which is the lower boundary of the sideways price range inside which the price has been trading from June).
The upward reversal from the support level 1.3575 created the daily Japanese candlesticks reversal pattern Morning Star.
USDCAD currency pair can be expected to rise to the next resistance level 1.3800 (upper border of this sideways price range, top of wave (2)).

Long USDCADUCAD has showed good candlestick formation, rejects on trendline. I am going to buy this, targeting to fibo 4.23.

usdcad swing trade long3 bull points
Rsi div
Trend reversal
Double bottom at 1D timeframe
RRR 1:2
hold for more longer but with proper risk management..
USDCAD, we can see a pullbackUSDCAD is in Range in Daily, and daily range is enough to capture 200-250 pips. So keeping that in mind we can plan a buy trade USDCAD from the Daily Demand Area 1.3500 - 1.3550 Area.
And 1H Trend is Bearish So we can also look for the Sell from the 1.3650 aka Resistance Zone (4H), but after this selling move it is risky to sell at current price i.e. 1.3580 So wait for fib area or look for buys only from Demand Zone.
USD/CAD(20250725)Today's AnalysisMarket news:
The European Central Bank announced that it would maintain the three key interest rates unchanged, reiterated data dependence, warned that the external environment is highly uncertain, and President Lagarde did not rule out the possibility of future rate hikes. Traders reduced their bets on ECB rate cuts.
Technical analysis:
Today's buying and selling boundaries:
1.3626
Support and resistance levels:
1.3689
1.3666
1.3651
1.3602
1.3587
1.3563
Trading strategy:
If the price breaks through 1.3651, consider buying, with the first target price of 1.3666
If the price breaks through 1.3626, consider selling, with the first target price of 1.3602
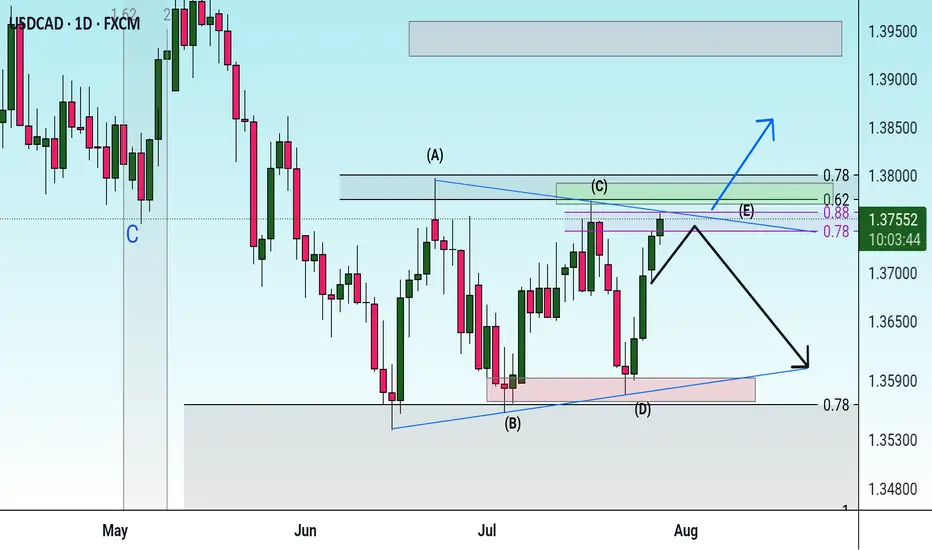
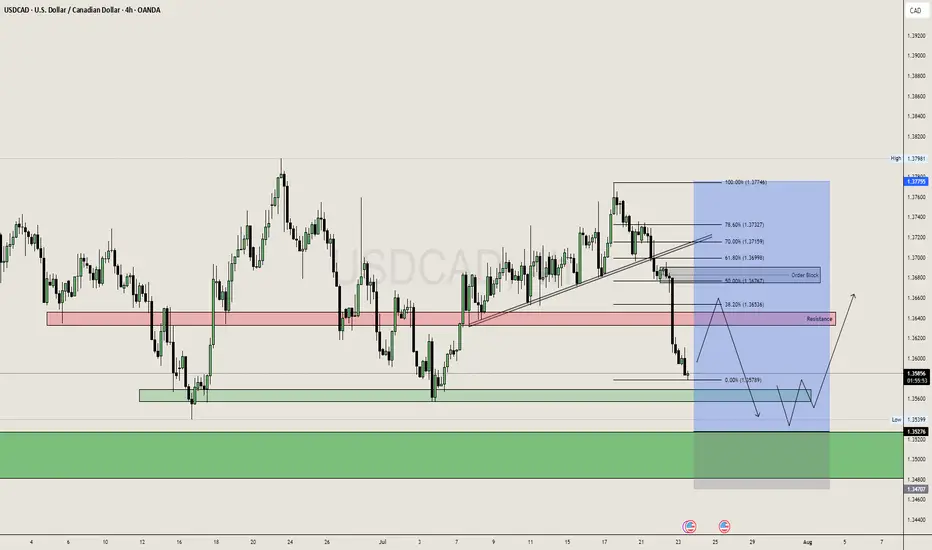
USDCAD...potential further upside expectedHey Hey TradingView fam! Hope you guys are doing absolutely amazing today...hope your trading weeks are off to an amazing start and hopefully this post can be helpful for the remainder of this week for you! Let's dive in!
OK so for USDCAD this is a post to piggyback off of the previous swing position post I did for USDCAD longs a couple weeks ago...those positions played out well and now wanted to revisit this currency pair because it is giving another potential opportunity to mover to the upside and so wanted to break down what I see here. Let's make it simple
1. Weekly demand zone
2. Strong momentum from buyers on Daily timeframe
3. Higher low formed WITH STRENGTH (big clue of interest)
4. Fib extension lining up with daily supply zone
5. Higher low forming would then now expect a new higher high to form
OK hope that made sense! I want to make these posts as simple as possible so hopefully this added some value for you guys!
Please boost and follow my page for more highly accurate setups! Cheers!

Is USDCAD staring at a new low for 2025?FX_IDC:USDCAD ready for a lower low? Let's see.
MARKETSCOM:USDCAD
Let us know what you think in the comments below.
Thank you.
75.2% of retail investor accounts lose money when trading CFDs with this provider. You should consider whether you understand how CFDs work and whether you can afford to take the high risk of losing your money. Past performance is not necessarily indicative of future results. The value of investments may fall as well as rise and the investor may not get back the amount initially invested. This content is not intended for nor applicable to residents of the UK. Cryptocurrency CFDs and spread bets are restricted in the UK for all retail clients.

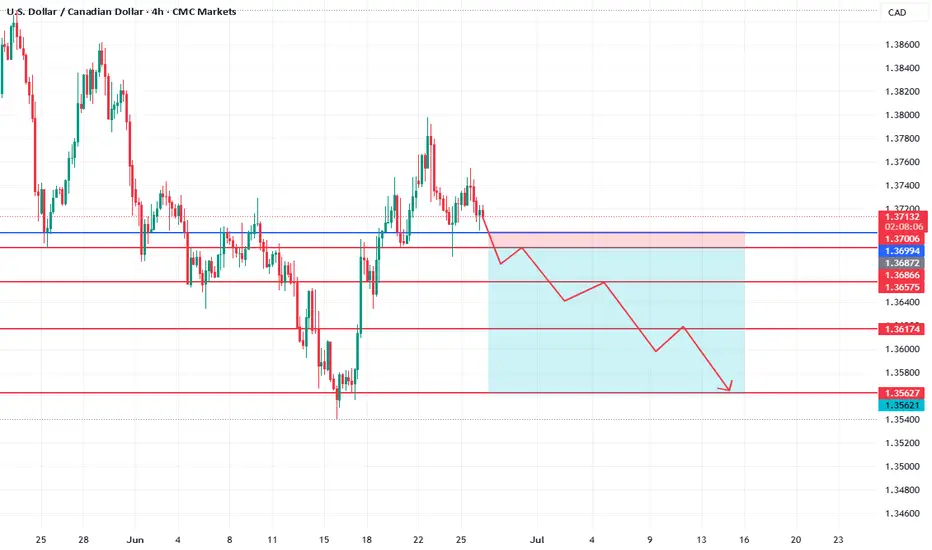
USDCAD Bearish Continuation Setup📉 USDCAD Bearish Continuation Setup
🗓 Published: June 26, 2025
🕒 Timeframes: 4H & 1D
📍 Instrument: USD/CAD
📊 Technical Bias: Bearish
🧠 Analysis Summary
USDCAD has recently rejected from the 1.3713–1.3700 resistance zone (highlighted in red/pink box) after a corrective bullish move. This area served as a strong supply zone where price was previously rejected.
The price is now forming a clear lower high, and the recent failure to break above 1.3713 confirms short-term bearish control. The structure on both the 4H and Daily charts supports a continuation move lower, aligning with a potential bearish swing leg developing.
📍 Key Levels
Level Description
1.3713 Major resistance (top of supply zone)
1.3700 Round number & resistance confirmation
1.3687 Minor S/R flip
1.3666 Short-term support
1.3657 Next target support
1.3617 Key swing low
1.3562 Final target (major support zone)
🔁 Trade Setup
Entry Zone:
🔴 Enter on a 15M/1H retracement to 1.3700–1.3713 (ideal R:R)
🔄 or market sell confirmation below 1.3686
Take Profit Targets:
✅ TP1: 1.3657
✅ TP2: 1.3617
✅ TP3: 1.3562
Stop Loss:
❌ SL above 1.3730
📦 Confluence Factors
Daily & 4H trend turning bearish
Bearish engulfing rejection at previous supply
Lower high structure building up
No major demand zone until 1.356x
⚠️ Risk Note
Wait for confirmation before entering, especially on lower timeframes (1H/15M), such as bearish engulfing candles or break–retest of 1.3686 level. Avoid trading if price breaks above 1.3730 – structure would be invalidated.
💬 Let me know in the comments how you’re trading USDCAD today, and don’t forget to set alerts at key zones!
📉 Good luck and manage risk wisely.
Rendon1

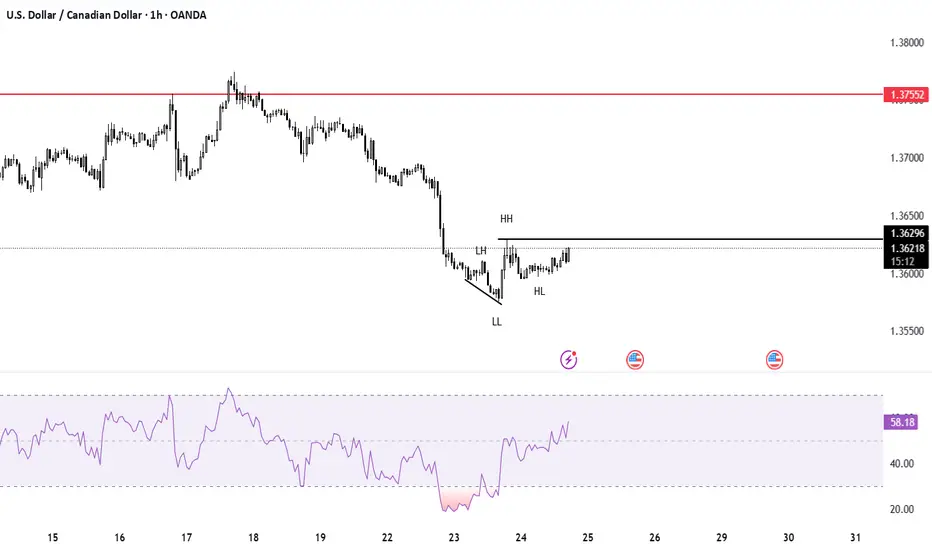
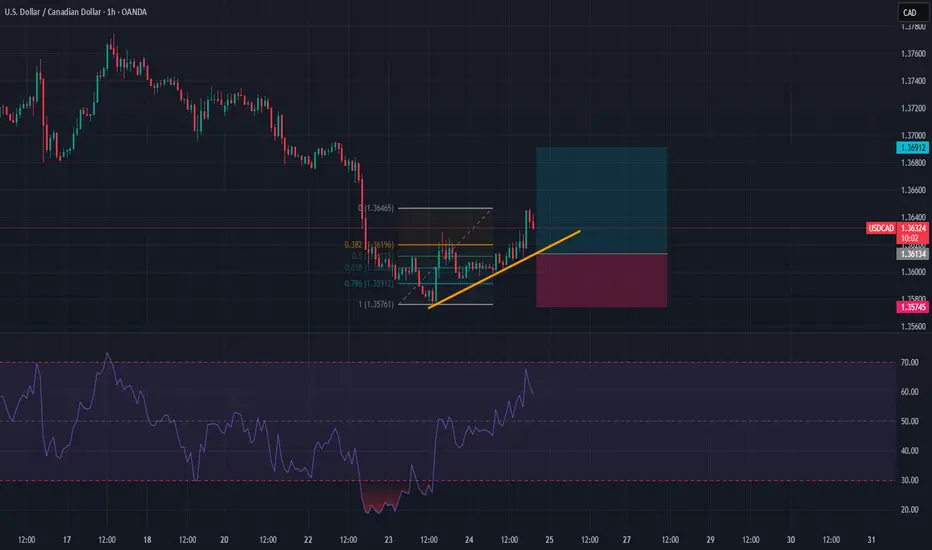
USDCAD 1H Short The US Dollar is generally exhibiting weakness.
The USDCAD pair maintains a bearish outlook based on a top-down analysis, from the daily timeframe (1D) down to the hourly (1H).
Two potential scenarios are unfolding:
The price may retrace to test the 0.382 Fibonacci level, potentially activating a sell limit order.
Alternatively, the pair could continue its downward movement and break the previous lower low (LL).


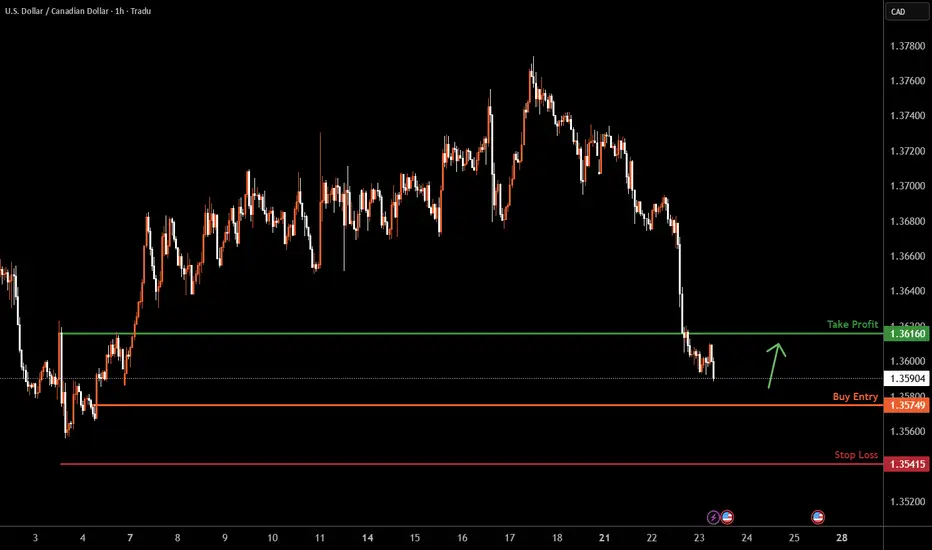
USDCAD H1 I Bullish Bounce Based on the H1 chart analysis, the price is approaching our buy entry level at 1.3574, a pullback support.
Our take profit is set at 1.3616, a pullback resistance.
The stop loss is placed at 1.3541, below swing low support.
High Risk Investment Warning
Trading Forex/CFDs on margin carries a high level of risk and may not be suitable for all investors. Leverage can work against you.
Stratos Markets Limited (tradu.com ):
CFDs are complex instruments and come with a high risk of losing money rapidly due to leverage. 66% of retail investor accounts lose money when trading CFDs with this provider. You should consider whether you understand how CFDs work and whether you can afford to take the high risk of losing your money.
Stratos Europe Ltd (tradu.com ):
CFDs are complex instruments and come with a high risk of losing money rapidly due to leverage. 66% of retail investor accounts lose money when trading CFDs with this provider. You should consider whether you understand how CFDs work and whether you can afford to take the high risk of losing your money.
Stratos Global LLC (tradu.com ):
Losses can exceed deposits.
Please be advised that the information presented on TradingView is provided to Tradu (‘Company’, ‘we’) by a third-party provider (‘TFA Global Pte Ltd’). Please be reminded that you are solely responsible for the trading decisions on your account. There is a very high degree of risk involved in trading. Any information and/or content is intended entirely for research, educational and informational purposes only and does not constitute investment or consultation advice or investment strategy. The information is not tailored to the investment needs of any specific person and therefore does not involve a consideration of any of the investment objectives, financial situation or needs of any viewer that may receive it. Kindly also note that past performance is not a reliable indicator of future results. Actual results may differ materially from those anticipated in forward-looking or past performance statements. We assume no liability as to the accuracy or completeness of any of the information and/or content provided herein and the Company cannot be held responsible for any omission, mistake nor for any loss or damage including without limitation to any loss of profit which may arise from reliance on any information supplied by TFA Global Pte Ltd.
The speaker(s) is neither an employee, agent nor representative of Tradu and is therefore acting independently. The opinions given are their own, constitute general market commentary, and do not constitute the opinion or advice of Tradu or any form of personal or investment advice. Tradu neither endorses nor guarantees offerings of third-party speakers, nor is Tradu responsible for the content, veracity or opinions of third-party speakers, presenters or participants.
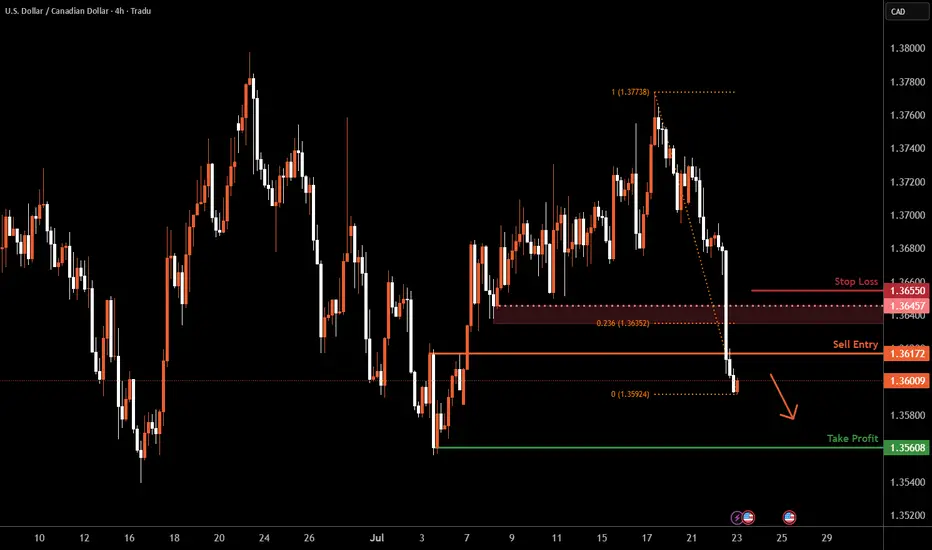
USD/CAD H4 | Potential bearish reversalUSD/CAD is rising towards a pullback resistance and could potentially reverse off this level to drop lower.
Sell entry is at 1.3617 which is a pullback resistance.
Stop loss is at 1.3655 which is a level that sits above the 23.6% Fibonacci retracement and a pullback resistance.
Take profit is at 1.3560 which is a swing-low support.
High Risk Investment Warning
Trading Forex/CFDs on margin carries a high level of risk and may not be suitable for all investors. Leverage can work against you.
Stratos Markets Limited (tradu.com ):
CFDs are complex instruments and come with a high risk of losing money rapidly due to leverage. 66% of retail investor accounts lose money when trading CFDs with this provider. You should consider whether you understand how CFDs work and whether you can afford to take the high risk of losing your money.
Stratos Europe Ltd (tradu.com ):
CFDs are complex instruments and come with a high risk of losing money rapidly due to leverage. 66% of retail investor accounts lose money when trading CFDs with this provider. You should consider whether you understand how CFDs work and whether you can afford to take the high risk of losing your money.
Stratos Global LLC (tradu.com ):
Losses can exceed deposits.
Please be advised that the information presented on TradingView is provided to Tradu (‘Company’, ‘we’) by a third-party provider (‘TFA Global Pte Ltd’). Please be reminded that you are solely responsible for the trading decisions on your account. There is a very high degree of risk involved in trading. Any information and/or content is intended entirely for research, educational and informational purposes only and does not constitute investment or consultation advice or investment strategy. The information is not tailored to the investment needs of any specific person and therefore does not involve a consideration of any of the investment objectives, financial situation or needs of any viewer that may receive it. Kindly also note that past performance is not a reliable indicator of future results. Actual results may differ materially from those anticipated in forward-looking or past performance statements. We assume no liability as to the accuracy or completeness of any of the information and/or content provided herein and the Company cannot be held responsible for any omission, mistake nor for any loss or damage including without limitation to any loss of profit which may arise from reliance on any information supplied by TFA Global Pte Ltd.
The speaker(s) is neither an employee, agent nor representative of Tradu and is therefore acting independently. The opinions given are their own, constitute general market commentary, and do not constitute the opinion or advice of Tradu or any form of personal or investment advice. Tradu neither endorses nor guarantees offerings of third-party speakers, nor is Tradu responsible for the content, veracity or opinions of third-party speakers, presenters or participants.
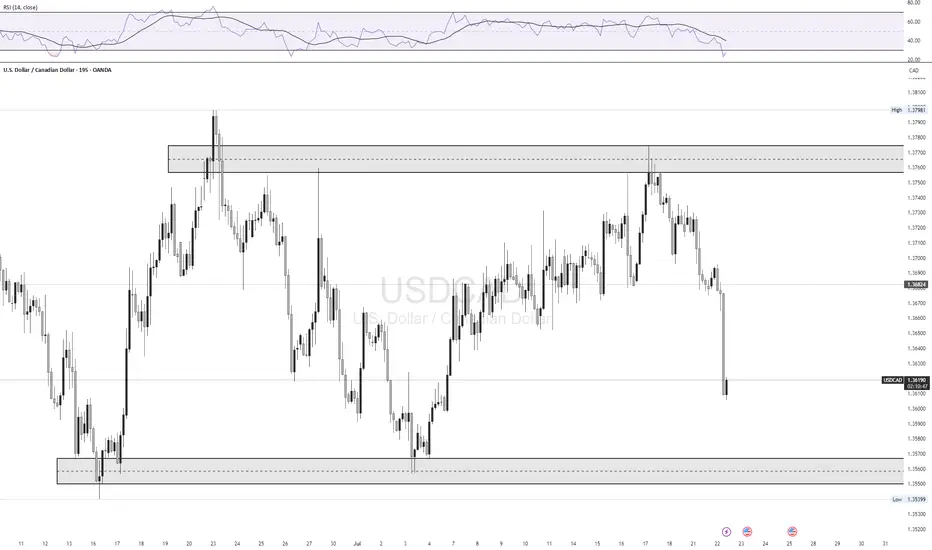
🇨🇦 USDCAD — July 22nd OutlookCurrent Price Behaviour:
USDCAD remains rangebound, sitting just above our key support level of 1.36647. The pair has failed to show any clean breakouts since Monday and remains stuck inside a tight intraday channel.
What We're Watching:
📍 Break of 1.36647 = trigger for continuation of bearish move
🎯 Target: 1.35822 (80 pip move)
⚠️ No active trade until this breaks — structure still unclear
HTF Bias: Bearish
Current Play: Stay out until 1.36647 breaks cleanly with strong momentum and volume. That level unlocks a smoother sell opportunity into our first target.
