USDCAD trade ideas

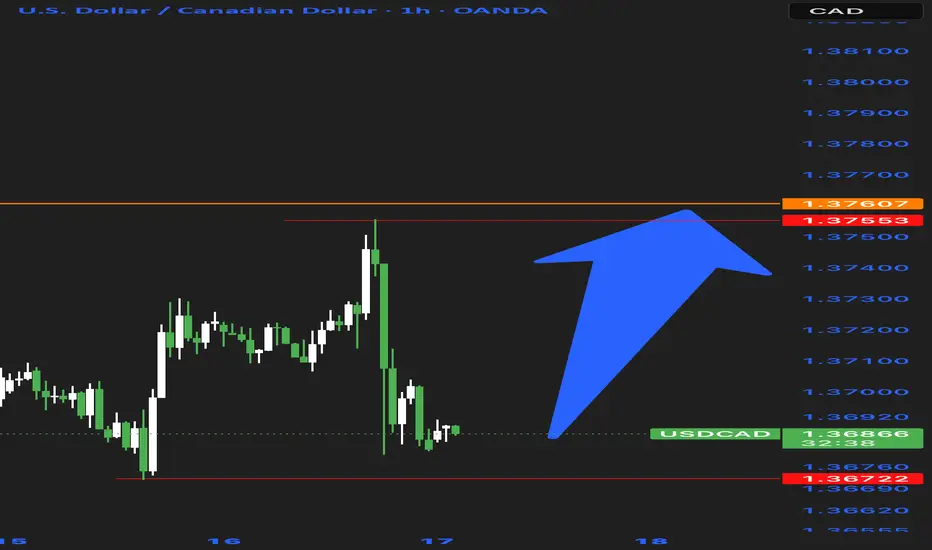
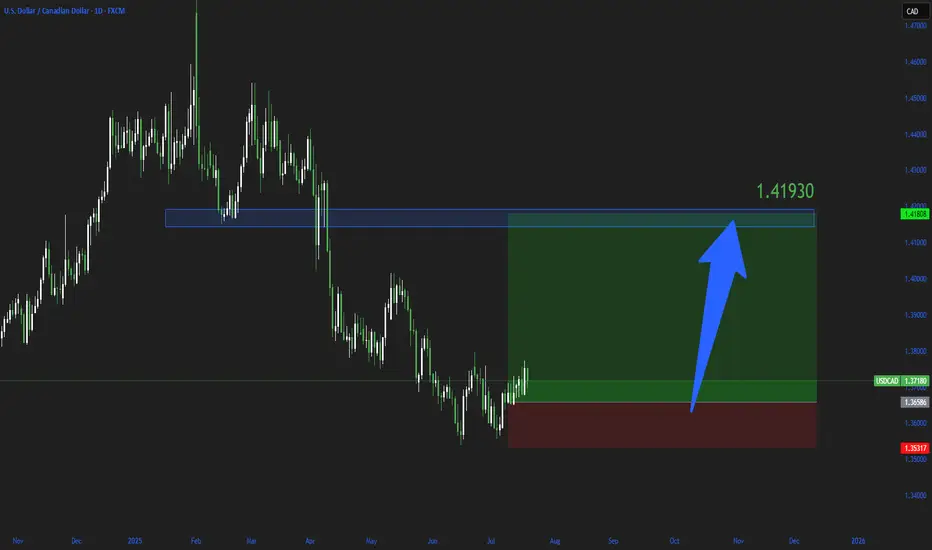
“USD/CAD Rocket Launch: The Bullish Surge Is Here!”The bullish path for USD/CAD on the daily timeframe is ready to begin.
And without a doubt — no, with a million percent certainty — the price will touch 1.41930.
In lower timeframes, feel free to dance with the trend 🙂
Good luck! 🙌
USDCAD bearish view
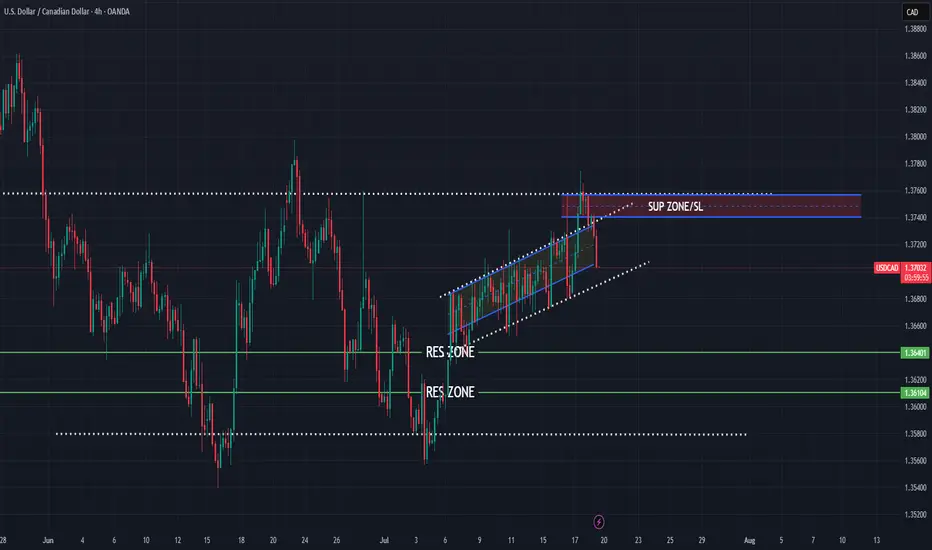
OANDA:USDCAD again on this pair, first analysis accurate, in new look having bearish view, price in PA moving, still we having nice structure, price is now come back in channel, looks like breaking first channel, which will take for confirmation and sign for bearish expectations.
SUP zone: 1.37400
RES zone: 1.36400, 1.36100
USDCAD BULLESH DAILY BISIUSDCAD BULLESH DAILY BISI
In daily TF market is bullesh market will creat trend line liquidity market first market will Run On Stop then tap daily BISI , going to LTF then valid mss with valid valid obi entry on this obi tight sl with 100 - 500 pips target holding over night , THANK YOU
KGB Priyabrat Behera
ICT TRADER & Advance mapping SMC trader

USDCAD / U.S. Dollar – Canadian Dollar (4H) – ABC Bearish PatterUSDCAD / U.S. Dollar – Canadian Dollar (4H) – ABC Bearish Pattern Completion at PCZ
Pattern Overview:
Pattern Type: ABC Bearish (Potential Reversal)
Asset: USDCAD
Timeframe: 4H
Trade Type: Short Bias – Rejection observed near PCZ zone
🔎 Key Levels
XA: 1.37880 → 1.35574
AB: 1.35574 → 1.37742
BC: Completed right into the PCZ, aligning with 127.2% and 161.8% projection zones
Rejection confirmed below 1.3774, entering pullback
📐 Fibonacci Extensions & Key Ratios
127.2% Projection: 1.37368
161.8% Extension: 1.37855
Retracement Target Zone (PCZ/Support):
50.0% = 1.36842
61.8% = 1.36629
💡 Price Action & Setup
The price has completed a textbook ABC structure into a confluence projection zone (PCZ), showing signs of exhaustion at 1.3774. This area aligns with a previous swing high and fib confluence, now acting as resistance.
The first leg of the pullback is underway, and momentum is favoring a deeper move toward the 1.3680 – 1.3660 PCZ, which aligns with key fibs and 200 SMA support.
🧠 Market Sentiment
DXY consolidating near highs – potential exhaustion
Crude oil stabilizing supports CAD
CAD correlation is enhancing bearish weight on this pair post-ABC
📊 Next Potential Movement
Targeting the 1.3680–1.3660 support cluster
If PCZ fails to hold on any retest → potential continuation down toward 1.3600 swing
Resistance to watch: 1.3737–1.3750 (any candle close above this weakens setup)
🛡 Risk Management
Short entries from the 1.3760–1.3770 area are valid
Stop-loss ideally above 1.3790 (beyond 161.8%)
Scaling out near 1.3680 and 1.3660, both technical targets and 200 SMA confluence
📌 Conclusion
Price completed a high-probability ABC Bearish structure and is now reacting from a strong confluence zone. While confirmation is still unfolding, momentum favors downside, and all eyes are on the next leg toward the PCZ support range.
“Bearish patterns are warnings, not guarantees. But confluence zones give them authority.”

USDCAD bearish structureprice action, you gotta love structure thou. 🧭 Current Sentiment
Bias: Neutral to Bearish (subject to change based on upcoming U.S. data and oil prices)
Market Context: Consolidating in a tight range after recent USD weakness & steady CAD support from oil prices.
USDCAD SELLUSD/CAD retakes 1.3700, eyes multi-week top amid a broadly firmer USD
The USD/CAD pair attracts some dip-buying during the Asian session on Thursday and climbs further beyond the 1.3700 mark amid a broadly firmer US Dollar. Spot prices have now reversed the previous day's retracement slide from a three-week high and seem poised to appreciate further
The year will be politically marked by Trump’s return to the White House. A Republican government is seen as positive for financial markets, but Trump’s pledge to cut taxes and impose tariffs on foreign goods and services may introduce uncertainty to both the political and economic landscape.
Canada’s political crisis peaked in late 2024 with a no-confidence vote against Prime Minister Justin Trudeau, leading to snap elections and a weakened Liberal minority government. Policy uncertainty and economic challenges dominate 2025’s outlook, raising concerns over market stability and investor confidence.
The BoC is set to continue easing interest rates through 2025, at least at a faster pace than the Fed is expected to, which could apply pressure on CAD’s already-rising rate differentia
TP 1 1.37214
TP 2 1.37095
TP 3 1.36987
RESISTANCE 1.37413

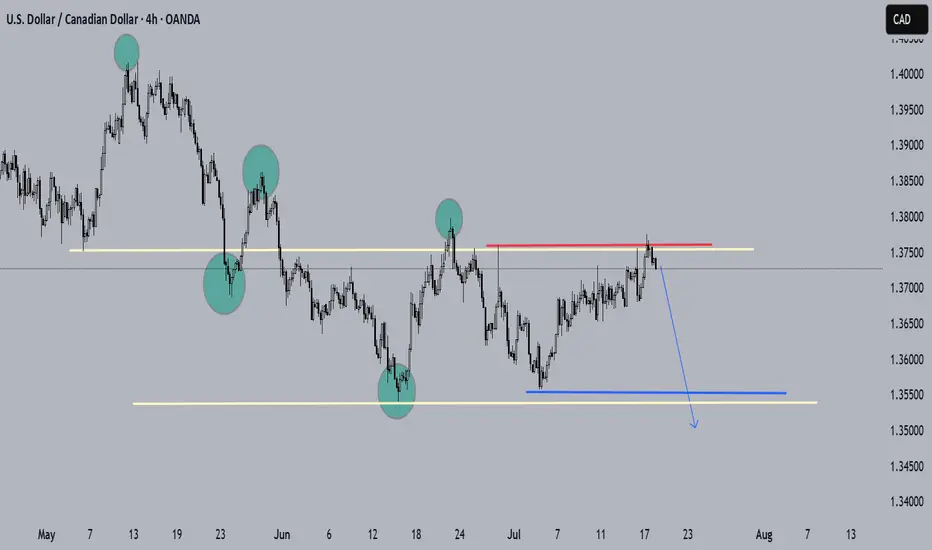
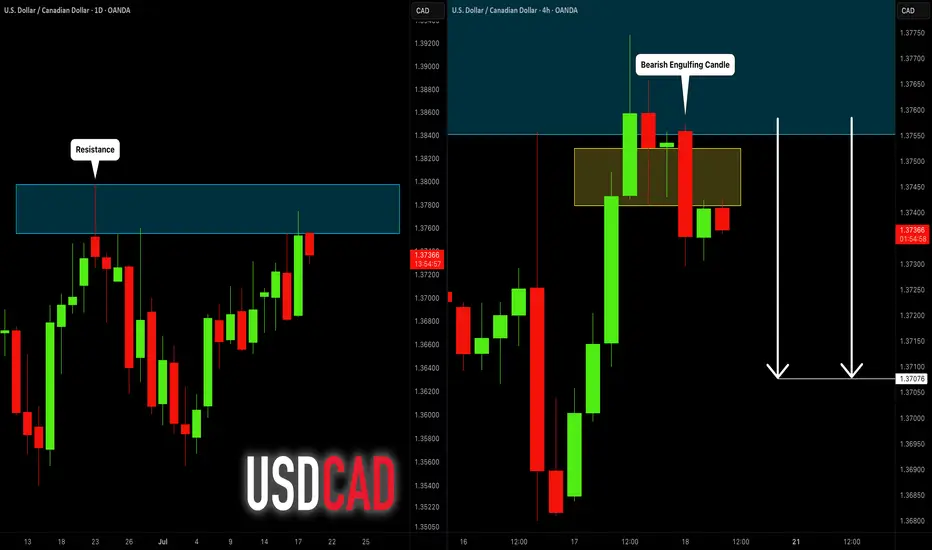
USDCAD: Bearish Move From Resistance 🇺🇸🇨🇦
USDCAD is going to retrace from a key daily resistance.
A bearish imbalance candle that the price formed after its test
during the Asian session provides a strong intraday bearish confirmation.
Goal - 1.3707
❤️Please, support my work with like, thank you!❤️
I am part of Trade Nation's Influencer program and receive a monthly fee for using their TradingView charts in my analysis.
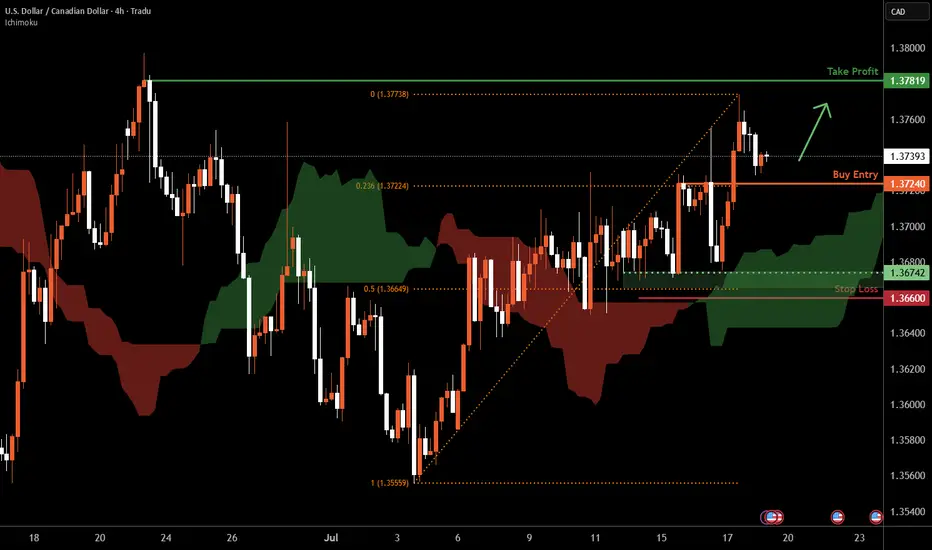
USD/CAD H4 | Potential bullish bounceUSD/CAD is falling towards a pullback support and could potentially bounce off this level to climb higher.
Buy entry is at 1.3724 which is a pullback support that aligns with the 23.6% Fibonacci retracement.
Stop loss is at 1.3660 which is a level that lies underneath a multi-swing-low support and the 50% Fibonacci retracement.
Take profit is at 1.3781 which is a swing-high resistance.
High Risk Investment Warning
Trading Forex/CFDs on margin carries a high level of risk and may not be suitable for all investors. Leverage can work against you.
Stratos Markets Limited (tradu.com ):
CFDs are complex instruments and come with a high risk of losing money rapidly due to leverage. 66% of retail investor accounts lose money when trading CFDs with this provider. You should consider whether you understand how CFDs work and whether you can afford to take the high risk of losing your money.
Stratos Europe Ltd (tradu.com ):
CFDs are complex instruments and come with a high risk of losing money rapidly due to leverage. 66% of retail investor accounts lose money when trading CFDs with this provider. You should consider whether you understand how CFDs work and whether you can afford to take the high risk of losing your money.
Stratos Global LLC (tradu.com ):
Losses can exceed deposits.
Please be advised that the information presented on TradingView is provided to Tradu (‘Company’, ‘we’) by a third-party provider (‘TFA Global Pte Ltd’). Please be reminded that you are solely responsible for the trading decisions on your account. There is a very high degree of risk involved in trading. Any information and/or content is intended entirely for research, educational and informational purposes only and does not constitute investment or consultation advice or investment strategy. The information is not tailored to the investment needs of any specific person and therefore does not involve a consideration of any of the investment objectives, financial situation or needs of any viewer that may receive it. Kindly also note that past performance is not a reliable indicator of future results. Actual results may differ materially from those anticipated in forward-looking or past performance statements. We assume no liability as to the accuracy or completeness of any of the information and/or content provided herein and the Company cannot be held responsible for any omission, mistake nor for any loss or damage including without limitation to any loss of profit which may arise from reliance on any information supplied by TFA Global Pte Ltd.
The speaker(s) is neither an employee, agent nor representative of Tradu and is therefore acting independently. The opinions given are their own, constitute general market commentary, and do not constitute the opinion or advice of Tradu or any form of personal or investment advice. Tradu neither endorses nor guarantees offerings of third-party speakers, nor is Tradu responsible for the content, veracity or opinions of third-party speakers, presenters or participants.
USD/CAD(20250718)Today's AnalysisMarket news:
① Kugler: It is appropriate to keep the interest rate policy stable for "a while".
② Daly: Whether to cut interest rates in July or September is not the most critical.
③ Bostic: It may be difficult to cut interest rates in the short term.
Technical analysis:
Today's buying and selling boundaries:
1.3735
Support and resistance levels:
1.3827
1.3792
1.3770
1.3700
1.3678
1.3644
Trading strategy:
If it breaks through 1.3770, consider buying in, the first target price is 1.3792
If it breaks through 1.3735, consider selling in, the first target price is 1.3700

USDCAD is showing signs of bullish recovery✏️ OANDA:USDCAD has broken the Trendline structure to form a corrective uptrend. The price is still above the 20 SMA, indicating that the market's bullish momentum is still strong. The bullish wave may extend to 1.385. Pay attention to the reaction at the 1.375 liquidity candle wick zone for a positive DCA strategy.
📉 Key Levels
Support: 1.365
Resistance: 1.375-1.385
BUY Now: 1.365 (Strong support zone)
BUY Trigger: break and close above 1.375
Target: 1.385
Leave your comments on the idea. I am happy to read your views.

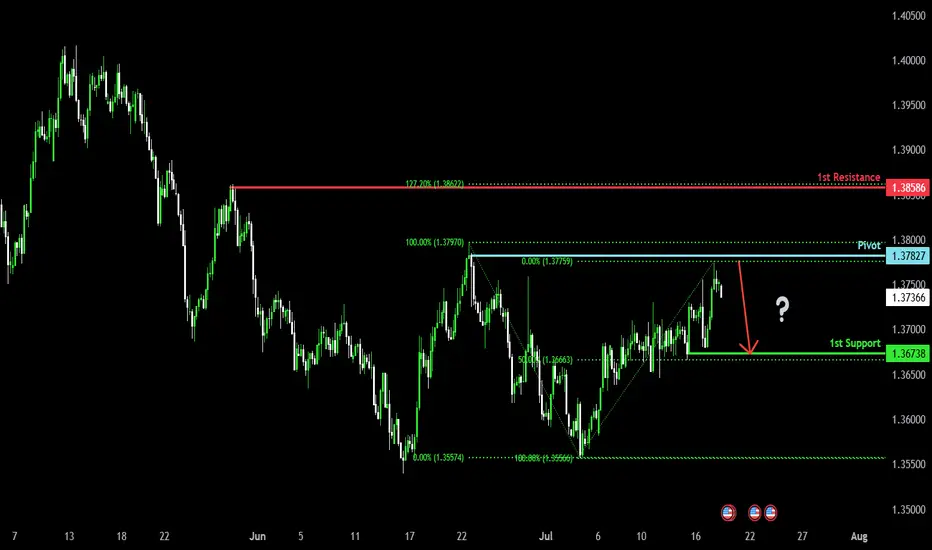
Heading into pullback resistance?The Loonie (USD/CAD) has rejected off the pivot which acts as a pullback resistance and could reverse to the pullback support that aligns with the 50% Fibonacci retracement.
Pivot: 1.3782
1st Support: 1.3673
1st Resistance: 1.3858
Risk Warning:
Trading Forex and CFDs carries a high level of risk to your capital and you should only trade with money you can afford to lose. Trading Forex and CFDs may not be suitable for all investors, so please ensure that you fully understand the risks involved and seek independent advice if necessary.
Disclaimer:
The above opinions given constitute general market commentary, and do not constitute the opinion or advice of IC Markets or any form of personal or investment advice.
Any opinions, news, research, analyses, prices, other information, or links to third-party sites contained on this website are provided on an "as-is" basis, are intended only to be informative, is not an advice nor a recommendation, nor research, or a record of our trading prices, or an offer of, or solicitation for a transaction in any financial instrument and thus should not be treated as such. The information provided does not involve any specific investment objectives, financial situation and needs of any specific person who may receive it. Please be aware, that past performance is not a reliable indicator of future performance and/or results. Past Performance or Forward-looking scenarios based upon the reasonable beliefs of the third-party provider are not a guarantee of future performance. Actual results may differ materially from those anticipated in forward-looking or past performance statements. IC Markets makes no representation or warranty and assumes no liability as to the accuracy or completeness of the information provided, nor any loss arising from any investment based on a recommendation, forecast or any information supplied by any third-party.
USD_CAD LOCAL SHORT|
✅USD_CAD is going up now
But a strong resistance level is ahead at 1.3800
Thus I am expecting a pullback
And a move down towards the target of 1.3720
SHORT🔥
✅Like and subscribe to never miss a new idea!✅
Disclosure: I am part of Trade Nation's Influencer program and receive a monthly fee for using their TradingView charts in my analysis.
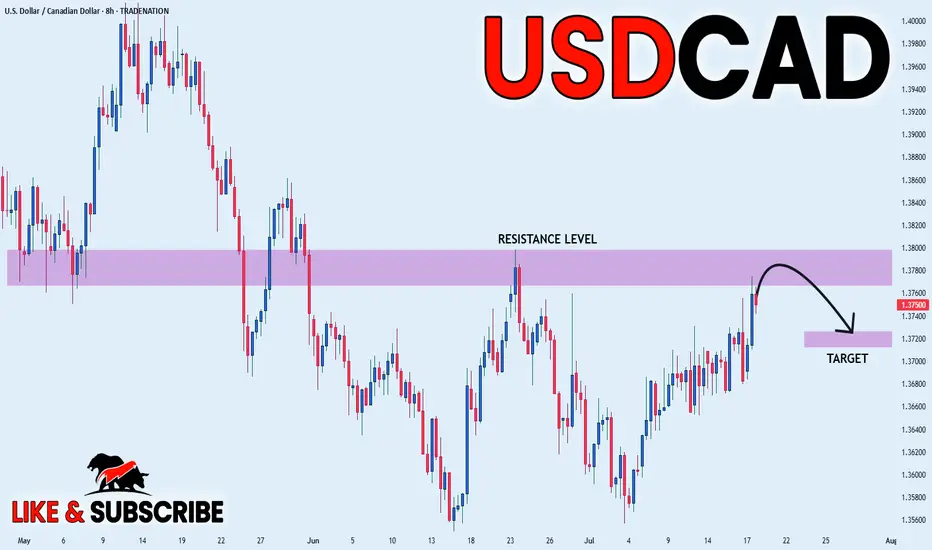
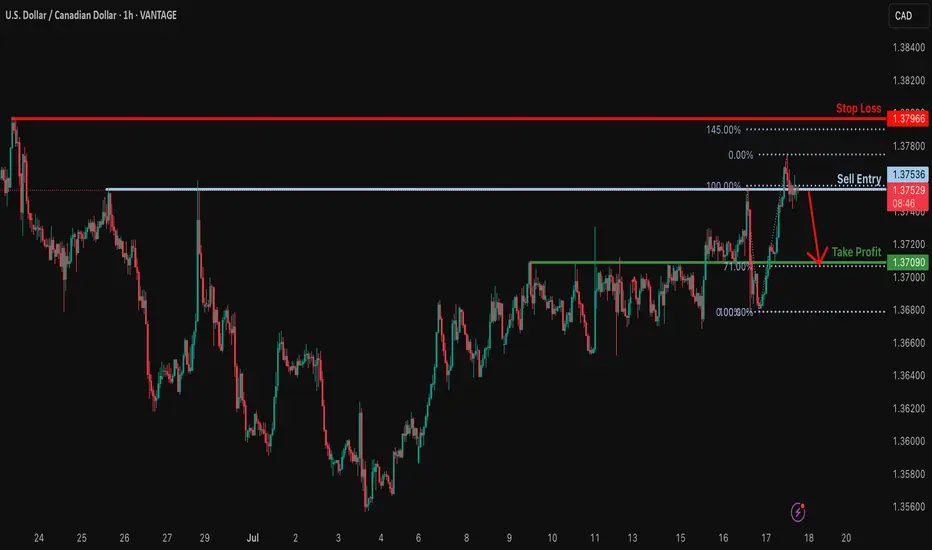
Bearish drop off pullback resistance?USD/CAD is reacting off the resistance level which is a pullback resistance and could reverse from this level to our take profit.
Entry: 1.3753
Why we like it:
There is a pullback resistance.
Stop loss: 1.3796
Why we like it:
There is a swing high resistance that is slightly above the 145% Fibonacci extension.
Take profit: 1.3709
Why we lik eit:
There is an overlap support that lines up with the 71% Fibonacci retracement.
Enjoying your TradingView experience? Review us!
Please be advised that the information presented on TradingView is provided to Vantage (‘Vantage Global Limited’, ‘we’) by a third-party provider (‘Everest Fortune Group’). Please be reminded that you are solely responsible for the trading decisions on your account. There is a very high degree of risk involved in trading. Any information and/or content is intended entirely for research, educational and informational purposes only and does not constitute investment or consultation advice or investment strategy. The information is not tailored to the investment needs of any specific person and therefore does not involve a consideration of any of the investment objectives, financial situation or needs of any viewer that may receive it. Kindly also note that past performance is not a reliable indicator of future results. Actual results may differ materially from those anticipated in forward-looking or past performance statements. We assume no liability as to the accuracy or completeness of any of the information and/or content provided herein and the Company cannot be held responsible for any omission, mistake nor for any loss or damage including without limitation to any loss of profit which may arise from reliance on any information supplied by Everest Fortune Group.
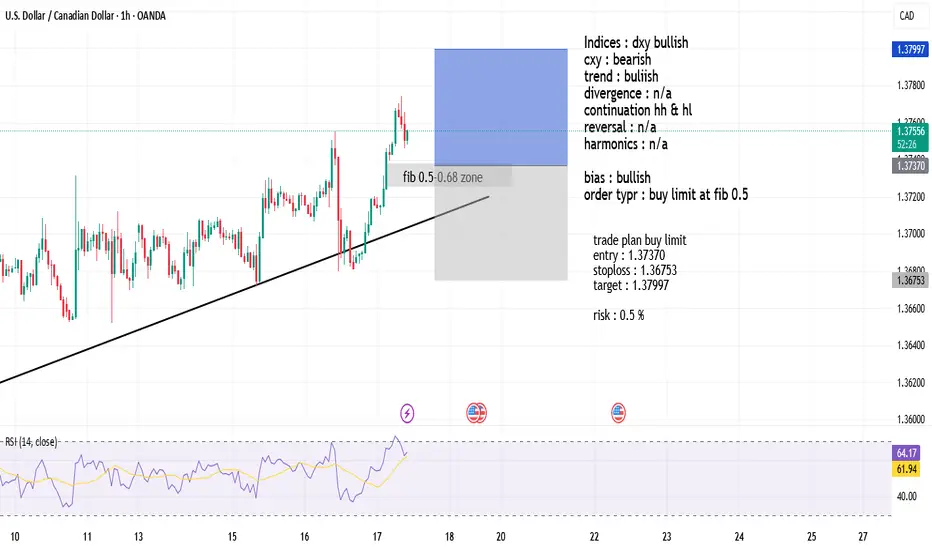
AUDCAD LONG 17-7-2025Indices : dxy bullish
cxy : bearish
trend : buliish
divergence : n/a
continuation hh & hl
reversal : n/a
harmonics : n/a
bias : bullish
order typr : buy limit at fib 0.5
Buy entry on USDCADPrice formed a double bottom, coincidently rejecting the upper trendline in higher time frame. Anticipate the long and TP at 1:1 DB formation.
usdcad Buy1. Trendline Breakout
The yellow descending trendline has multiple confirmed touchpoints (marked with yellow circles), showing it was a respected resistance.
Break and close above the trendline indicates a potential end to the downtrend, signaling a trend reversal to the upside.

USDCAD is breaking the trendline againOnce again, FX_IDC:USDCAD is breaking its medium-term downside resistance line, drawn from the current highest point of this year. If the rate remains above it, we may see a few more bulls stepping in. Let's take a look.
MARKETSCOM:USDCAD
Let us know what you think in the comments below.
Thank you.
75.2% of retail investor accounts lose money when trading CFDs with this provider. You should consider whether you understand how CFDs work and whether you can afford to take the high risk of losing your money. Past performance is not necessarily indicative of future results. The value of investments may fall as well as rise and the investor may not get back the amount initially invested. This content is not intended for nor applicable to residents of the UK. Cryptocurrency CFDs and spread bets are restricted in the UK for all retail clients.

USDCAD BUYThe Bullish BAT pattern on the USD/CAD daily chart is structurally valid based on strict harmonic criteria. Although point D is slightly extended (91% vs. 88.6%), the confluence of Fibonacci levels and price reaction justifies a potential buying opportunity with favorable risk-reward.

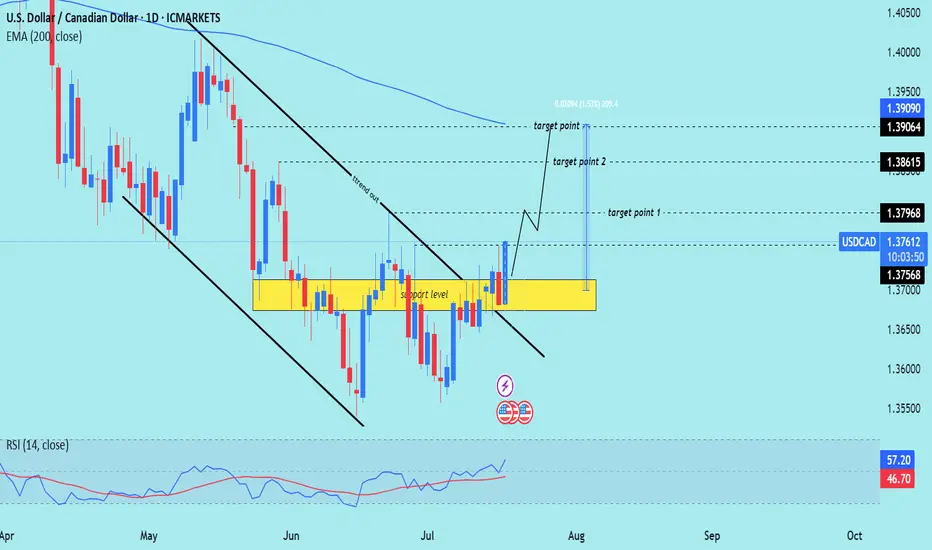
USD/CAD) strong bullish trend Read The captionSMC trading point update
Technical analysis of USD/CAD (U.S. Dollar vs Canadian Dollar) on the daily timeframe. Here's a breakdown of the trade
---
Technical Breakdown:
1. Breakout from Descending Channel:
Price has broken out above a descending trend channel (marked with black lines).
This breakout suggests a potential trend reversal or at least a bullish correction phase.
2. Key Support Zone (Yellow Box):
The yellow zone marked as “support level” was a strong consolidation area.
Price has bounced off this zone multiple times, forming a solid base for further upside.
3. Bullish Price Action:
Price has closed above the previous resistance (now support), signaling bullish intent.
Current candle structure confirms strength with bullish continuation patterns.
4. RSI Indicator:
RSI is at 56.38, indicating bullish momentum without being overbought.
Suggests there is room for further upside before exhaustion.
---
Target Levels:
Target Point 1: 1.37968 (near-term resistance)
Target Point 2: 1.38615 (intermediate target)
Target Point 3: 1.39064–1.39090 (longer-term resistance near the 200 EMA)
Mr SMC Trading point
---
Trade Idea Summary:
Bias: Bullish
Entry Zone: Break and retest of the yellow support area (~1.368–1.371)
Target Zone: 1.379 – 1.390
Invalidation: Break below the yellow support zone
Confluence: RSI strength + breakout of downtrend channel + structural support
plesse support boost 🚀 this analysis)
SHORT USDCADyou can find your sell entry now cus its already at the poi reacting always remember lower tf mss still the best to me


USD/CAD is ready for takeoff.A highly strong trend is underway.
Based on market structure, USD/CAD is moving toward the 50% level of the daily bearish leg, and any resistance in its path is likely to be crushed.