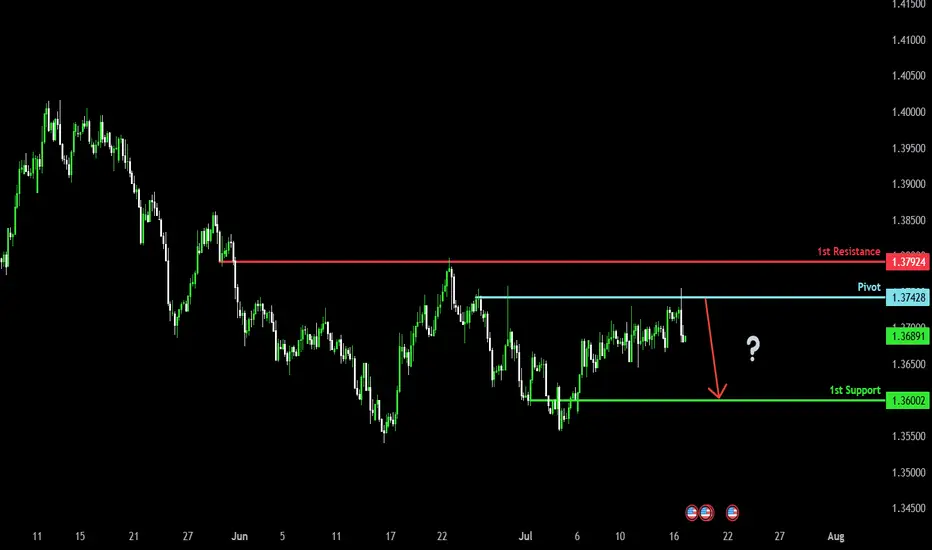
Bearish drop?The Loonie (USD/CAD) has rejected off the pivot which acts as a pullback resistance, and could drop to the 1st support.
Pivot: 1.3742
1st Support: 1.3600
1st Resistance: 1.3792
Risk Warning:
Trading Forex and CFDs carries a high level of risk to your capital and you should only trade with money you can afford to lose. Trading Forex and CFDs may not be suitable for all investors, so please ensure that you fully understand the risks involved and seek independent advice if necessary.
Disclaimer:
The above opinions given constitute general market commentary, and do not constitute the opinion or advice of IC Markets or any form of personal or investment advice.
Any opinions, news, research, analyses, prices, other information, or links to third-party sites contained on this website are provided on an "as-is" basis, are intended only to be informative, is not an advice nor a recommendation, nor research, or a record of our trading prices, or an offer of, or solicitation for a transaction in any financial instrument and thus should not be treated as such. The information provided does not involve any specific investment objectives, financial situation and needs of any specific person who may receive it. Please be aware, that past performance is not a reliable indicator of future performance and/or results. Past Performance or Forward-looking scenarios based upon the reasonable beliefs of the third-party provider are not a guarantee of future performance. Actual results may differ materially from those anticipated in forward-looking or past performance statements. IC Markets makes no representation or warranty and assumes no liability as to the accuracy or completeness of the information provided, nor any loss arising from any investment based on a recommendation, forecast or any information supplied by any third-party.
USDCAD trade ideas
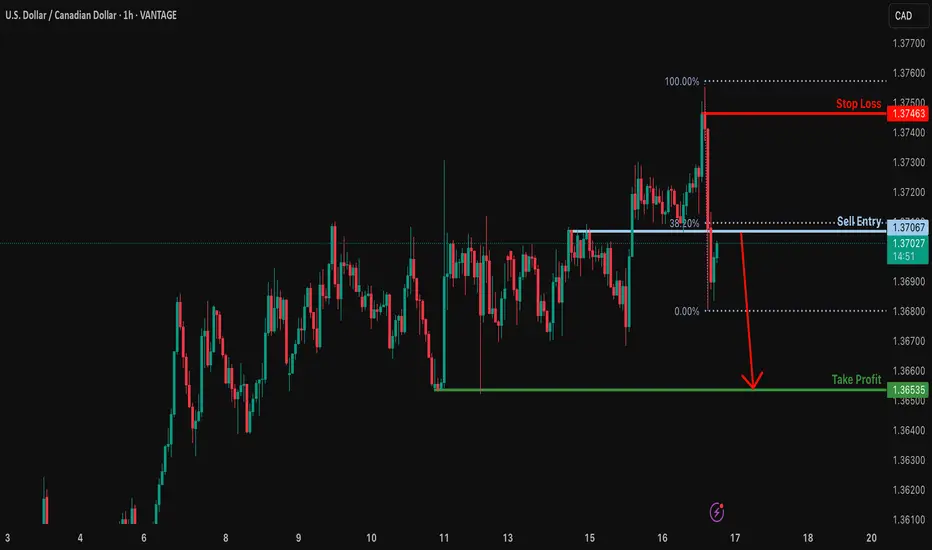
Bearish drop?USD/CAD is rising towards the resistance level which is an overlap resistance at lines up with the 38.2% Fibonacci retracement and could drop from this level to our take profit.
Entry: 1.3706
Why we like it:
There is an overlap resistance that aligns with the 38.2% Fibonacci retracement.
Stop loss: 1.3746
Why we like it:
There is a swing high resistance.
Take profit: 1.3653
Why we like it:
There is a pullback support.
Enjoying your TradingView experience? Review us!
Please be advised that the information presented on TradingView is provided to Vantage (‘Vantage Global Limited’, ‘we’) by a third-party provider (‘Everest Fortune Group’). Please be reminded that you are solely responsible for the trading decisions on your account. There is a very high degree of risk involved in trading. Any information and/or content is intended entirely for research, educational and informational purposes only and does not constitute investment or consultation advice or investment strategy. The information is not tailored to the investment needs of any specific person and therefore does not involve a consideration of any of the investment objectives, financial situation or needs of any viewer that may receive it. Kindly also note that past performance is not a reliable indicator of future results. Actual results may differ materially from those anticipated in forward-looking or past performance statements. We assume no liability as to the accuracy or completeness of any of the information and/or content provided herein and the Company cannot be held responsible for any omission, mistake nor for any loss or damage including without limitation to any loss of profit which may arise from reliance on any information supplied by Everest Fortune Group.
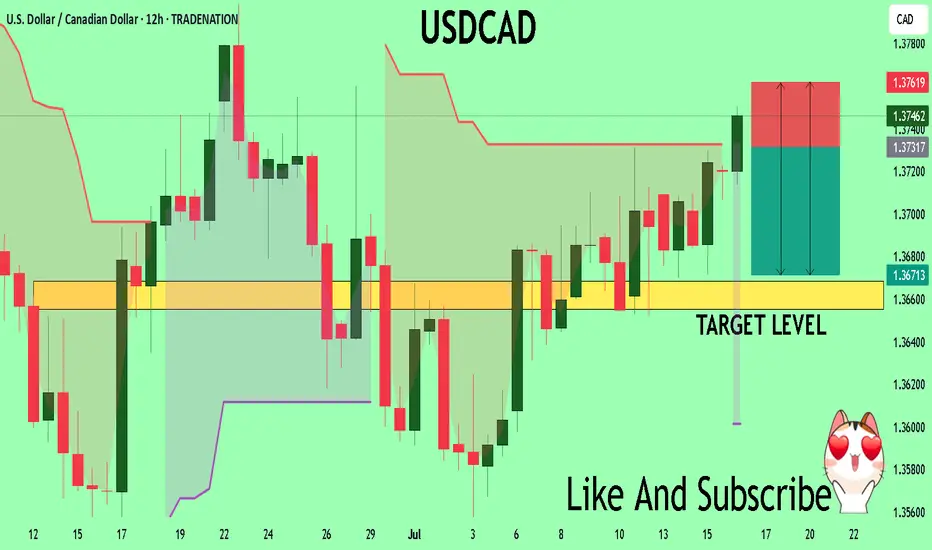
USDCAD Massive Short! SELL!
My dear subscribers,
This is my opinion on the USDCAD next move:
The instrument tests an important psychological level 1.3730
Bias - Bearish
Technical Indicators: Supper Trend gives a precise Bearish signal, while Pivot Point HL predicts price changes and potential reversals in the market.
Target - 1.3668
My Stop Loss - 1.3761
About Used Indicators:
On the subsequent day, trading above the pivot point is thought to indicate ongoing bullish sentiment, while trading below the pivot point indicates bearish sentiment.
Disclosure: I am part of Trade Nation's Influencer program and receive a monthly fee for using their TradingView charts in my analysis.
———————————
WISH YOU ALL LUCK
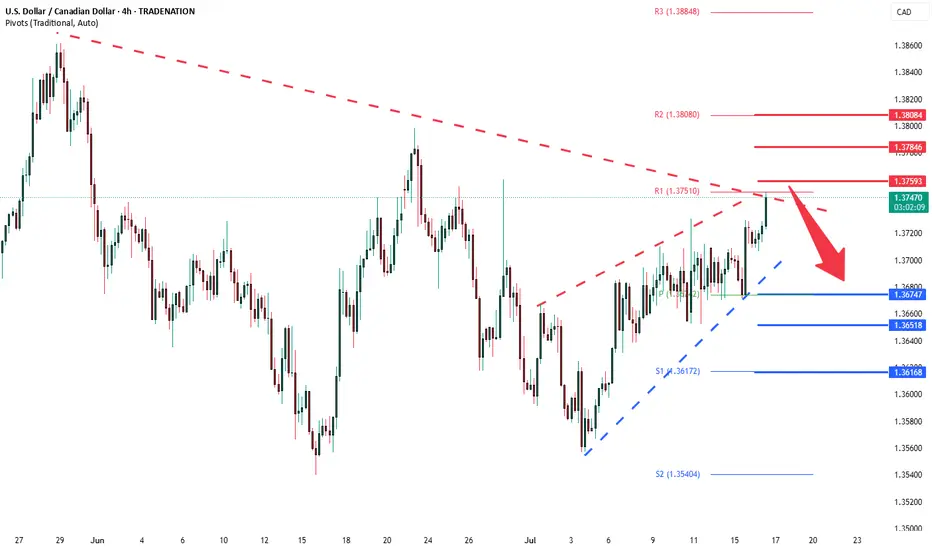
USDCAD oversold consolidation, resistance at 1.3760The USDCAD pair is currently trading with a bearish bias, aligned with the broader downward trend. Recent price action shows a retest of the previous resistance zone, suggesting a temporary sideways consolidation within the downtrend.
Key resistance is located at 1.3760, a prior consolidation zone. This level will be critical in determining the next directional move.
A bearish rejection from 1.3760 could confirm the resumption of the downtrend, targeting the next support levels at 1.3670, followed by 1.3650 and 1.3620 over a longer timeframe.
Conversely, a decisive breakout and daily close above 1.3760 would invalidate the current bearish setup, shifting sentiment to bullish and potentially triggering a move towards 1.3785, then 1.3800.
Conclusion:
The short-term outlook remains bearish unless the pair breaks and holds above 1.3760 Traders should watch for price action signals around this key level to confirm direction. A rejection favours fresh downside continuation, while a breakout signals a potential trend reversal or deeper correction.
This communication is for informational purposes only and should not be viewed as any form of recommendation as to a particular course of action or as investment advice. It is not intended as an offer or solicitation for the purchase or sale of any financial instrument or as an official confirmation of any transaction. Opinions, estimates and assumptions expressed herein are made as of the date of this communication and are subject to change without notice. This communication has been prepared based upon information, including market prices, data and other information, believed to be reliable; however, Trade Nation does not warrant its completeness or accuracy. All market prices and market data contained in or attached to this communication are indicative and subject to change without notice.
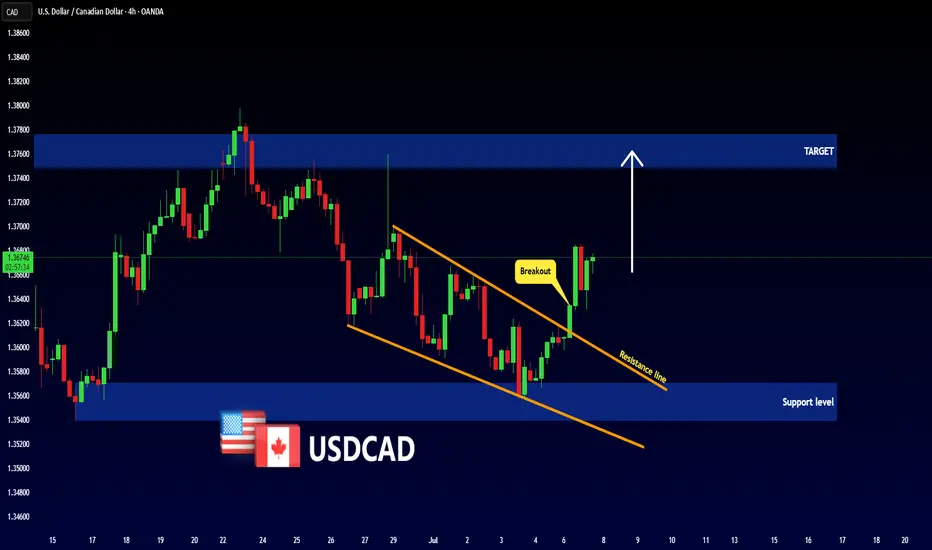
USDCAD - Bullish Falling WedgeHello Traders !
On Thursday 3 July, The USDCAD reached the support level (1.35400 - 1.35706).
The price formed a falling wedge pattern.
Currently, The resistance line is broken!
So, I expect a bullish move🚀
______________
TARGET: 1.37490🎯
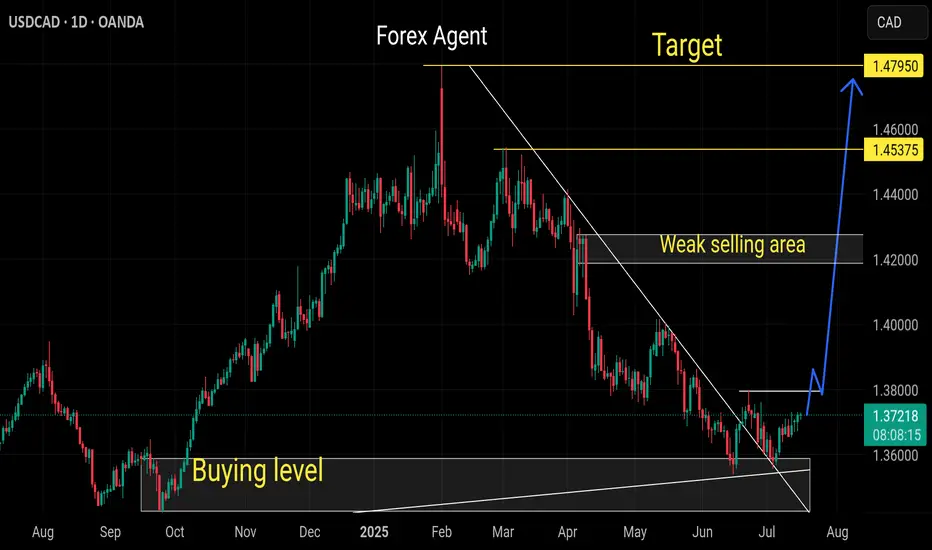
Strong buy usdcadA strong buy wave coming
Monthly already oversold pair
Daily sell trend already breaks giving a signals for buyers
As usd gonna strong among all Cross pairs
Usdcad strong buyStrong buy expected
Weekly and monthly too oversold pair
Daily down trend breaks already which giving the good signs for buyers
Strong bullish correction expected

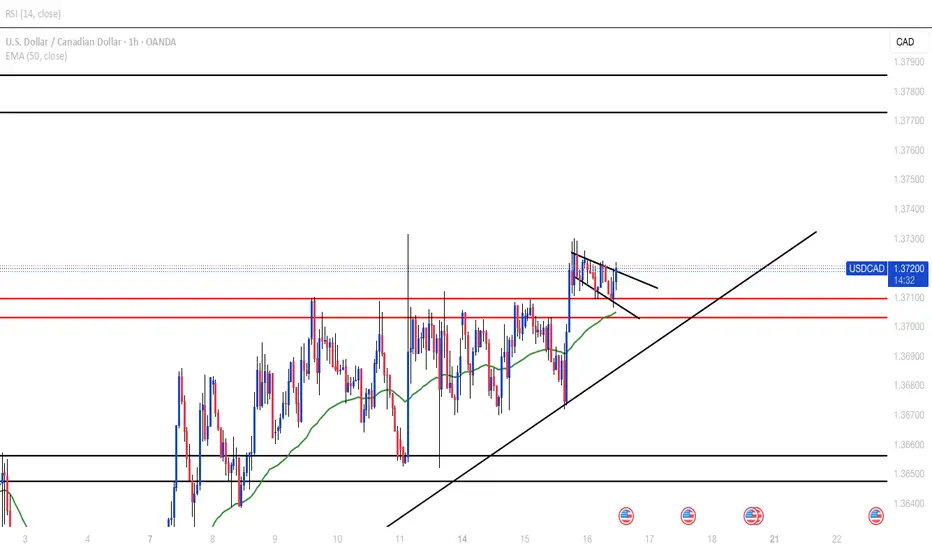
USDCADBroke H1 resistance and price is forming a bullish flag as it retests the zone. Possible movement to next H4 resistance around 1.37700

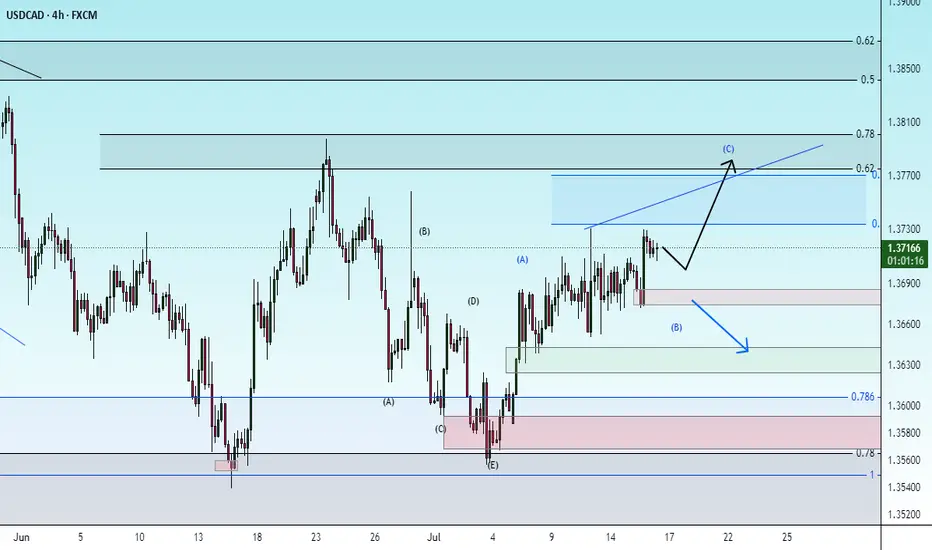
uptrendGiven the support trend line being broken, it is expected that the upward trend will form up to the specified resistance area and then a trend change will be likely. Then the continuation of the downward trend will be possible.
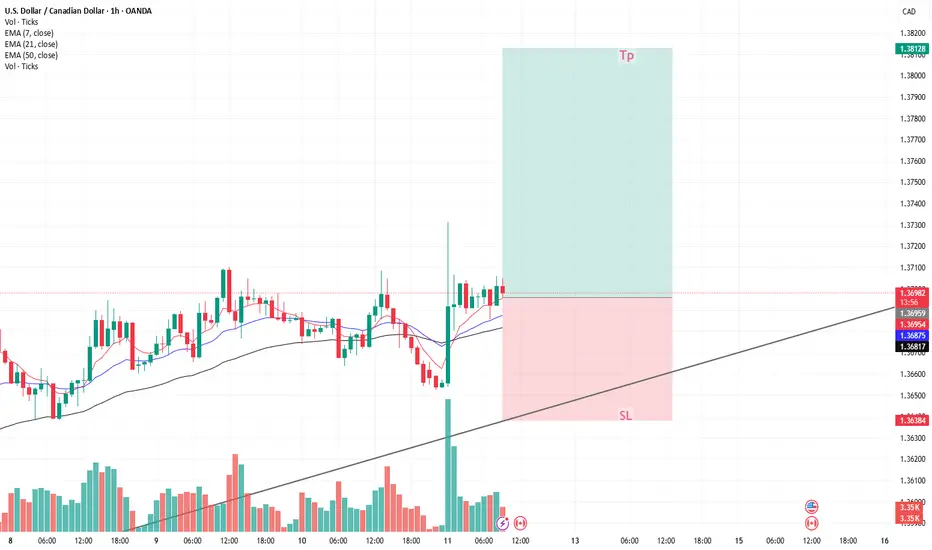
USDCAD (U.S. Dollar/Canadian Dollar) long (buy) setupUSDCAD (U.S. Dollar/Canadian Dollar) long (buy) setup. Here's the breakdown:
**Setup Overview**
* **Entry Level:** Around 1.3700
* **Take Profit (TP):** 1.3812 (upper green zone)
* **Stop Loss (SL):** 1.3638 (lower red zone)
**Technical Observations**
* Price is bouncing from a rising trendline (diagonal black line), suggesting bullish support.
* Price is trading above the 50 EMA, 21 EMA, and 7 EMA — indicating bullish momentum.
* A strong bullish candle with high volume occurred before consolidation, showing buyer interest.
* Tight consolidation near the entry level suggests potential for a breakout continuation upward.
**Bias**
* **Bullish** bias as long as price remains above the trendline and EMAs.
* The trade offers a favorable risk-to-reward ratio, targeting a \~110 pip gain vs. \~60 pip risk.
*Summary**
The chart shows a bullish trade setup on USDCAD based on trendline support, EMA alignment, and volume confirmation. A breakout above 1.3700 aims for 1.3812, while invalidation lies below 1.3638.
USD/CAD(20250716)Today's AnalysisMarket news:
① The annual rate of the overall CPI in the United States in June rose to 2.7%, the highest since February, in line with market expectations, and the monthly rate was 0.3%, the highest since January, in line with market expectations; the annual rate of the core CPI rose to 2.9%, the highest since February, lower than the expected 3%, but slightly higher than 2.8% last month, and the monthly rate was 0.2%, lower than the market expectation of 0.3%.
② Interest rate futures still show that the Fed is unlikely to cut interest rates this month, but there is a high possibility of a 25 basis point cut in September.
③ Fed mouthpiece: The CPI report will not change the Fed's policy direction.
④ Trump: Consumer prices are low and the federal funds rate should be lowered immediately. The Fed should cut interest rates by 3 percentage points.
⑤ Fed Collins: The core inflation rate is expected to remain at about 3% by the end of the year, and the Fed should maintain active patience.
Technical analysis:
Today's buying and selling boundaries:
1.3708
Support and resistance levels:
1.3766
1.3744
1.3730
1.3685
1.3671
1.3650
Trading strategy:
If the price breaks through 1.3730, consider buying, the first target price is 1.3744
If the price breaks through 1.3708, consider selling, the first target price is 1.3685

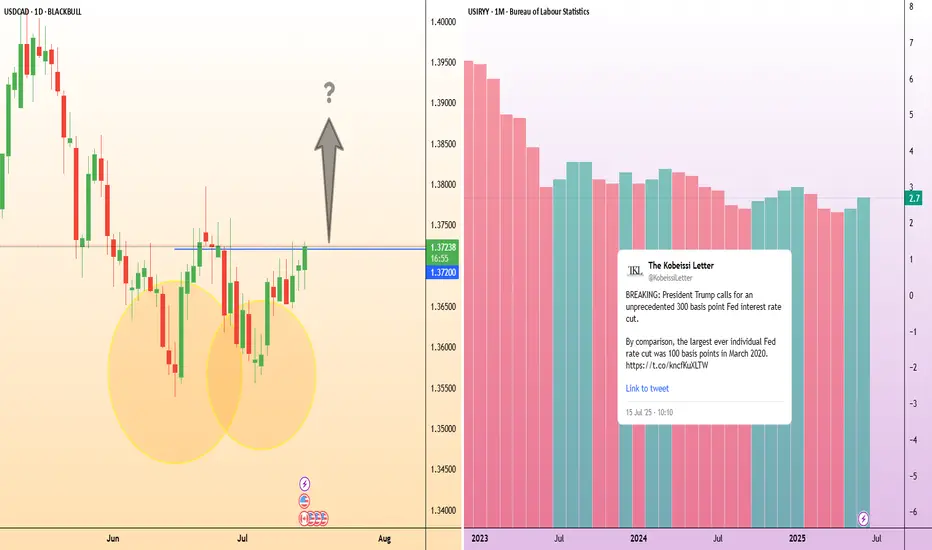
USD/CAD: Inflation gaps create opportunityIn the U.S., inflation accelerated for a second straight month, with headline CPI reaching 2.7% year-on-year in June as President Trump’s tariffs begin to push up the cost of a range of goods.
Increasing inflation could likely heighten the Federal Reserve’s reluctance to cut its interest rate, in defiance of Trump’s public demand. This could provide upward momentum for USD/CAD if expectations for rate cuts are delayed.
USD/CAD is showing signs of a potential trend reversal after finding strong support around 1.3600 in late June. Price action has since formed a series of higher lows, and the recent breakout attempt above 1.3720 suggests bullish momentum could be building.
Canada’s inflation rate, released at the same time as the US’s, edged up to 1.9%, staying below the Bank of Canada’s 2% target for a third consecutive month. With the BoC already signalling easing bias, this divergence in inflation paths may limit CAD strength.
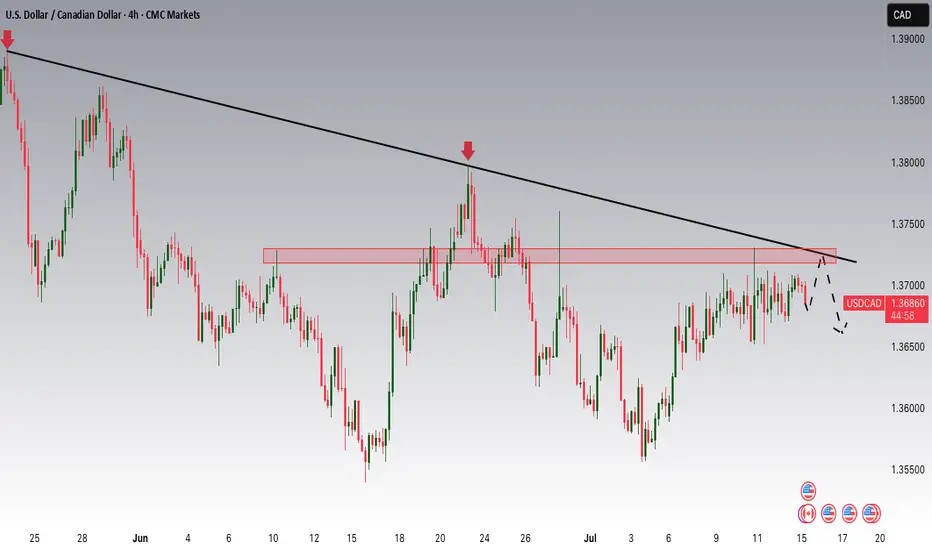
USD/CAD Coils Below Key ResistanceUSD/CAD has rallied nearly 1.3% off the monthly low with the advance now testing resistance at 1.3729/50- a region defined by the 38.2% retracement of the 2021 rally and the May opening-range lows. Note that pitchfork resistance converges on this threshold over the next few days and further highlights the technical significance of this key zone- looking for a reaction off this mark this week.
USD/CAD is trading within the confines of an embedded channel extending off the monthly low with the weekly opening range taking shape just below confluent resistance at 1.3729/50. Ultimately, a breach / close above the June high / 61.8% retracement of the December 2023 advance at 1.3795/98 is needed to suggest a more significant low was registered last month / a larger trend reversal is underway. Subsequent resistance seen at the 2022 high close / 2023 high at 1.3881/99 and the 2022 high / 2020 March weekly-reversal close at 1.3977/90- both levels of interest for possible topside exhaustion / price inflection IF reached.
Initial support rests with the weekly range lows at 1.3670- a break / close below the monthly channel would threaten resumption of the broader downtrend. Subsequent support objectives unchanged at the yearly low-day close (LDC) / May, June, July lows at 1.3571/90 and the Fibonacci confluence at 1.3504/23.
Bottom line: The USD/CAD is testing confluent resistance at the February downtrend with the weekly opening-range set just below- look for the breakout in the days ahead and watch the weekly close here. From a trading standpoint, losses would need to be limited to the weekly lows IF price is heading for a breakout on this stretch with a close above 1.3795 ultimately needed to put the bulls in control.
-MB

Bullish bounce off pullback support?USD/CAD is falling towards the support level which is a pullback support and could bounce from this level to our take profit.
Entry: 1.3695
Why we like it:
There is a pullback support.
Stop loss: 1.3644
Why we like it:
There is a pullback support that aligns with the 50% Fibonacci retracement.
Take profit: 1.3781
Why we lik eit:
There is a pullback resistance.
Enjoying your TradingView experience? Review us!
Please be advised that the information presented on TradingView is provided to Vantage (‘Vantage Global Limited’, ‘we’) by a third-party provider (‘Everest Fortune Group’). Please be reminded that you are solely responsible for the trading decisions on your account. There is a very high degree of risk involved in trading. Any information and/or content is intended entirely for research, educational and informational purposes only and does not constitute investment or consultation advice or investment strategy. The information is not tailored to the investment needs of any specific person and therefore does not involve a consideration of any of the investment objectives, financial situation or needs of any viewer that may receive it. Kindly also note that past performance is not a reliable indicator of future results. Actual results may differ materially from those anticipated in forward-looking or past performance statements. We assume no liability as to the accuracy or completeness of any of the information and/or content provided herein and the Company cannot be held responsible for any omission, mistake nor for any loss or damage including without limitation to any loss of profit which may arise from reliance on any information supplied by Everest Fortune Group.

USDCAD Potential DownsidesHey Traders, in today's trading session we are monitoring USDCAD for a selling opportunity around 1.37200 zone, USDCAD is trading in a downtrend and currently is in a correction phase in which it is approaching the trend at 1.37200 support and resistance area.
Trade safe, Joe.
USDCAD LongWe are looking to go long on this pair. It is on a Key Fibonacci level. We hoping to buy to the top of the FIB
Long USDCAD
The streets all knows about this pair..
Risk little percentage of your portfolio, while it will take weeks for it to fully develop by continually adding to your positions

Remains Below 1.3700 Ahead of CPI Data from the US and CADUSD/CAD Remains Below 1.3700 Ahead of CPI Data from the US and Canada
USD/CAD continues to decline ahead of inflation data from both the US and Canada.
The US inflation rate is expected to rise to 2.7% year-over-year in June, up from 2.4% recorded in May.
Meanwhile, Canada’s CPI is forecasted to increase by 1.9% year-over-year in June, up from 1.7% in May.
USD/CAD is trading around 1.3690 during the European session on Tuesday, following two days of gains. The pair is declining as the US dollar (USD) continues to weaken ahead of the June CPI data from the US. The inflation figures will provide new insights into the Federal Reserve's (Fed) monetary outlook.
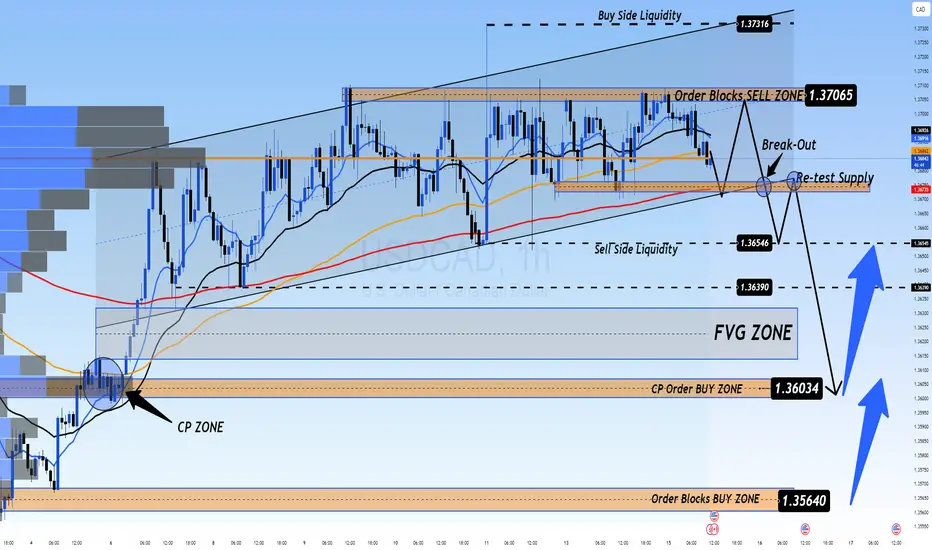
📉 Market Outlook for USD/CAD – Possible Drop on CPI Release
The USDCAD is still in a downtrend, and a sharp drop could occur with today’s CPI data release. Currently, there are two Buy Side Liquidity zones above and Sell Side Liquidity below, with the price balanced around the VPOC zone, which will soon decide the direction after the CPI announcement today.
Market liquidity still holds a FVG below, and with CPI data expected to favor USD, this could trigger a sharp drop towards this liquidity zone, possibly nearing CP OBS at 1.3600, followed by a potential rebound.
If price breaks CP zone, it may head toward a strong OB zone near 1.35xxx. Therefore, caution is advised when monitoring these OB zones.
🎯 Trading Strategy for Today
🟢 BUY ZONE: 1.36000
SL: 1.35500
TP: 1.36500 → 1.37000 → 1.37500 → ????
💬 What are your thoughts on USD/CAD ahead of the CPI data release? Do you expect a strong bounce or a continued decline? Share your views and join the conversation below!
👉 Follow for more updates and insights, and join the community to discuss real-time market moves!
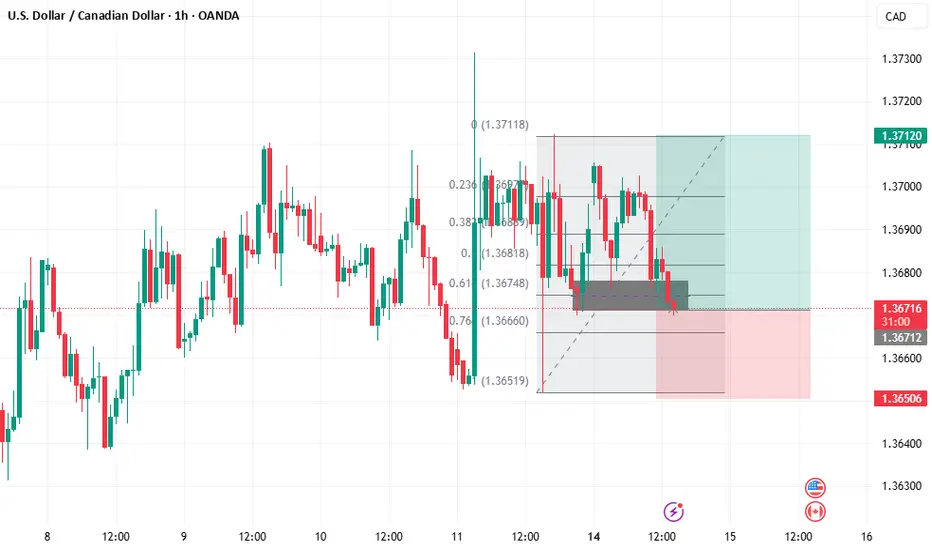
14.07.2025 #USDCADBUY 1.36750 | SROP 1.36400 | STOP 1.37310 | Price movement within the local ascending channel.

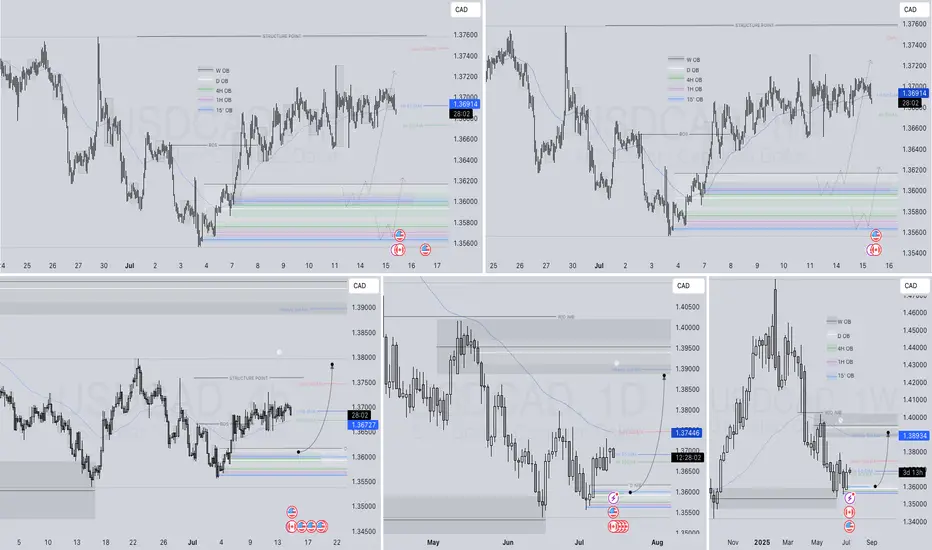
USDCAD LONG DAILY FORECAST Q3 D15 W29 Y25USDCAD LONG DAILY FORECAST Q3 D15 W29 Y25
Professional Risk Managers👋
Welcome back to another FRGNT chart update📈
Diving into some Forex setups using predominantly higher time frame order blocks alongside confirmation breaks of structure.
Let’s see what price action is telling us today! 👀
💡Here are some trade confluences📝
✅Daily Order block identified
✅4H Order Block identified
✅1H Order Block identified
🔑 Remember, to participate in trading comes always with a degree of risk, therefore as professional risk managers it remains vital that we stick to our risk management plan as well as our trading strategies.
📈The rest, we leave to the balance of probabilities.
💡Fail to plan. Plan to fail.
🏆It has always been that simple.
❤️Good luck with your trading journey, I shall see you at the very top.
🎯Trade consistent, FRGNT X
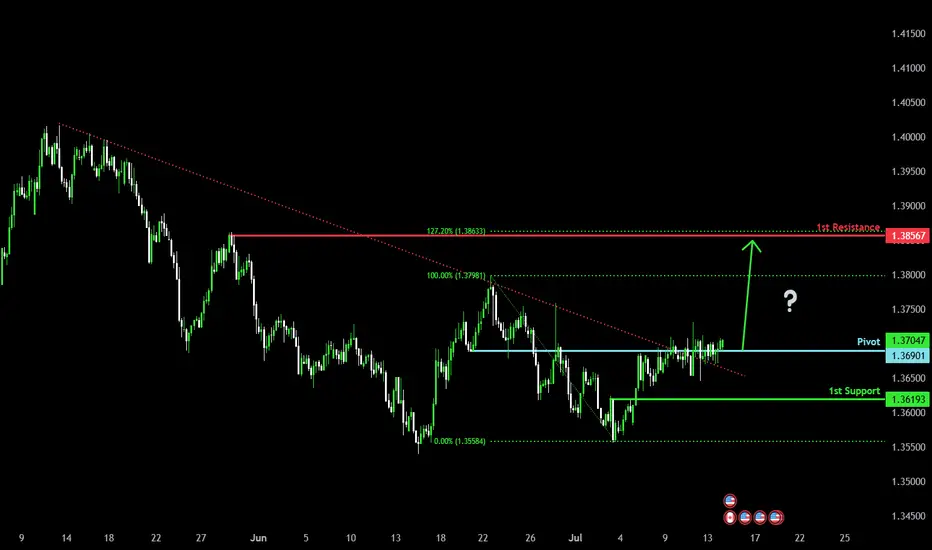
Potential bullish rise?The Loonie (USD/CAD) is reacting off the pivot and could rise to the 1st resistance which is a pullback resistance that aligns with the 127.2% Fibonacci extension.
Pivot: 1.3690
1st Support: 1.3619
1st Resistance: 1.3856
Risk Warning:
Trading Forex and CFDs carries a high level of risk to your capital and you should only trade with money you can afford to lose. Trading Forex and CFDs may not be suitable for all investors, so please ensure that you fully understand the risks involved and seek independent advice if necessary.
Disclaimer:
The above opinions given constitute general market commentary, and do not constitute the opinion or advice of IC Markets or any form of personal or investment advice.
Any opinions, news, research, analyses, prices, other information, or links to third-party sites contained on this website are provided on an "as-is" basis, are intended only to be informative, is not an advice nor a recommendation, nor research, or a record of our trading prices, or an offer of, or solicitation for a transaction in any financial instrument and thus should not be treated as such. The information provided does not involve any specific investment objectives, financial situation and needs of any specific person who may receive it. Please be aware, that past performance is not a reliable indicator of future performance and/or results. Past Performance or Forward-looking scenarios based upon the reasonable beliefs of the third-party provider are not a guarantee of future performance. Actual results may differ materially from those anticipated in forward-looking or past performance statements. IC Markets makes no representation or warranty and assumes no liability as to the accuracy or completeness of the information provided, nor any loss arising from any investment based on a recommendation, forecast or any information supplied by any third-party.
USDCAD Analysis (4H TF)USDCAD Analysis (4H TF)
The market has been in a strong downtrend, clearly marked by multiple Break of Structure (BOS). However, we’re now seeing signs of accumulation at the lower levels, with multiple CHoCH (Change of Character) signaling a possible trend shift.
Price is currently consolidating around 1.3700, tapping into previous supply and demand zones. If the bullish structure holds, we could see a continuation upward toward the next resistance.
What I’m watching:
- A clear breakout and retest above the 1.3730 zone
- Bullish confirmation before entering
- Tight risk management, as we’re still inside a larger descending channel
Trade idea: Wait for a clean breakout or a reaction from the supply zone. Let the market confirm your bias.
