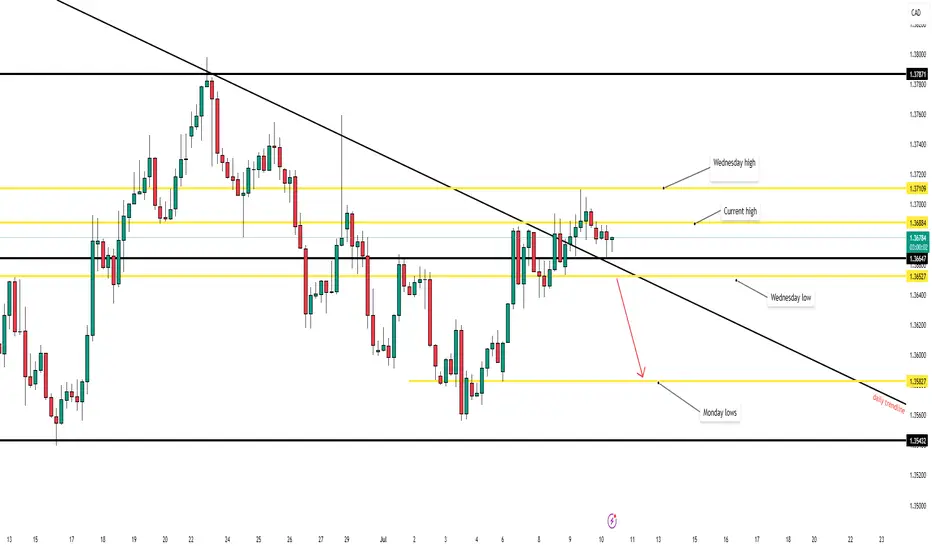
USDCAD – July 10 OutlookUSDCAD’s high-risk, high-reward (HRHR) sells from Wednesday are still in play with price currently up 35 pips. Price action remains within the structure as we continue to respect the March trendline, but are now stalling in a tight 4H range.
📍 Key Observations:
1.36647 is acting as strong intraday support
Possible retest of yesterday’s or Wednesday’s high could provide another HRHR sell opportunity
Break below 1.36527 could open the door for a clean 70-pip move toward 1.35827
🔔 Summary: Patience is essential—watching for either another short-term rejection at resistance or a clean structural break to continue the broader bearish bias.
USDCAD trade ideas
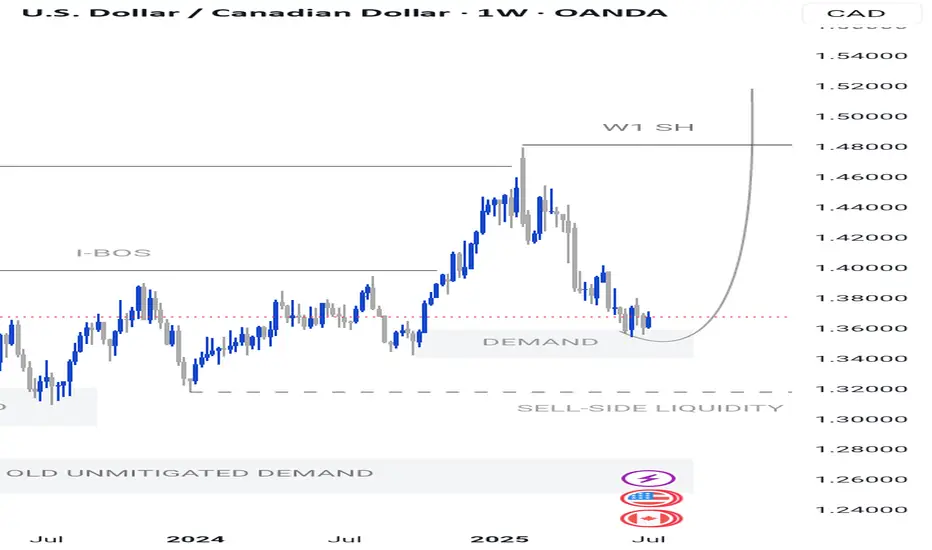
UPDATE - PRICE HAS MITIGATED OUR DEMAND IDEAL FOR LONGSPreviously we were waiting for that retracement or pullback to Weekly Demand ideal for long buys
Now anticipating a trend change - Use H4 for confirmation then we can buy this to the moon.
I will drop the confirmation once confirmed

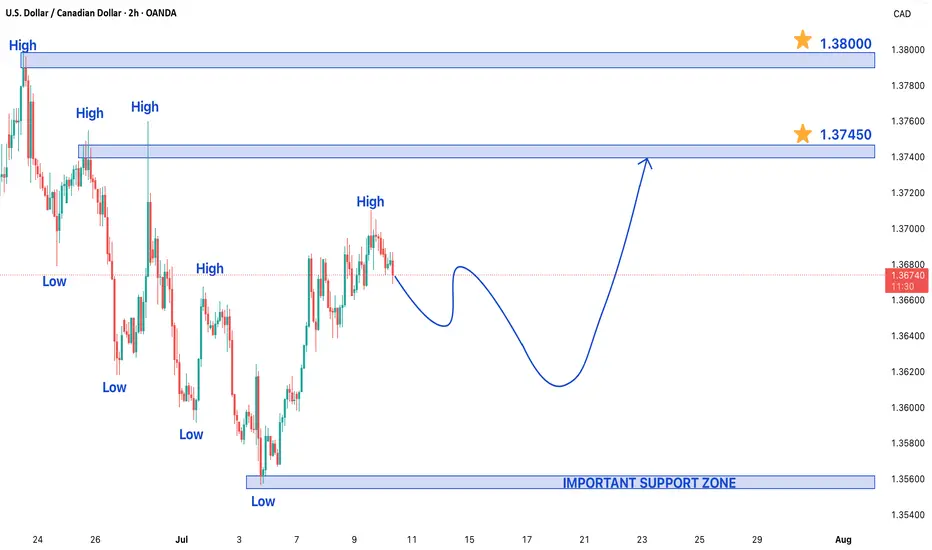
USDCAD Entering Bullish Trend on 2-Hour Chart – Key LevelsUSDCAD Entering Bullish Trend on 2-Hour Chart – Key Levels and Analysis
The USDCAD pair is showing early signs of a potential bullish trend reversal on the 2-hour chart, as price action has formed a Higher High, indicating a shift in market structure. This pattern suggests that buyers are gradually gaining control, which could lead to further upside momentum if the trend continues. However, in the short term, the pair may still experience some bearish pressure before confirming a full bullish breakout.
Current Market Structure and Bullish Indications
- The formation of a Higher High signals that the downtrend may be weakening, and buyers are stepping in at higher levels.
- If the price holds above recent swing lows, it could confirm the beginning of a new uptrend phase.
- However, traders should remain cautious, as a temporary pullback or consolidation is possible before a sustained upward move.
Key Support Level: 1.35500
On the downside, 1.35500 is a critical support zone. This level has previously acted as both resistance and support, making it a strong area for buyers to defend.
- Bullish Scenario: If the price bounces from 1.35500, it could reinforce the bullish outlook and provide a base for further upward movement.
- Bearish Risk: A decisive break below this level could delay the bullish reversal and lead to a deeper retracement toward 1.35000 or lower.
Upside Targets: 1.37450 & 1.38000
If the bullish momentum strengthens, the next key resistance levels to watch are:
1. 1.37450 – A break above this level could accelerate buying interest.
2. 1.38000 – A major psychological and technical resistance zone where profit-taking may occur.
Short-Term Bearish Possibility Before Bullish Continuation
Despite the bullish signals, the pair may still face short-term bearish pressure due to:
- Profit-taking near resistance levels.
- Potential USD weakness or CAD strength in upcoming sessions.
- Market consolidation before the next directional move.
Trading Strategy & Key Takeaways
- Confirmation Needed: Wait for a strong close above recent highs to confirm the bullish trend.
- Support Watch: A hold above 1.35500 keeps the bullish structure intact.
- Targets: If bullish momentum continues, 1.37450 and 1.38000 are the next key objectives.
- Risk Management: A break below 1.35500 could invalidate the bullish setup, leading to a reassessment of the trend.
Conclusion
The USDCAD is showing early signs of a bullish reversal on the 2-hour chart, but traders should remain cautious of short-term bearish retracements. The critical levels to watch are 1.35500 (support) and 1.37450–1.38000 (resistance targets). A confirmed breakout above resistance could signal a stronger bullish trend, while a breakdown below support may extend the correction phase. Proper risk management and confirmation through price action will be essential for successful trading in this scenario.
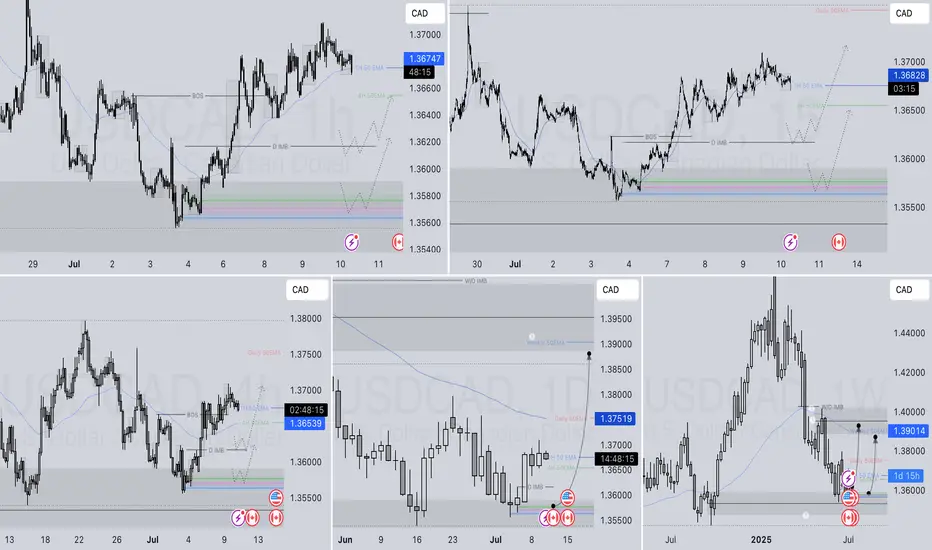
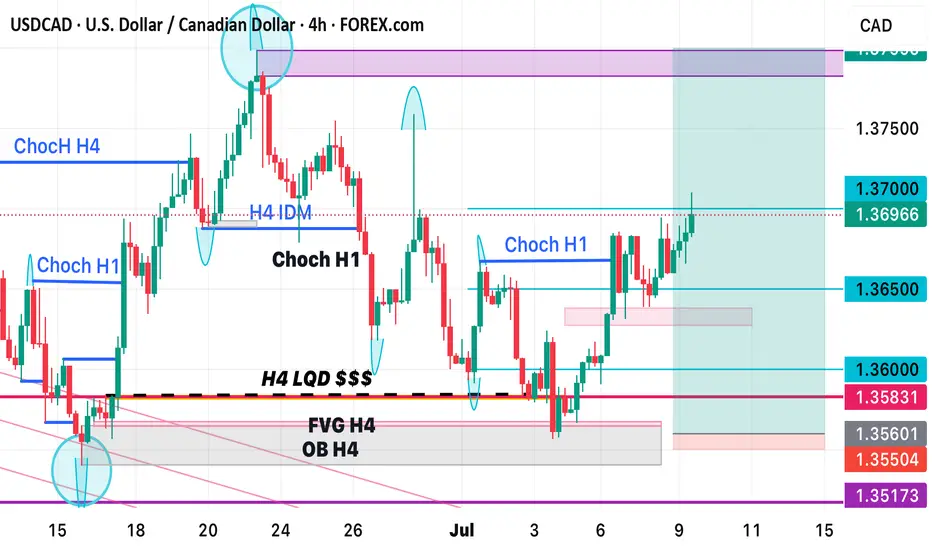
USDCAD LONG DAILY FORECAST Q3 D10 W28 Y25USDCAD LONG DAILY FORECAST Q3 D10 W28 Y25
Professional Risk Managers👋
Welcome back to another FRGNT chart update📈
Diving into some Forex setups using predominantly higher time frame order blocks alongside confirmation breaks of structure.
Let’s see what price action is telling us today! 👀
💡Here are some trade confluences📝
✅Daily Order block identified
✅4H Order Block identified
✅1H Order Block identified
🔑 Remember, to participate in trading comes always with a degree of risk, therefore as professional risk managers it remains vital that we stick to our risk management plan as well as our trading strategies.
📈The rest, we leave to the balance of probabilities.
💡Fail to plan. Plan to fail.
🏆It has always been that simple.
❤️Good luck with your trading journey, I shall see you at the very top.
🎯Trade consistent, FRGNT X
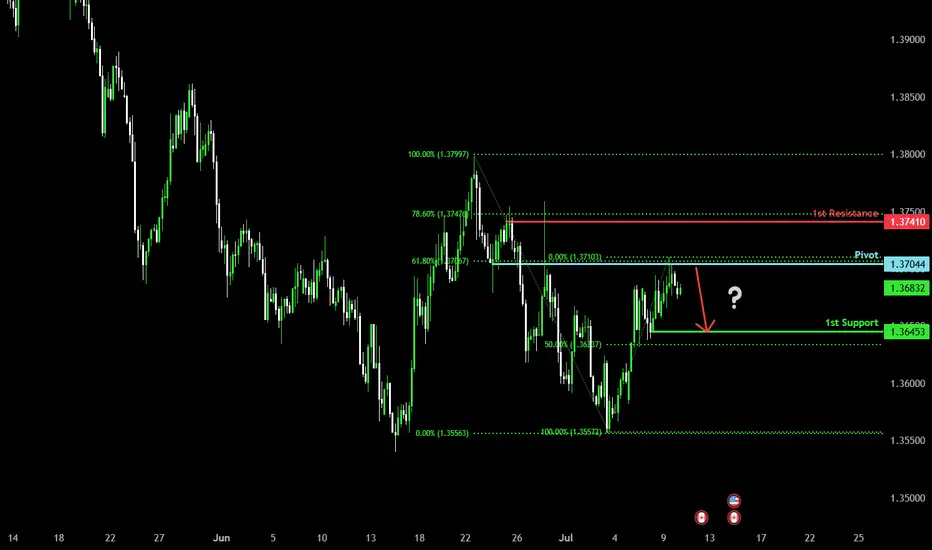
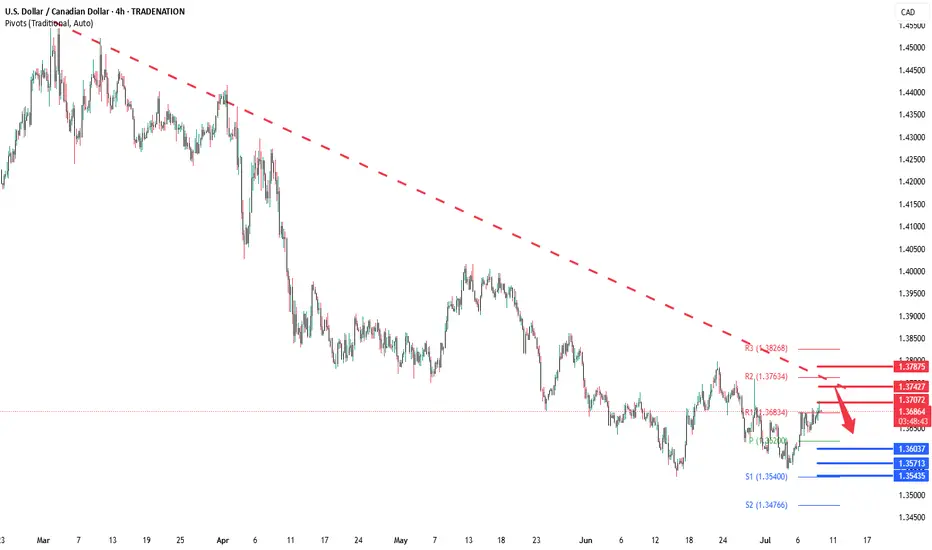
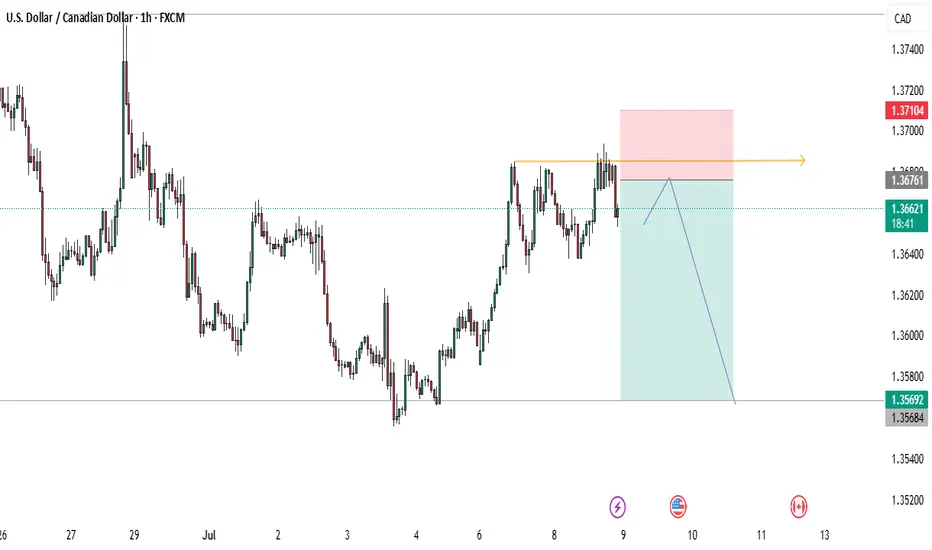
Bearish reversal off overlap resistance?The Loonie (USD/CAD) has rejected off the pivot which has been identified as an overlap resistance and could drop to the 1st support which acts as a pullback support.
Pivot: 1.3704
1st Support: 1.3645
1st Resistance: 1.3741
Risk Warning:
Trading Forex and CFDs carries a high level of risk to your capital and you should only trade with money you can afford to lose. Trading Forex and CFDs may not be suitable for all investors, so please ensure that you fully understand the risks involved and seek independent advice if necessary.
Disclaimer:
The above opinions given constitute general market commentary, and do not constitute the opinion or advice of IC Markets or any form of personal or investment advice.
Any opinions, news, research, analyses, prices, other information, or links to third-party sites contained on this website are provided on an "as-is" basis, are intended only to be informative, is not an advice nor a recommendation, nor research, or a record of our trading prices, or an offer of, or solicitation for a transaction in any financial instrument and thus should not be treated as such. The information provided does not involve any specific investment objectives, financial situation and needs of any specific person who may receive it. Please be aware, that past performance is not a reliable indicator of future performance and/or results. Past Performance or Forward-looking scenarios based upon the reasonable beliefs of the third-party provider are not a guarantee of future performance. Actual results may differ materially from those anticipated in forward-looking or past performance statements. IC Markets makes no representation or warranty and assumes no liability as to the accuracy or completeness of the information provided, nor any loss arising from any investment based on a recommendation, forecast or any information supplied by any third-party.
USDCAD Potential DownsidesHey Traders, in today's trading session we are monitoring USDCAD for a selling opportunity around 1.36900 zone, USDCAD is trading in a downtrend and currently is in a correction phase in which it is approaching the trend at 1.36900 support and resistance area.
Trade safe, Joe.
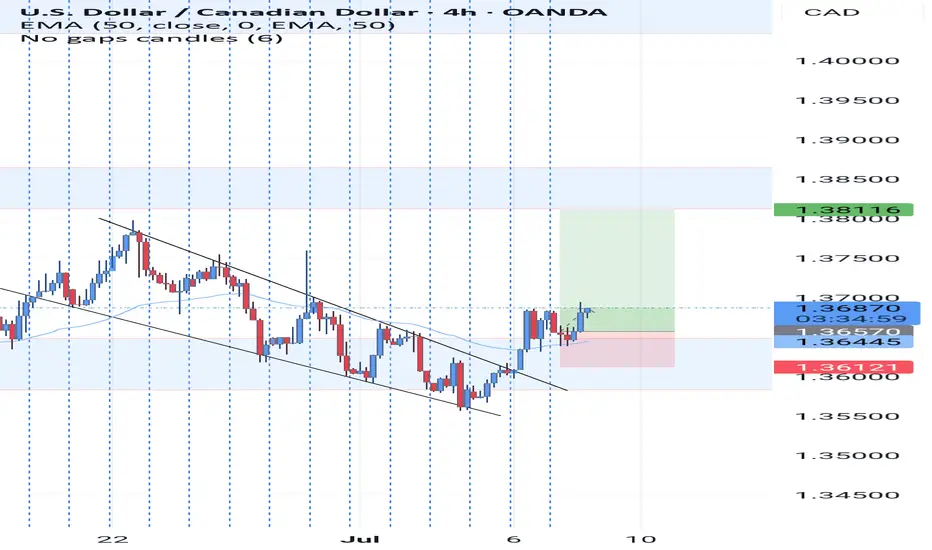
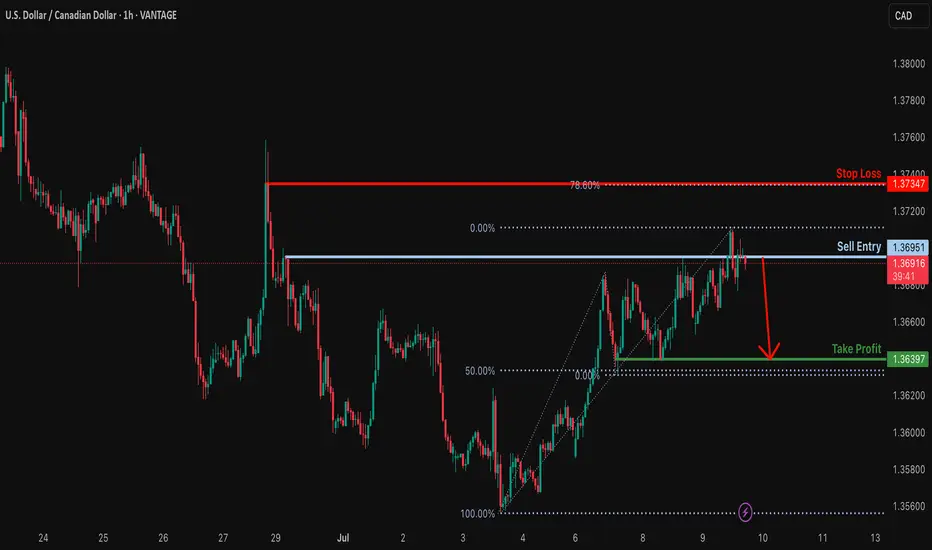
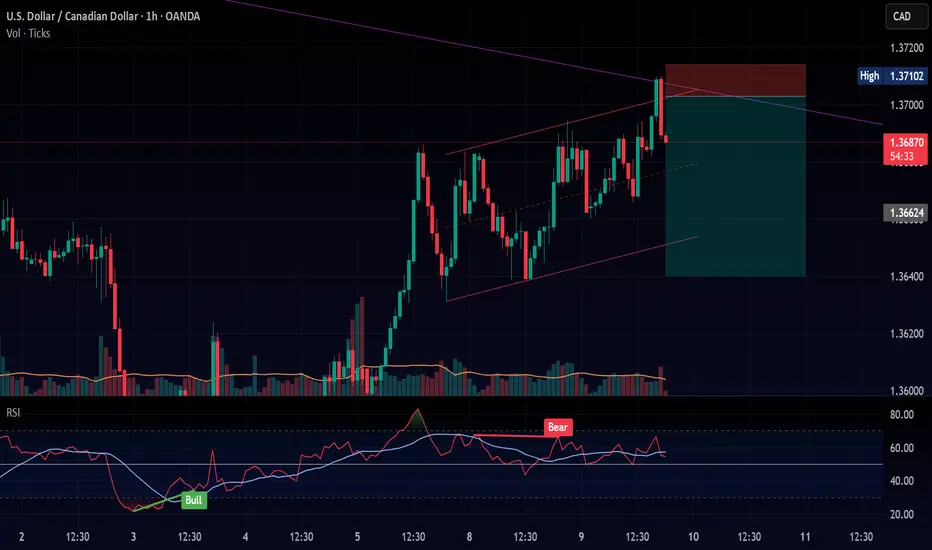
Bearish reversal?USD/CAD is reacting off the resistance level which is a pullback resistance and could drop from this level to our take profit.
Entry: 1.3695
Why we like it:
There is a pullback resistance.
Stop loss: 1.3734
Why we like it:
There is a pullback resistance level that aligns with the 78.6% Fibonacci projection.
Take profit: 1.3639
Why we like it:
There is a pullback support that is slightly above the 50% Fibonacci retracement.
Enjoying your TradingView experience? Review us!
Please be advised that the information presented on TradingView is provided to Vantage (‘Vantage Global Limited’, ‘we’) by a third-party provider (‘Everest Fortune Group’). Please be reminded that you are solely responsible for the trading decisions on your account. There is a very high degree of risk involved in trading. Any information and/or content is intended entirely for research, educational and informational purposes only and does not constitute investment or consultation advice or investment strategy. The information is not tailored to the investment needs of any specific person and therefore does not involve a consideration of any of the investment objectives, financial situation or needs of any viewer that may receive it. Kindly also note that past performance is not a reliable indicator of future results. Actual results may differ materially from those anticipated in forward-looking or past performance statements. We assume no liability as to the accuracy or completeness of any of the information and/or content provided herein and the Company cannot be held responsible for any omission, mistake nor for any loss or damage including without limitation to any loss of profit which may arise from reliance on any information supplied by Everest Fortune Group.
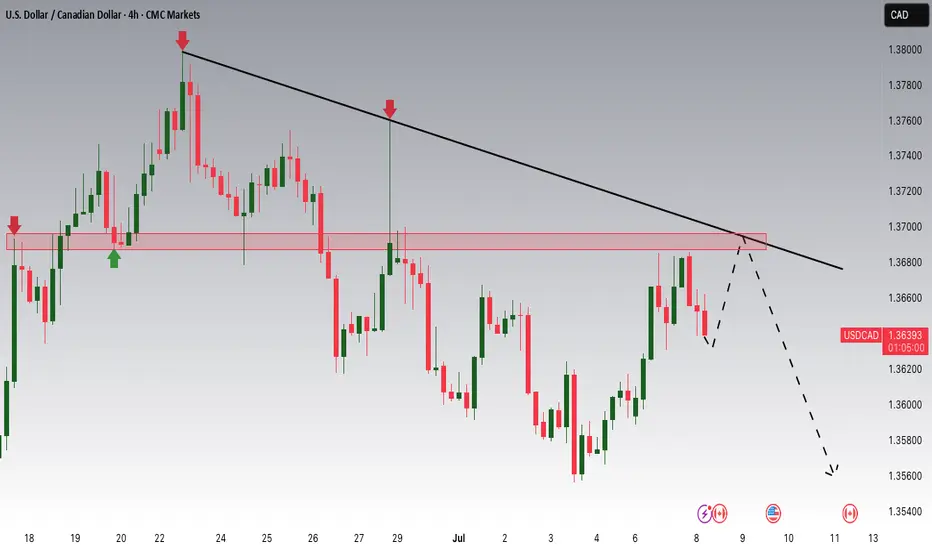
USD/CAD carving out a bottom?The USD/CAD is poking its head above a bearish trend line that has been in place since mid-May, in one of the first signs that suggests we may have seen a low in the Loonie. As well as the trend line, the 21-day exponential is also now below price, further suggesting that the tide is turning.
Key levels
Support levels off this daily chart are seen around 1.3695 then 1.3617
Resistance seen around 1.3750 next, followed by the next round handles like 1.38, 1.39 etc.
By Fawad Razaqzada, market analyst with FOREX.com

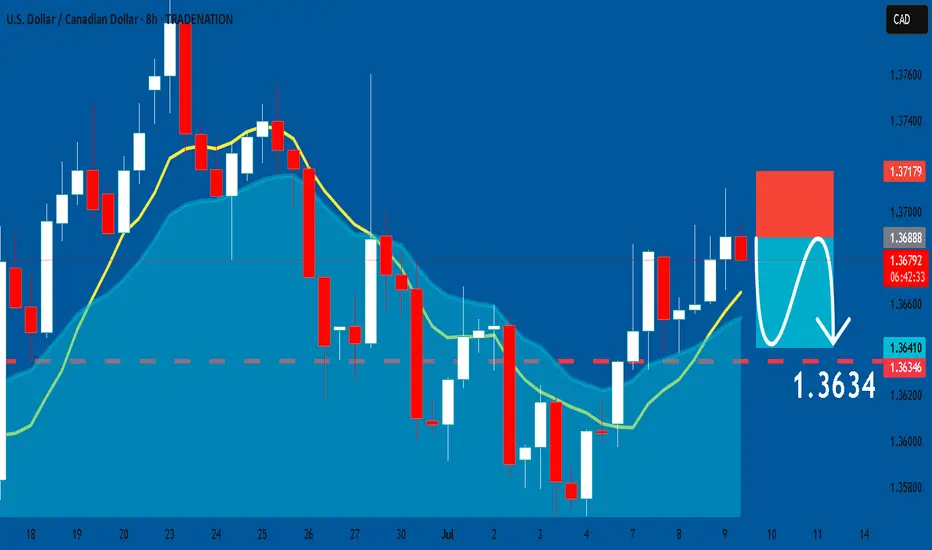
USDCAD: Bearish Continuation & Short Signal
USDCAD
- Classic bearish setup
- Our team expects bearish continuation
SUGGESTED TRADE:
Swing Trade
Short USDCAD
Entry Point - 1.3688
Stop Loss - 1.3717
Take Profit - 1.3634
Our Risk - 1%
Start protection of your profits from lower levels
Disclosure: I am part of Trade Nation's Influencer program and receive a monthly fee for using their TradingView charts in my analysis.
❤️ Please, support our work with like & comment! ❤️
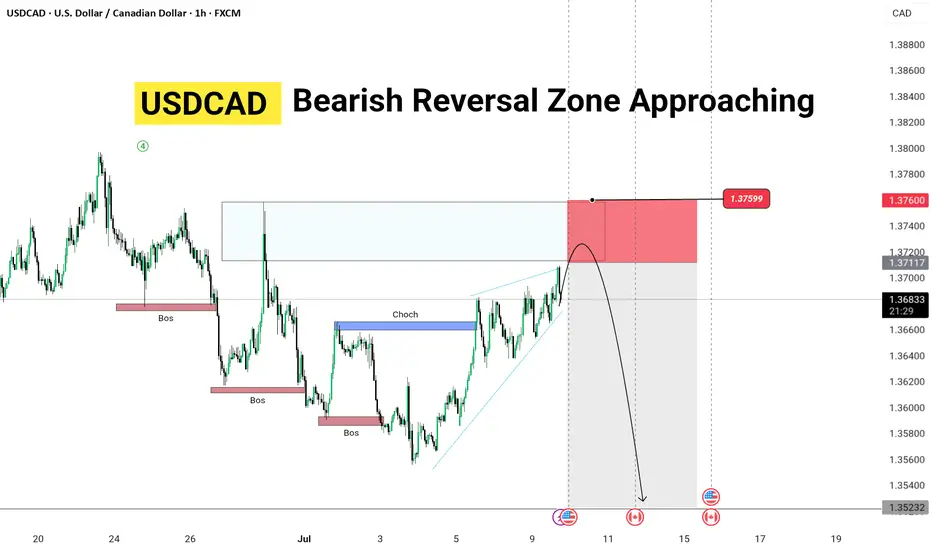
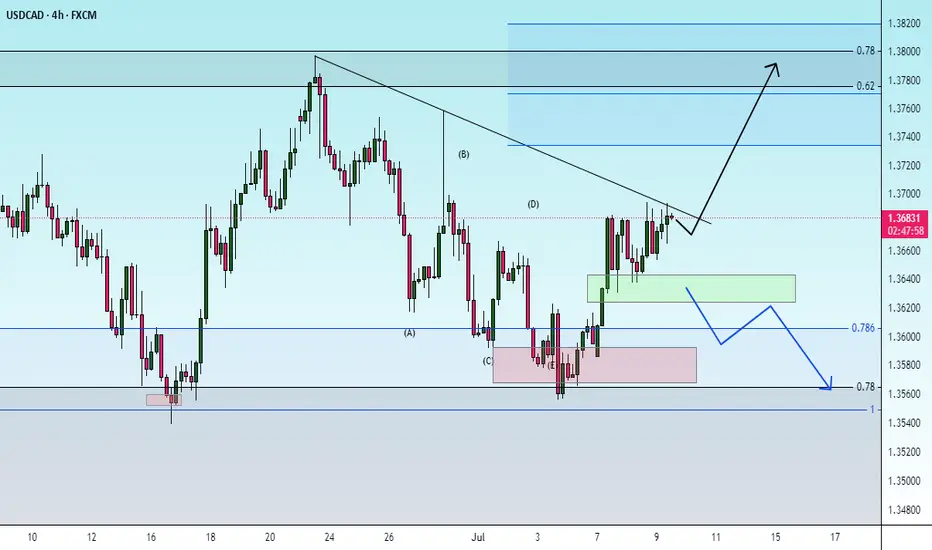
Bearish Reversal Zone Approaching🔹 Pair: USDCAD
🔹 Timeframe: H4
🔹 Price: 1.36806
🔹 Bias: Short/SELL Setup Pending
---
💡 Analysis Summary:
USDCAD is approaching a major resistance zone aligned with the 61.8% Fibonacci retracement level from the previous bearish leg.
Structure shows a clear ABC corrective pattern with signs of exhaustion at current levels.
---
📌 Key Levels to Watch:
🔺 Resistance: 1.3720–1.3740 (Potential Reversal Zone)
🔻 Target Zone: 1.3450–1.3500
🔓 Invalidation Above: 1.3760
---
📉 Plan:
Watch for bearish confirmation (e.g., bearish engulfing, double top, divergence) at resistance before entry.
High RR setup expected if price rejects near 1.3740.
---
🔁 Wait. Confirm. Execute.
🧠 Trade smart, not fast.
📊 More updates coming daily.
USDCAD oversold rally The USDCAD currency pair remains in a bearish technical structure, consistent with the prevailing downtrend. Recent price action suggests sideways consolidation, indicating indecision as the pair pauses before its next directional move.
Key Technical Levels:
Resistance:
1.3700 – Key pivot zone; previously acted as intraday resistance.
1.3740 – Minor resistance.
1.3790 – Stronger resistance zone and potential reversal point.
Support:
1.3566 – Initial downside target on renewed selling pressure.
1.3544 – Intermediate support.
1.3520 – Long-term support and potential demand zone.
Scenario Analysis:
Bearish Case (Favored):
Price is consolidating below the key 1.3700 level. A failure to break above this resistance could trigger a renewed move lower. A bearish rejection from this level may open the path toward 1.3566, then 1.3544 and 1.3520 over a longer timeframe.
Bullish Case (Alternative):
A confirmed breakout and daily close above 1.3700 would invalidate the current bearish setup. This could shift sentiment to bullish and trigger a move toward the next resistance zones at 1.3740 and 1.3790.
Conclusion:
The technical bias for USDCAD remains bearish while price trades below the 1.3700 resistance zone. Traders should watch for a rejection from this level to confirm further downside potential. However, a sustained break above 1.3700 would neutralize the bearish setup and suggest scope for a short-term bullish reversal.
This communication is for informational purposes only and should not be viewed as any form of recommendation as to a particular course of action or as investment advice. It is not intended as an offer or solicitation for the purchase or sale of any financial instrument or as an official confirmation of any transaction. Opinions, estimates and assumptions expressed herein are made as of the date of this communication and are subject to change without notice. This communication has been prepared based upon information, including market prices, data and other information, believed to be reliable; however, Trade Nation does not warrant its completeness or accuracy. All market prices and market data contained in or attached to this communication are indicative and subject to change without notice.
Shorting opportunity on CADFor the safe SL & Higher probability wait for the retracement entry on 15m
Trade at your own risk
Usdcad LongMe and my team caught the buy. Purely smc strategy… inducement, liquidity and oderblock for market execution
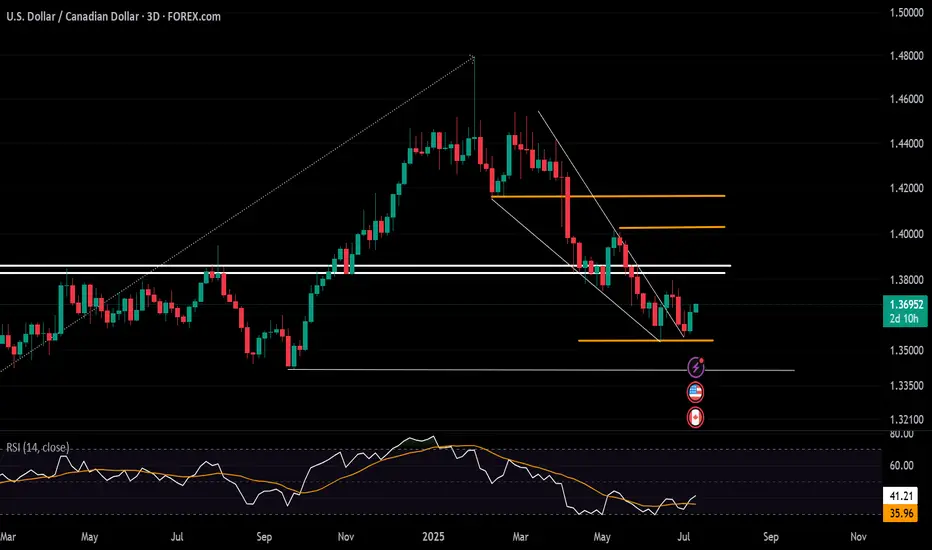
USDCAD Holds Rebound Above 1.36In parallel with the DXY’s rebound from the 96-level, USDCAD has bounced from its 1.35 support zone, coming off oversold conditions last seen in 2021. The pair is also respecting a breakout from the 2025 contracting downtrend pattern.
Key upside levels for the ongoing correction are 1.3830, 1.3860, and 1.40 — aligning with a significant support/resistance zone established in October 2022. However, if 1.36 and 1.3520 are breached to the downside, the bearish trend could resume, with downside levels at 1.34 and 1.32 in focus.
- Written by Razan Hilal, CMT
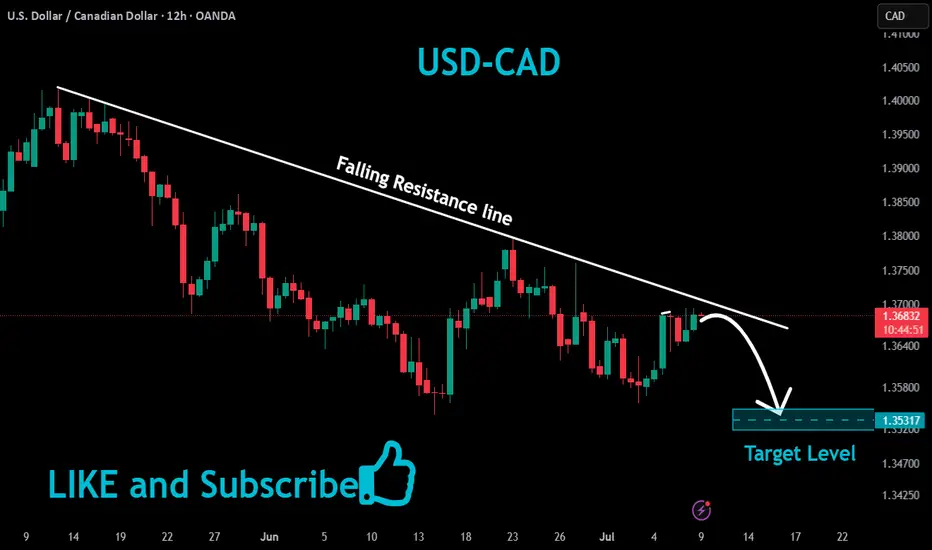
USDCAD Short From Falling Resistance! HI,Traders !
#USDCAD is going up
And will soon hit a falling
Resistance line from where
We will be expecting a
Local bearish pullback
And a move down !
Comment and subscribe to help us grow !
uptrendIt is expected that after some fluctuation and correction, the upward trend will continue. A break and consolidation above the resistance trend line will be a confirmation of the upward trend.
Otherwise, a continuation of the downward trend with a break of the green support range will be possible.
Why I’m Bullish on USD/CAD This Week | Forex Market OutlookIn this video, I break down a potential bullish setup on USD/CAD based purely on technical analysis using support and resistance zones on the 4H and Daily timeframes.
Key Highlights:
Strong price bounce off major support zone
Former resistance flipping into support
Bullish market structure with higher lows forming
My price target: 1.37400
Invalidation zone: 1.35334

A Return to 1:1?As spending heats up considerably with the 5 Trillion USD bill, in my opinion it looks like CAD is set to skyrocket vs the USD once again.
The main driving factors include greater industrialization (worlds biggest nuclear plant, more gold/platinum production than the USA, bigger oil reserves than USA), comparatively less spending, less tariffs, expanding to other countries via exports, and the most untapped resources/land with lowest population of any developed nation in the world.
Personally, for the next 10 years I'll be heavily focusing on Canadian companies if the CAD breaks the trend line

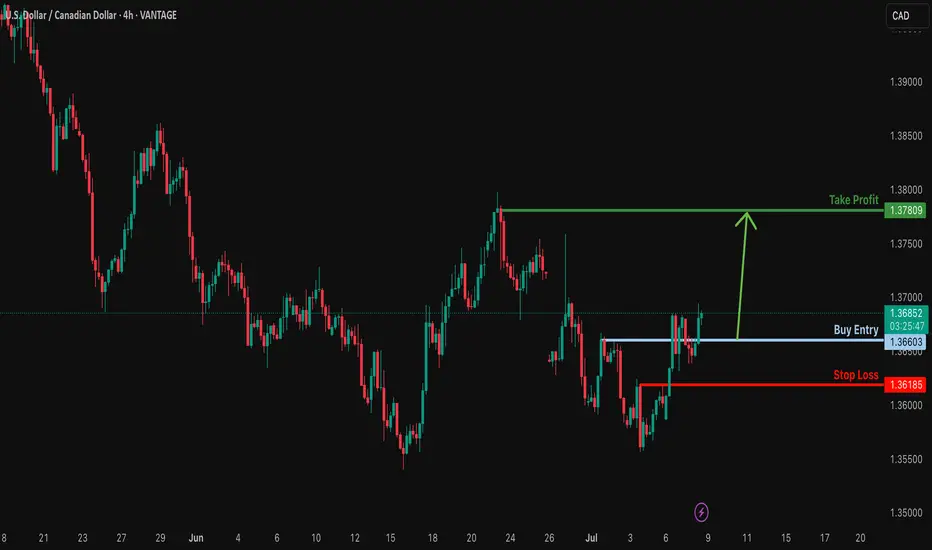
Bullish rise?USD/CAD has bounced off the support level which is a pullback support and could potentially rise from this level to our take profit.
Entry: 1.3660
Why we like it:
There is a a pullback support.
Stop loss: 1.3618
Why we like it:
There is a pullback support.
Take profit: 1.3780
Why we like it:
There is a pullback resistance.
Enjoying your TradingView experience? Review us!
Please be advised that the information presented on TradingView is provided to Vantage (‘Vantage Global Limited’, ‘we’) by a third-party provider (‘Everest Fortune Group’). Please be reminded that you are solely responsible for the trading decisions on your account. There is a very high degree of risk involved in trading. Any information and/or content is intended entirely for research, educational and informational purposes only and does not constitute investment or consultation advice or investment strategy. The information is not tailored to the investment needs of any specific person and therefore does not involve a consideration of any of the investment objectives, financial situation or needs of any viewer that may receive it. Kindly also note that past performance is not a reliable indicator of future results. Actual results may differ materially from those anticipated in forward-looking or past performance statements. We assume no liability as to the accuracy or completeness of any of the information and/or content provided herein and the Company cannot be held responsible for any omission, mistake nor for any loss or damage including without limitation to any loss of profit which may arise from reliance on any information supplied by Everest Fortune Group.
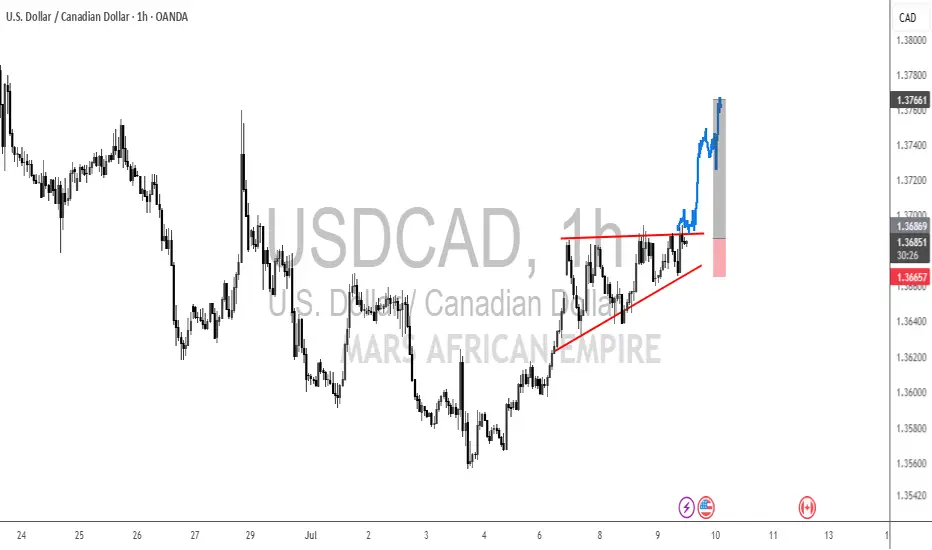
UsdcadUsdcad I was expecting a break and retest and this is the break and retest now we just setandforget