USDCBTC trade ideas

BTC as a leading indicator to financial markets?I woke up this morning and noticed that BTC is down 5%. If we hold at $6900 (or near), will we see financial markets down 5% Monday morning?

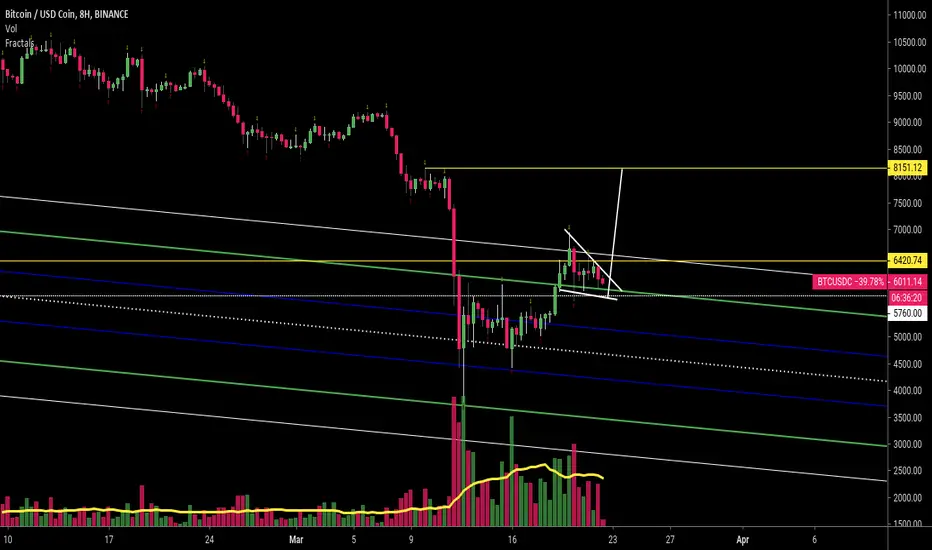
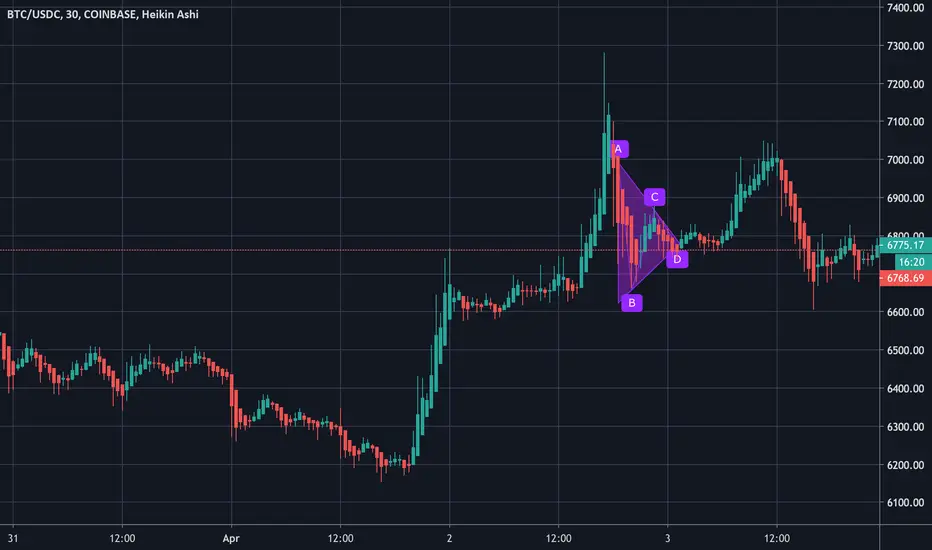
BTC is Easter our gift to long?My last update I speculated a really nice leg up 1:1 of the bottom leg. After doing a little more TA I have concluded the center was a triangle. I'm interested anywhere between 6200 and 6300 hundred. Don't get overly paranoid about the to the .01 cent entry. This is the trade I have been waiting for. Patience.
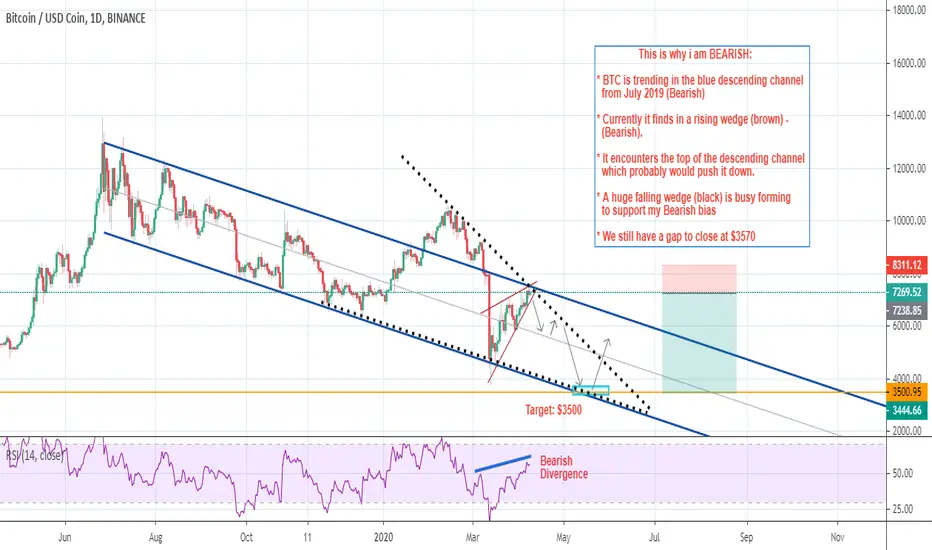
BTCUSD: The road map shows DOWN, DOWN, DOWN ... for now This is why i am BEARISH:
* BTC is trending in the blue descending channel
from July 2019 (Bearish)
* Currently it finds in a rising wedge (brown) -
(Bearish).
* It encounters the top of the descending channel
which probably would push it down.
* A huge falling wedge (black) is busy forming
to support my Bearish bias
* We still have a gap to close at $3570
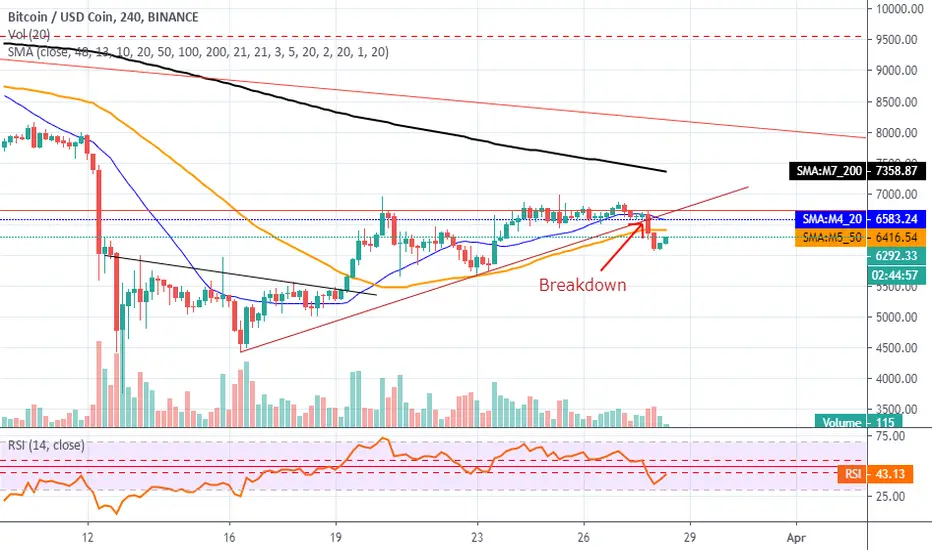
price estimation based on two past behavior, the price may go down to 5 thousand or raise to 8 thousand area.
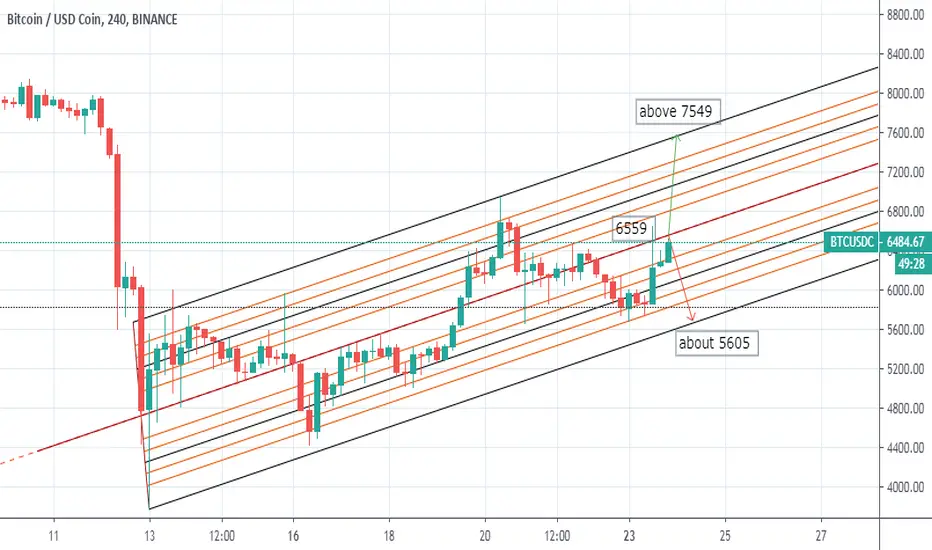
BTC Bullish as F*ck after pullback. Speculation 6300 back to 9500 with an equal 1rst leg added to the top. It's all corrective, but the profits are the same .Take it and go.

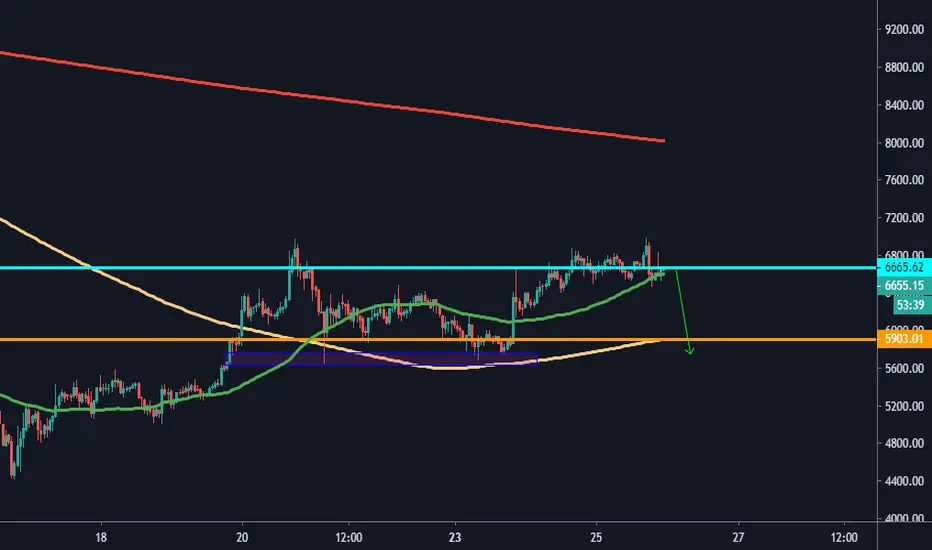
BTC résistance à 7500 - 7800 ??Salut à tous,
Le BTC continue sa croissance, la tendance reste haussière mais une résistance importante se situe entre 7500 et 7800.
La situation reste délicate au vue de la crise économique, je préconise une short à la zone dessinée.
Je garde une stratégie sur le BUY/LONG, je pense qu'une baisse du BTC va se manifester le mois prochain.
Bon trade
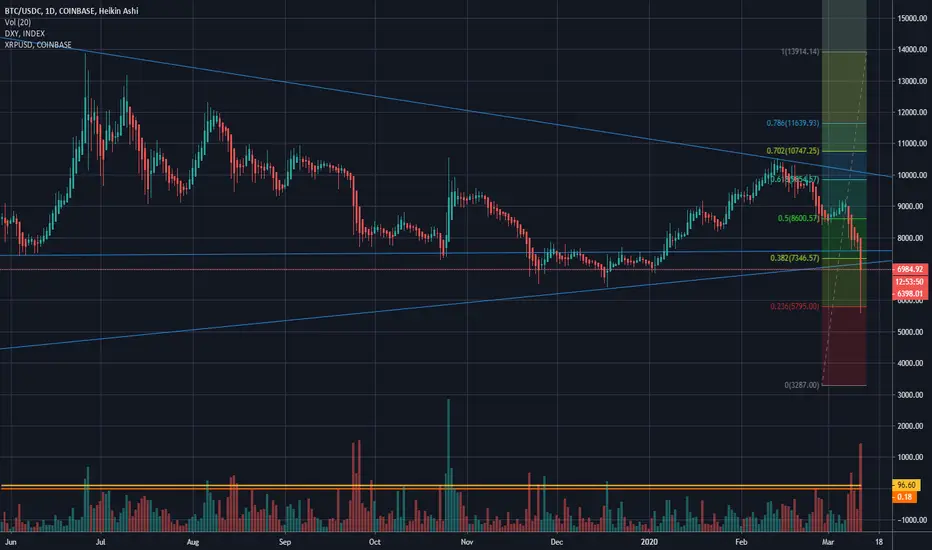
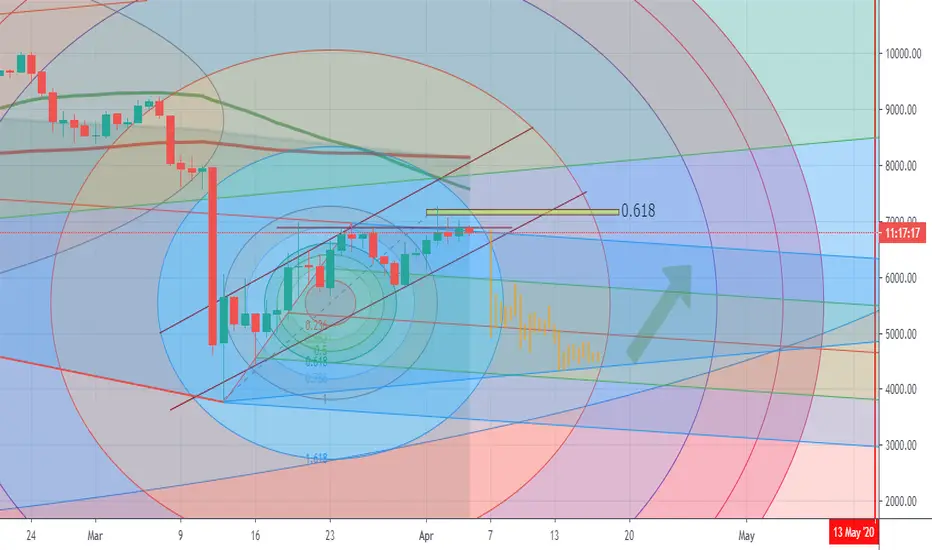
The last low before Bitcoin makes its 2.5/3 year target of $250kLast capitulation point before we correct and move to the upside. I have Pitchforks and Fib Circles on the chart. Understand that this is all speculative and not for certain but from what I am learning as I move forward with this market this is my opinion and future target. Tim Draper continues to be positive on this $250k target.
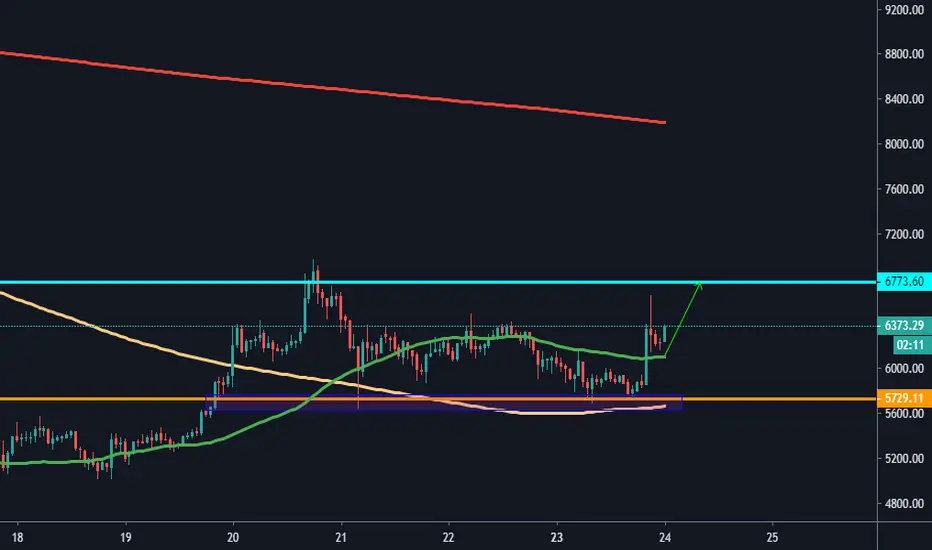
BTC ABOUT TO START ITS NEXT LEG UP 9:00am TARGETS 7.2k 7.4kNice little long for a short day trade or medium hold to see where top goes!!!
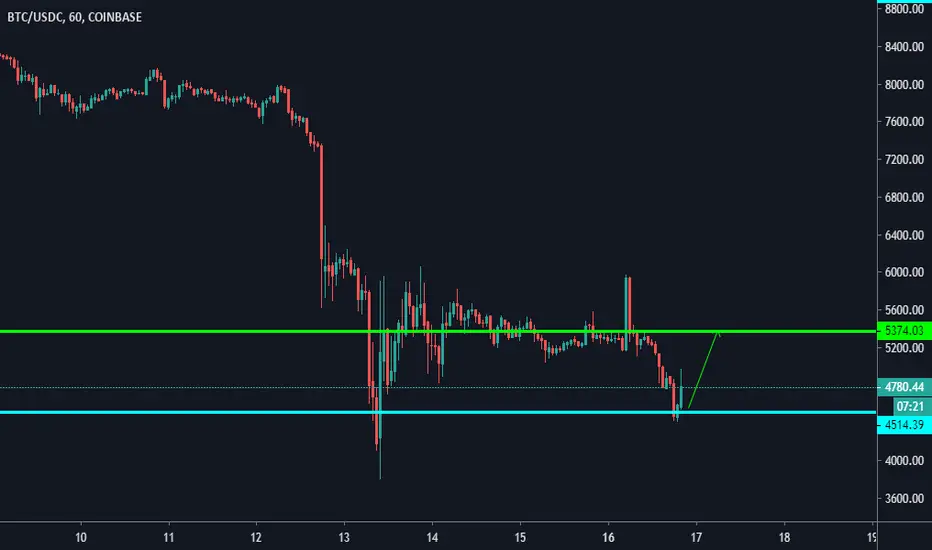
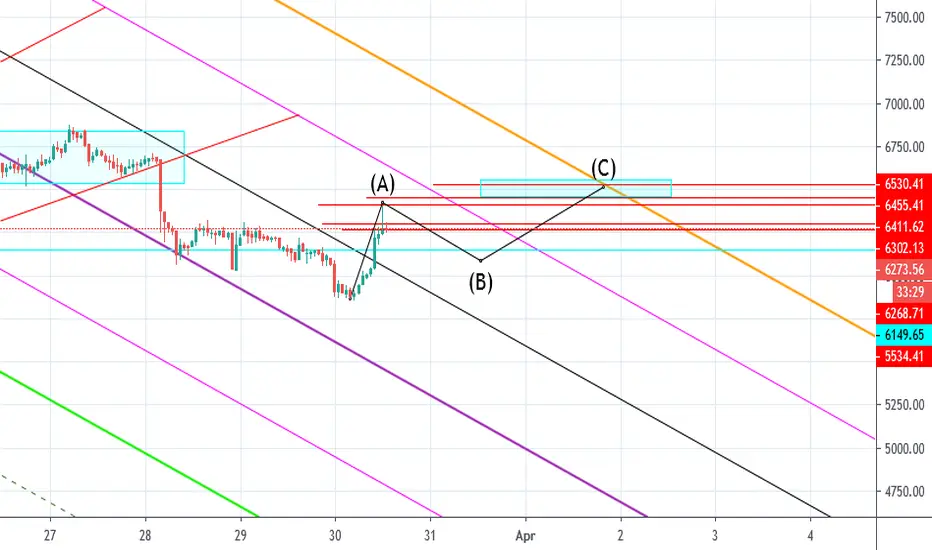
1:1 WXY correction complete. Next wave 3 extension to 5k or 4k?1:1 WXY correction complete with a clear 5 wave count for wave Y and gradual declining volume as bitcoin rises.
4 hour bearish divergence now on the 4H OBV.
If this count plays out, we should be starting wave 3 of 5. If wave 3 is a 1.618 extension of wave 1, I'm expecting this wave to complete somewhere around 5150. A 2.618 extension will see an extension to the 4k region.
Good luck and happy trading!


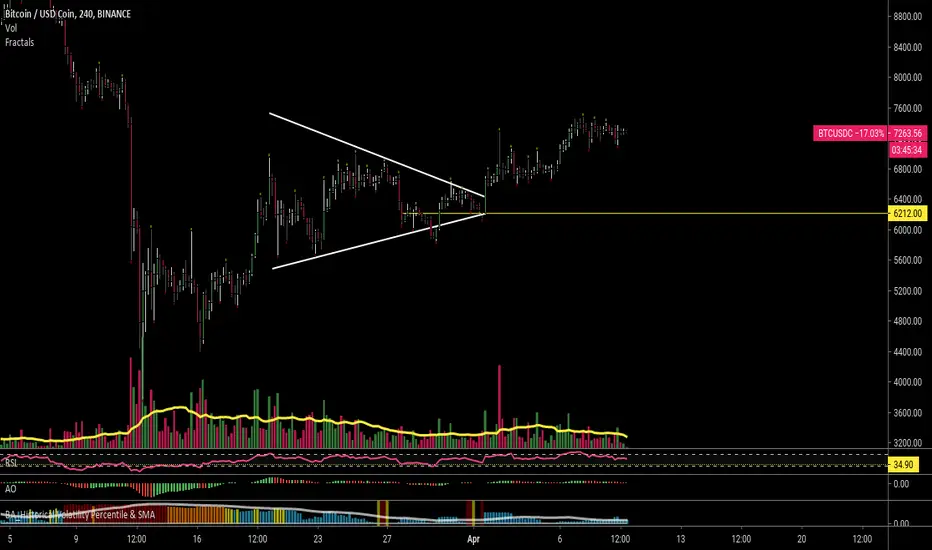
BTC Bullish scenario, but not yet. I got what appears to be a flag forming. That a good continuation structure. Looking for 8k.