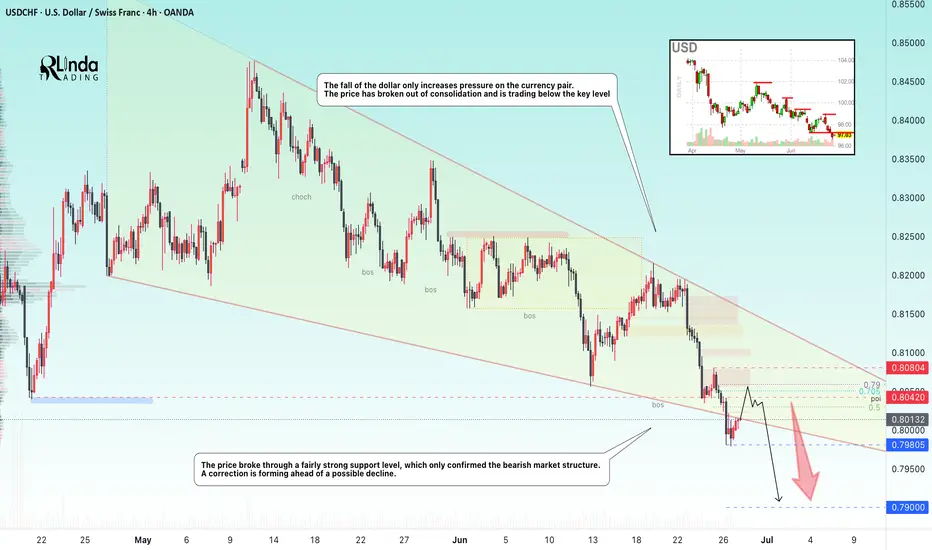
USDCHF → Hunting for liquidity before the fallFX:USDCHF , against the backdrop of the falling dollar and the exit from consolidation, is forming another ‘bos’, which only confirms the market sentiment.
The fall of the dollar only increases pressure on the currency pair. The price has broken out of consolidation and is trading below the key level. USDCHF has broken through a fairly strong support level, which only confirms the bearish market structure. A correction is forming ahead of a possible decline (liquidity capture).
Resistance levels: 0.803, 0.8042
Support levels: 0.798, 0.79
Fundamentally and technically, the currency pair looks weak. The decline may continue after the liquidity capture phase and a retest of resistance. A false breakout of resistance will be a strong signal.
Best regards, R. Linda!
USDCHF trade ideas
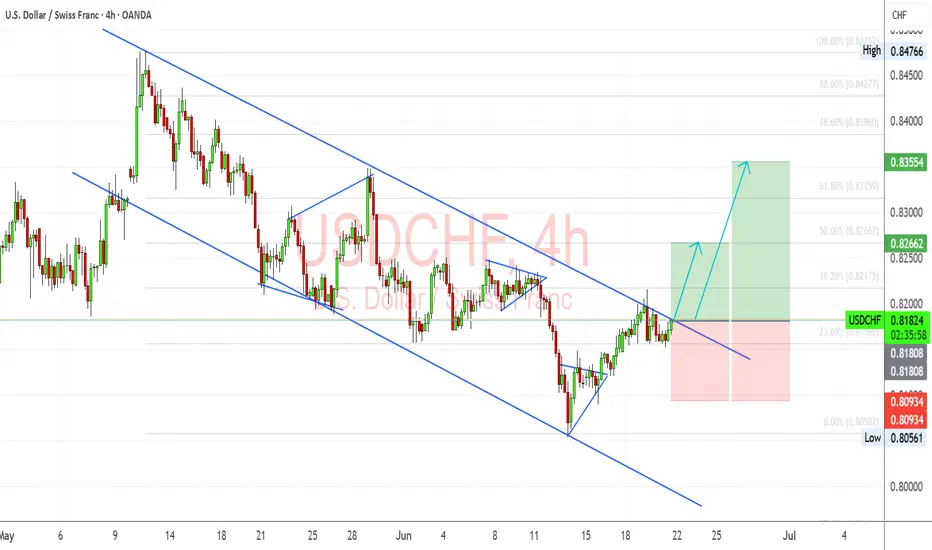
USDCHF Analysis – "Dollar Trying to Break Free from Downtrend"USDCHF is breaking out from a multi-week descending channel.
Structure shows a potential trend reversal from the June 12th low.
First bullish leg may target the 23.6% Fib level at 0.8266, followed by an extended move toward 0.8355.
Key resistance: 0.8266 and 0.8355 (Fib levels)
Stop loss: around 0.8093–0.8056 zone (previous support and breakout base)
Structure Bias: Bullish breakout after prolonged downtrend – confirmation depends on sustained move above 0.8200
📊 Current Bias: Cautiously Bullish
🧩 Key Fundamentals Driving USDCHF
USD Side (Mildly Bearish to Neutral):
FOMC held rates, Dot Plot showed only one cut expected for 2025, but Powell’s tone was less hawkish.
US Retail Sales soft, and PPI/CPI showed signs of inflation cooling.
Recent risk-off sentiment (Middle East, oil spikes, equity volatility) supports the USD.
Trump commentary and 2025 election anticipation bring long-term uncertainty.
CHF Side (Strong but potentially weakening):
SNB held rates steady, with cautious tone—no urgency to hike again.
Safe-haven flows still support CHF, but waning inflation and stronger global equity market might reduce CHF appeal.
SNB has hinted at FX intervention readiness, which could weaken CHF if necessary.
⚠️ Risks That May Reverse or Accelerate Trend
False breakout risk if 0.82 fails to hold → deeper pullback toward 0.8090
Stronger CHF demand on geopolitical fear (Israel–Iran, Ukraine)
Unexpectedly weak US data this week or renewed Fed dovish talk
🗓️ Important News to Watch
US: Core PCE, GDP revision (June 27), jobless claims
CHF: Swiss CPI, SNB FX intervention chatter
Risk sentiment: Iran/Israel tensions, equity volatility, Trump Fed commentary
🏁 Which Asset Might Lead the Broader Move?
USDCHF could mirror sentiment across CHF pairs—if risk-on resumes and CHF weakens across the board (EURCHF, NZDCHF also rallying), USDCHF may accelerate higher.
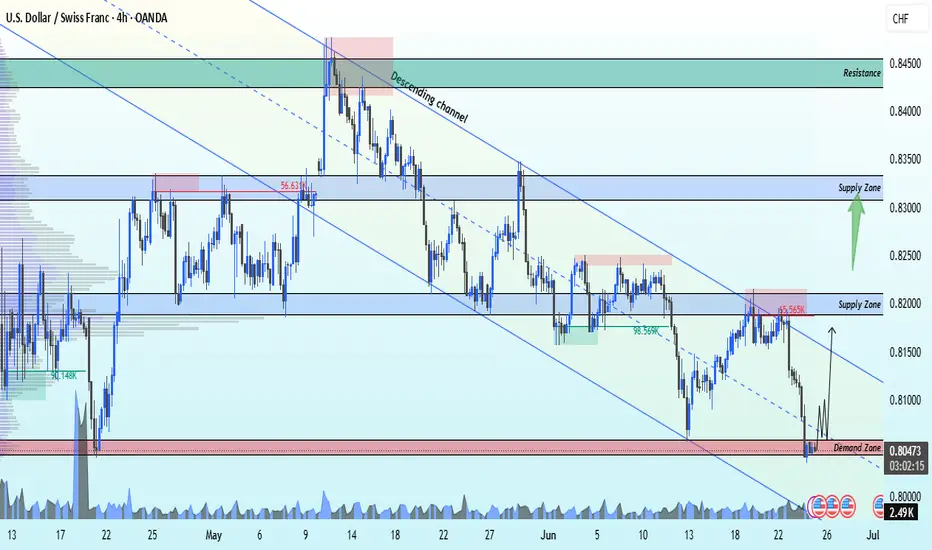
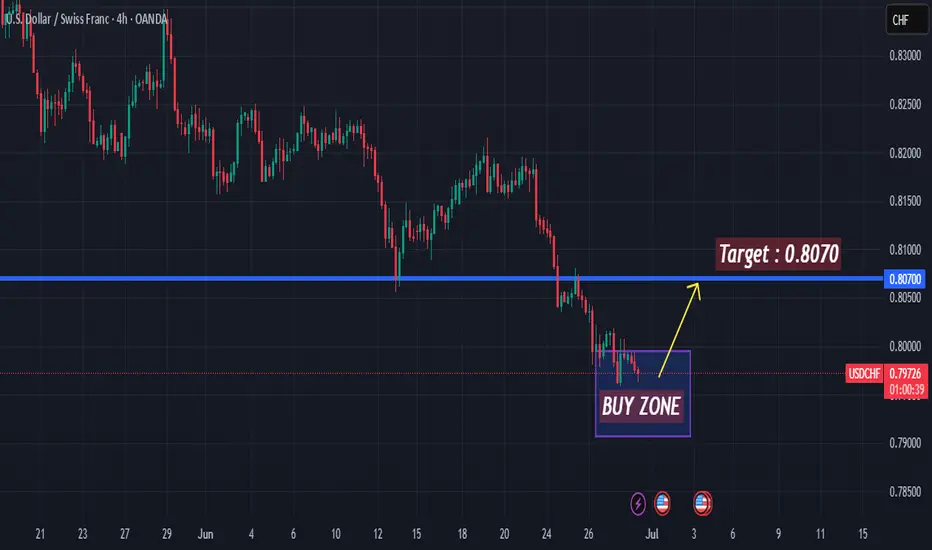
USDCHF Bullish Strong From Key Demand Zone 0.80400📉 USD/CHF Technical Outlook (4H Chart) 📈
The pair has been respecting a descending channel, recently tapping into a key demand zone around 0.80400. Bullish momentum is now building, signaling a potential reversal.
🎯 Upside Technical Targets:
1️⃣ 0.82000 – Initial Supply Zone
2️⃣ 0.83200 – Secondary Supply Zone
3️⃣ 0.84500 – Major Resistance Level
💡 Watch for bullish confirmation signals in the zone before entering. As always, manage your risk.
✨ Like, Follow, Comment, and Join us for more timely updates!
— Livia 😜 | #ForexWithLivia
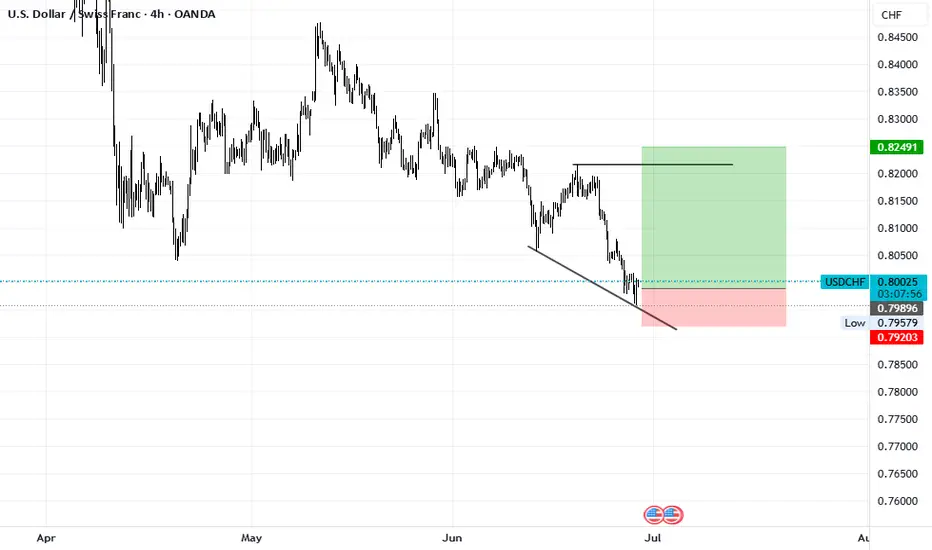
Usdchf long idea Piggybacking on the strong dollar idea as per previous posts. Today's data was positive for the greenback.
I want to see price draw higher into equal highs depicted with green line as an attractive premium liquidity pool.
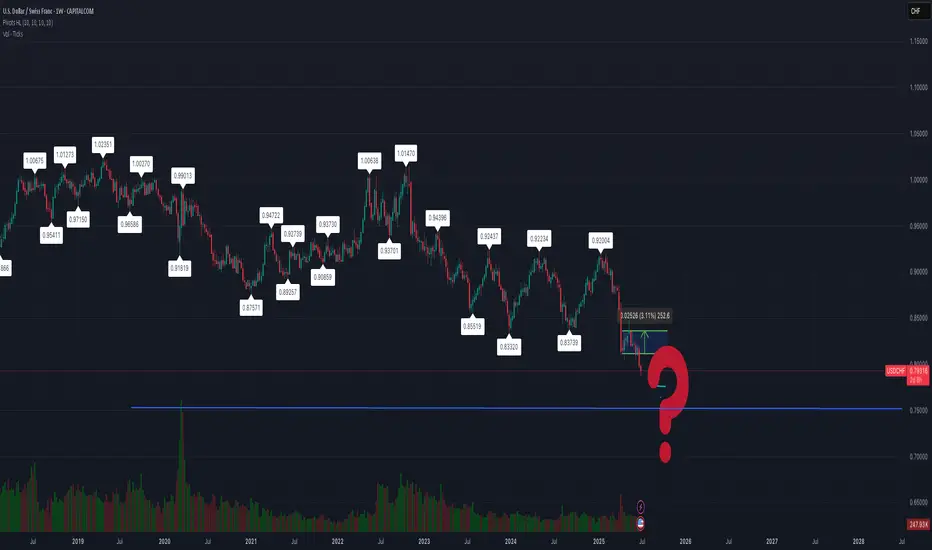
USD/CHF Exchange Rate Falls to Multi-Year LowUSD/CHF Exchange Rate Falls to Multi-Year Low
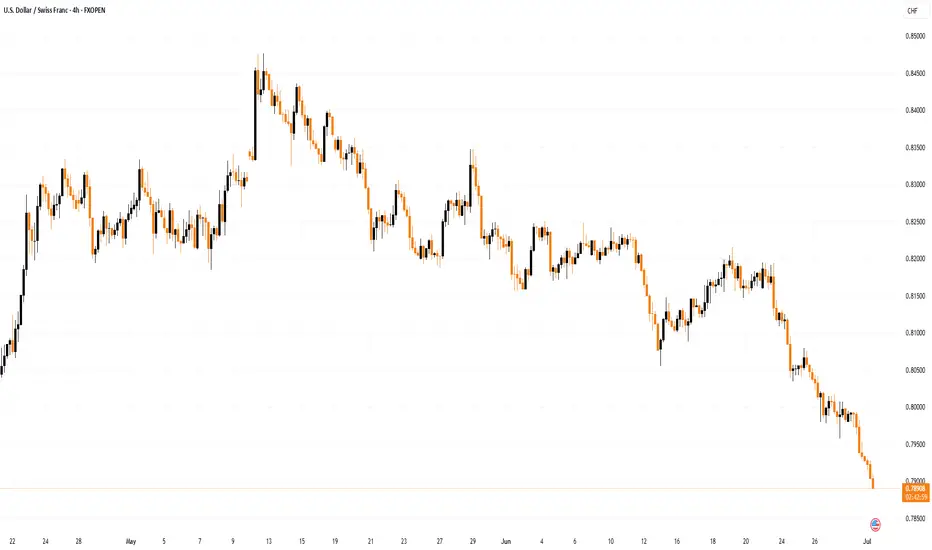
According to the chart, the USD/CHF exchange rate has settled below the key psychological level of 0.8000. The rate hasn’t been this low since the financial crisis of 2008.
On one hand, the drop in USD/CHF is driven by weakness in the US dollar. The US dollar index has fallen to its lowest level in over three years, largely due to the conflicting trade policies pursued by the Trump administration. On the other hand, geopolitical instability has increased the appeal of the Swiss franc as a so-called safe-haven asset.
Technical Analysis of the USD/CHF Chart
Since mid-May, price fluctuations have formed a downward channel (marked in red), and by the end of June the rate had stabilised around the psychological threshold of 0.8000 (indicated by an arrow) — right at the median of the channel.
However, this balance between supply and demand proved temporary, tipping in favour of sellers. As a result, we now see a decline in USD/CHF along a steep trajectory (marked in black), potentially targeting the lower boundary of the red channel — which suggests a possible move down to 0.7800 USD per franc. Along this path, support may come from the 1.618 Fibonacci extension level (0.7875); note how the 0.8055 level previously acted as support (marked with a blue arrow).
The RSI indicator confirms strong selling pressure — but will the bearish trend continue?
Much will depend on the broader fundamental context. As reported by the Wall Street Journal, the sharp strengthening of the franc against the dollar is causing growing concern at the Swiss National Bank (SNB), as an overly strong franc harms Swiss exporters. This suggests that the current market sentiment could shift dramatically if the SNB issues any relevant statements.
This article represents the opinion of the Companies operating under the FXOpen brand only. It is not to be construed as an offer, solicitation, or recommendation with respect to products and services provided by the Companies operating under the FXOpen brand, nor is it to be considered financial advice.
FOREX USD/CHF🥇 CHF The Silent Assassin
While the world screamed about inflation, recession, and banana peels on the geopolitical stage, the Swiss Franc just stood there sipping Rivella and quietly murdered the competition.
+14.10% vs EUR?
+19.34% vs USD?
CHF walked into the forex party, didn’t say anything, and left with everyone’s respect.
🥈 USD – The Gym Bro on a Sugar Crash
Big muscles, loud talk, but oh no, look at those gains over time:
-4.41% vs EUR
-19.34% vs CHF
The USD resembles the guy who used to bench 250 and still talks about it while eating Doritos.
Rate hikes gave it a short-lived boost, but now it's just aired—trillions in debt and a lack of direction.
USD/CHF – Rejection at Key Fib Confluence, Bearish Continuation We’re seeing a beautiful textbook rejection off the 0.79Fib zone (0.8200), precisely where price tapped into a previous structure break and minor supply block. Price surged into the red zone, wicked just above the 200 EMA, and was instantly met with heavy sell-side pressure — a strong signal of institutional distribution.
📌 Technical Confluences at Play:
Price failed to break the 200 EMA cleanly — acting as dynamic resistance.
0.79 Fib levels aligning with prior supply.
Rising wedge structure broken to the downside.
Entry candle printing a solid engulfing rejection — institutional footprint.
📉 Target Zone:
Primary TP sits at the 0.236 Fib level (0.8101), but the full measured move of this wedge gives us a final downside target near 0.8038, with intermediate stops at key Fibs. Invalidation above 0.82294
🧠 Trader’s Insight:
“Patience is power. You don’t chase moves, you position for moments.”
Let the market come to your zone of interest, validate your thesis, and then strike with precision. The best trades come from areas where multiple confirmations stack in your favor.
📉 Trade Plan:
Entry: 0.81933 rejection zone
TP1: 0.8130
TP2: 0.8101
Final TP: 0.8038
SL: Above 0.82294 (tight invalidation)
@WrightWayInvestments
@WrightWayInvestments
@WrightWayInvestments

3 Daily Reversal SignalsIn this video we're taking a look at the OANDA:USDCHF , looking at the idea of this pair being overextended to the bearish side and looking to take advantage of potential bullish relief.
There are 3 main signals that we're looking for in this trading example.
1) The Relative Strength Index (RSI) being extremely oversold (currently around 12)
2) Price action trading completely outside the Keltner Channels
3) A low-test candlestick pattern signaling potential buying pressure.
As I mentioned in the video the actually strategy that this idea is based-on has some very specific parameters, but it is cool to see how and if it could be evolved to work in alternative ways.
If you have any questions, comments or want to share ideas, please do so below.
Akil

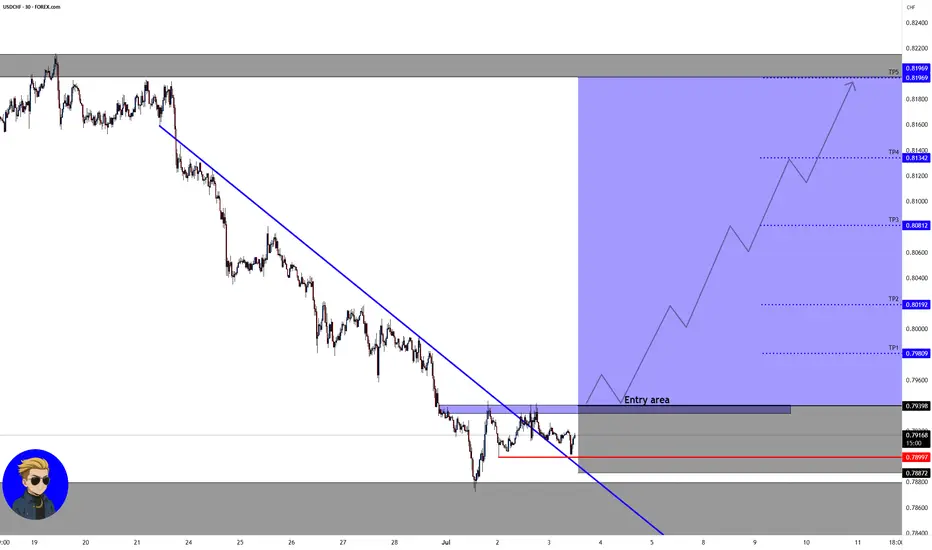
USD/CHF💰Symbol: { USD/CHF }
🟩Price: { 0.79398 }
🟥Stop: { 0.78872 }
1️⃣profit: { 0.79809 }
2️⃣profit: { 0.80192 }
3️⃣profit: { 0.80812 }
4️⃣profit: { 0.81342 }
5️⃣profit: { 0.81969 }
📊Check your chart before entering.
🚨Check before use to make sure there is no important news.🚨
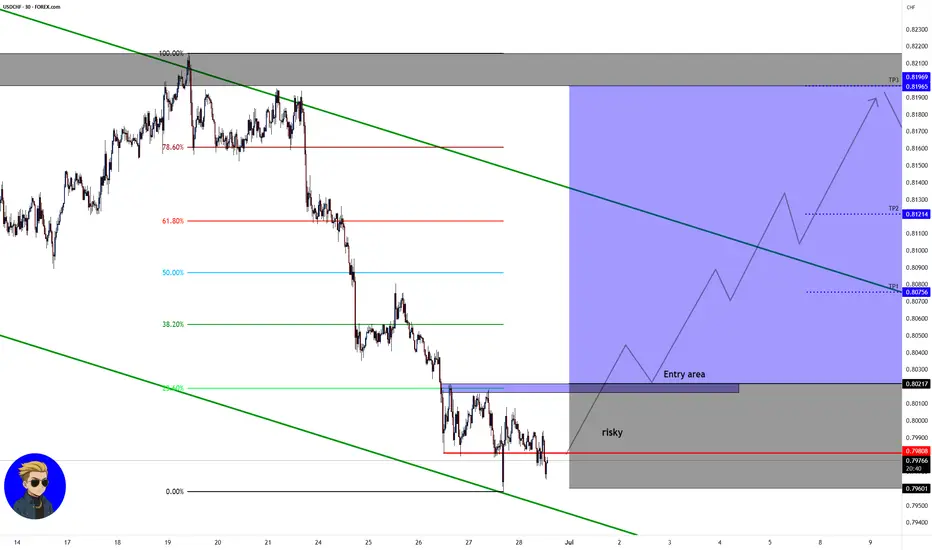
USD/CHF💰Symbol: { USD/CHF }
🟩Price: { 0.80217 }
🟥Stop: { 0.79601 }
1️⃣profit: { 0.80756 }
2️⃣profit: { 0.81214 }
3️⃣profit: { 0.81969 }
📊Check your chart before entering.
🚨Check before use to make sure there is no important news.🚨
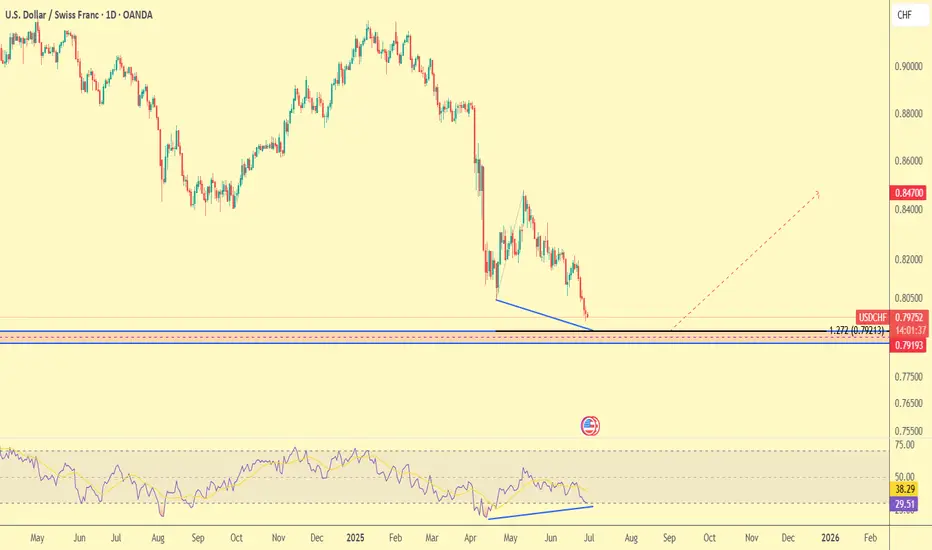
USDCHF-Reversal Coming SoonDear Traders,
📊 Technical Analysis – USD/CHF (Daily Timeframe)
Date: June 30, 2025
🇺🇸 English:
Price is currently testing a strong support zone around the 0.7920 level.
A bullish divergence is visible between price and RSI (price made a lower low while RSI made a higher low), indicating weakening selling pressure and a potential reversal.
The Fibonacci 1.272 extension at 0.79231 aligns with this support zone and may act as a key level for a bounce.
If price reacts positively and breaks above the short-term downtrend, potential upside targets include 0.8200 and 0.8470.
Alternative scenario: If the 0.7920 support fails, there is a risk of a deeper drop and formation of a new lower low.
Summary Signal:
✅ Bullish divergence spotted
📉 Current trend: Bearish
📌 Critical zone: 0.7920 – 0.7930
📈 Potential upside targets: 0.8200 and then 0.8470
Regards,
Alireza!
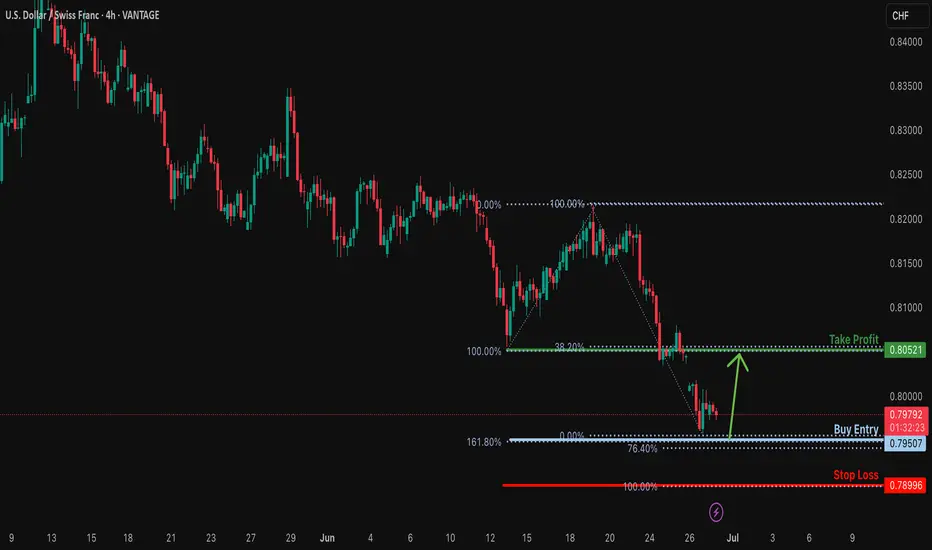
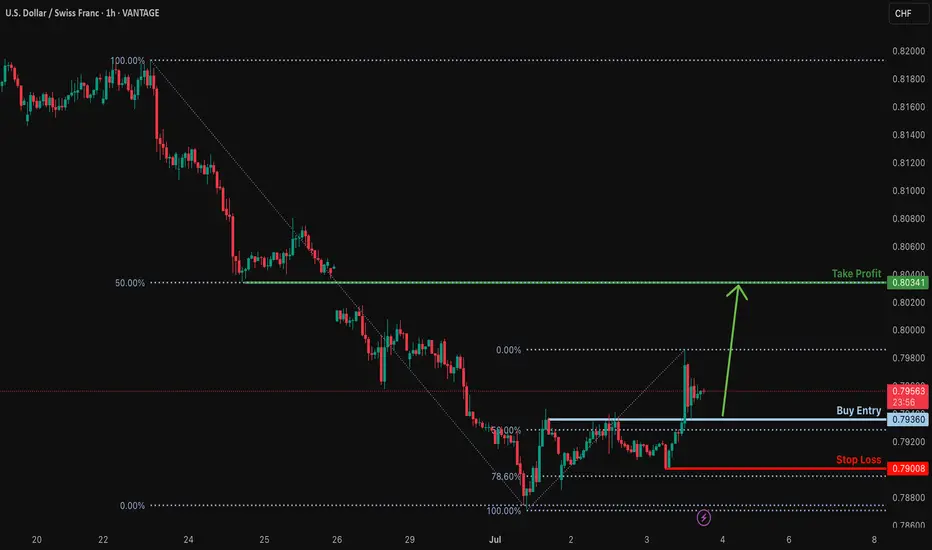
Bullish reversal?USD/CHF is falling towards the support level which aligns with the 161.8% Fibonacci extension and the 78.4% Fibonacci projection and could bounce from this level to our take profit.
Entry: 0.7950
Why we like it:
There is a support level at the 161.8% Fibonacci extension and the 78.4% Fibonacci projection.
Stop loss: 0.7899
Why we like it:
There is a support level at the 100% Fibonacci projection.
Take profit: 0.8052
Why we like it:
Thee is a pullback resistance that lines up with the 38.2% Fibonacci retracement.
Enjoying your TradingView experience? Review us!
Please be advised that the information presented on TradingView is provided to Vantage (‘Vantage Global Limited’, ‘we’) by a third-party provider (‘Everest Fortune Group’). Please be reminded that you are solely responsible for the trading decisions on your account. There is a very high degree of risk involved in trading. Any information and/or content is intended entirely for research, educational and informational purposes only and does not constitute investment or consultation advice or investment strategy. The information is not tailored to the investment needs of any specific person and therefore does not involve a consideration of any of the investment objectives, financial situation or needs of any viewer that may receive it. Kindly also note that past performance is not a reliable indicator of future results. Actual results may differ materially from those anticipated in forward-looking or past performance statements. We assume no liability as to the accuracy or completeness of any of the information and/or content provided herein and the Company cannot be held responsible for any omission, mistake nor for any loss or damage including without limitation to any loss of profit which may arise from reliance on any information supplied by Everest Fortune Group.
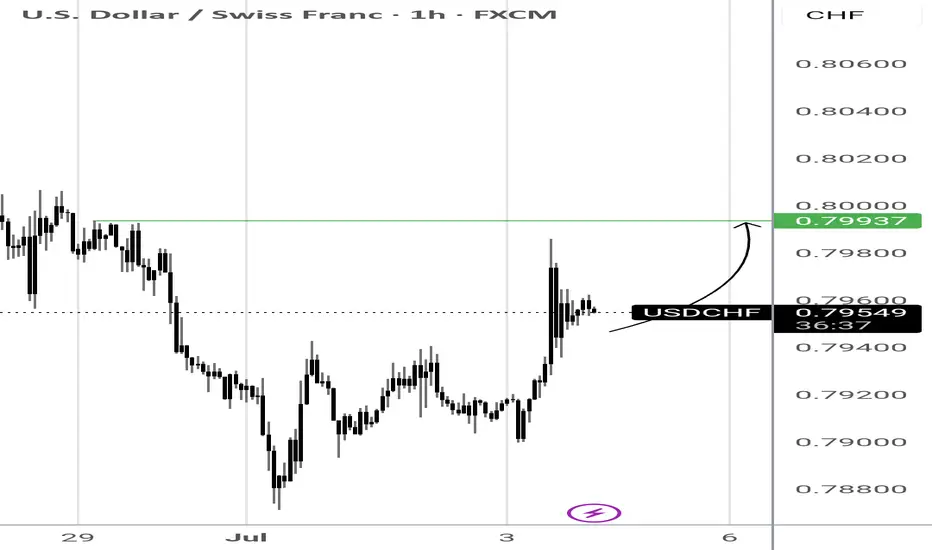
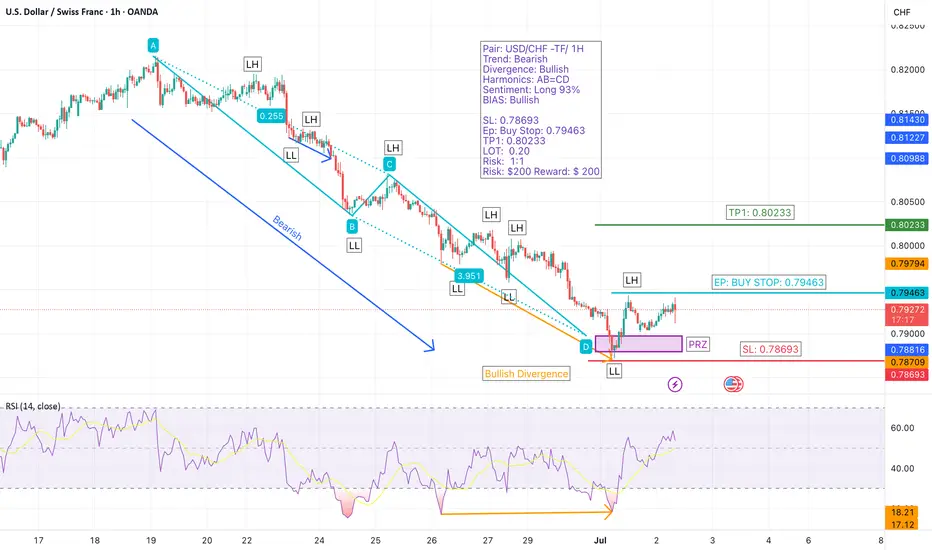
USD/CHF – Bullish Reversal Setup with AB=CD Harmonics (1H TimefrWe’re closely watching USD/CHF, which has been in a bearish trend but is now showing strong signs of a bullish reversal.
A bullish divergence has formed, and the price has reached the Potential Reversal Zone (PRZ) as projected by the AB=CD harmonic pattern. This suggests that the trend may already be reversing.
Additionally, Myfxbook sentiment shows 93% of retail traders are long, reinforcing overall bullish bias. However, for confirmation, we’re waiting for a breakout above the last lower high (LH) to ensure a shift in structure before entering.
🔹 Pair: USD/CHF
🔹 Timeframe: 1H
🔹 Trend: Bearish (reversal expected)
🔹 Divergence: Bullish
🔹 Harmonic Pattern: AB=CD (PRZ hit)
🔹 Sentiment: 93% Long (Myfxbook)
🔹 Bias: Bullish
🔹 Entry (Buy Stop): 0.79463
🔹 Stop Loss: 0.78693
🔹 Take Profit 1: 0.80233
🔹 Lot Size: 0.20
🔹 Risk/Reward: 1:1
🔹 Risk: $200
🔹 Potential Reward: $200
🎯 Strategy: Entry will be triggered only after the breakout of the previous LH, confirming a shift to bullish structure and validating the harmonic reversal.
📌 #USDCHF #ABCDPattern #BullishDivergence #HarmonicTrading #TrendReversal #SmartMoneyMoves #BreakoutSetup #TechnicalAnalysis #PriceAction #ForexSignals #RiskManagement #1HChart #ForexTradeIdeas
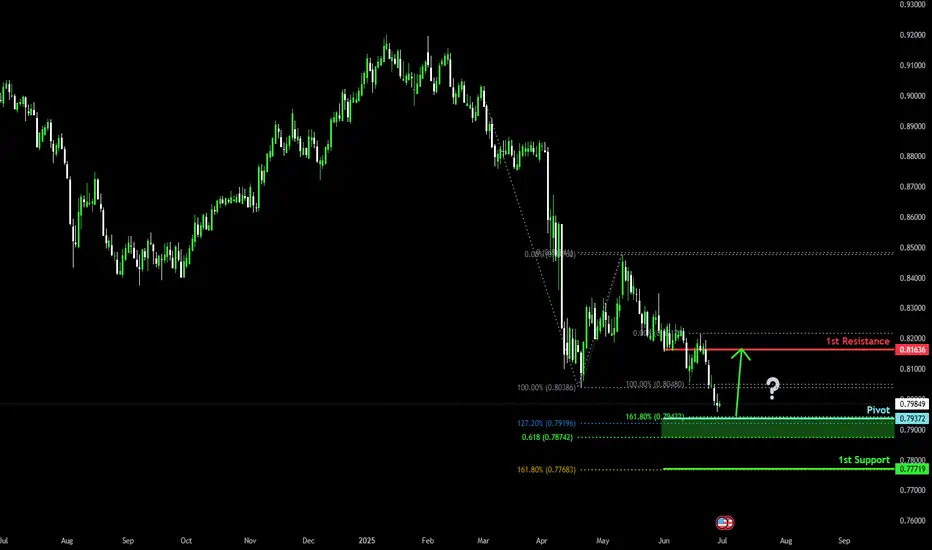
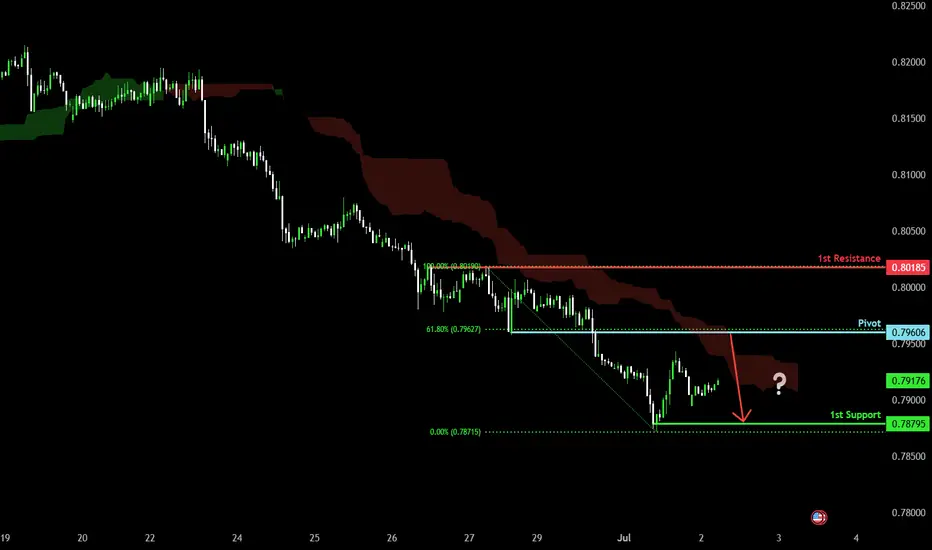
Bullish reversal for the Swissie?The price is falling towards the pivot, which aligns with the Fibonacci confluence and could reverse to the 1st resistance, which is an overlap resistance.
Pivot: 0.7942
1st Support: 0.7771
1st Resistance: 0.8163
Risk Warning:
Trading Forex and CFDs carries a high level of risk to your capital and you should only trade with money you can afford to lose. Trading Forex and CFDs may not be suitable for all investors, so please ensure that you fully understand the risks involved and seek independent advice if necessary.
Disclaimer:
The above opinions given constitute general market commentary, and do not constitute the opinion or advice of IC Markets or any form of personal or investment advice.
Any opinions, news, research, analyses, prices, other information, or links to third-party sites contained on this website are provided on an "as-is" basis, are intended only to be informative, is not an advice nor a recommendation, nor research, or a record of our trading prices, or an offer of, or solicitation for a transaction in any financial instrument and thus should not be treated as such. The information provided does not involve any specific investment objectives, financial situation and needs of any specific person who may receive it. Please be aware, that past performance is not a reliable indicator of future performance and/or results. Past Performance or Forward-looking scenarios based upon the reasonable beliefs of the third-party provider are not a guarantee of future performance. Actual results may differ materially from those anticipated in forward-looking or past performance statements. IC Markets makes no representation or warranty and assumes no liability as to the accuracy or completeness of the information provided, nor any loss arising from any investment based on a recommendation, forecast or any information supplied by any third-party.
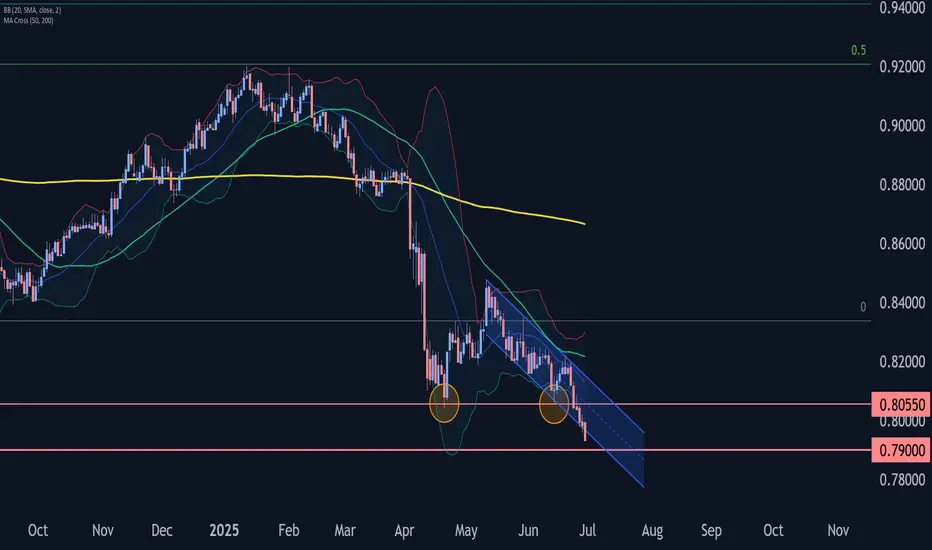
USDCHF Wave Analysis – 30 June 2025
- USDCHF falling inside a minor impulse wave
- Likely to fall to support level 0.7900
USDCHF currency pair is falling strongly inside the minor impulse wave 3, which recently broke the daily down channel from the start of May.
The breakout of this down channel follows the earlier breakout of the key support level 0.8055 (which stopped the previous impulse waves (1) and i).
Given the strong daily downtrend and the continuous outflows from US dollar or risk-on mood, USDCHF currency pair can be expected to fall to the next support level 0.7900, the target price for the completion of the active impulse wave 3.
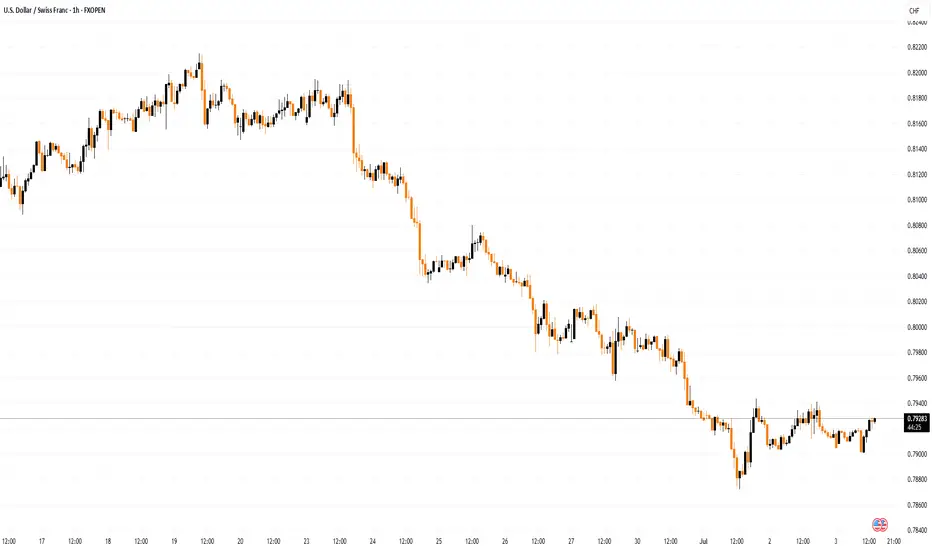
USD/CHF Slips LowerUSD/CHF Slips Lower
USD/CHF declined and now struggling below the 0.8000 resistance.
Important Takeaways for USD/CHF Analysis Today
- USD/CHF declined below the 0.8000 and 0.7950 support levels.
- There is a key bearish trend line forming with resistance near 0.7920 on the hourly chart at FXOpen.
USD/CHF Technical Analysis
On the hourly chart of USD/CHF at FXOpen, the pair started a fresh decline from well above the 0.8080 zone. The US Dollar dropped below the 0.8000 support to move into a negative zone against the Swiss Franc.
The bears pushed the pair below the 50-hour simple moving average and 0.7940. Finally, the bulls appeared near the 0.7870 level. A low was formed near 0.7872 and the pair is now consolidating losses.
There was a minor increase above the 23.6% Fib retracement level of the downward move from the 0.8080 swing high to the 0.7872 low. On the upside, the pair could face resistance near the 0.7920 level. There is also a key bearish trend line forming with resistance near 0.7920.
The next major resistance is near the 0.7940 level, above which the pair could test the 0.7975 level. It is close to the 50% Fib retracement level of the downward move from the 0.8080 swing high to the 0.7872 low.
If there is a clear break above the 0.7975 resistance zone, the pair could start another increase. In the stated case, it could even surpass 0.8030.
On the downside, immediate support on the USD/CHF chart is 0.7870. The first major support is near the 0.7850 level. The next major support is near 0.7800. Any more losses may possibly open the doors for a move toward the 0.7720 level in the coming days.
This article represents the opinion of the Companies operating under the FXOpen brand only. It is not to be construed as an offer, solicitation, or recommendation with respect to products and services provided by the Companies operating under the FXOpen brand, nor is it to be considered financial advice.
Bullish bounce off pullback support?USD/CHF is falling towards the support level which is a pullback support that lines up with the 50% Fibonacci retracement and could bounce from this level to our take profit.
Entry: 0.7936
Why we like it:
There is a pullback support level that lines up with the 50% Fibonacci retracement.
Stop loss: 0.7900
Why we like it:
There is a pullback support level that aligns with the 78.6% Fibonacci retracement.
Take profit: 0.8034
Why we like it:
There is a pullback resistance level that aligns with the 50% Fibonacci retracement.
Enjoying your TradingView experience? Review us!
Please be advised that the information presented on TradingView is provided to Vantage (‘Vantage Global Limited’, ‘we’) by a third-party provider (‘Everest Fortune Group’). Please be reminded that you are solely responsible for the trading decisions on your account. There is a very high degree of risk involved in trading. Any information and/or content is intended entirely for research, educational and informational purposes only and does not constitute investment or consultation advice or investment strategy. The information is not tailored to the investment needs of any specific person and therefore does not involve a consideration of any of the investment objectives, financial situation or needs of any viewer that may receive it. Kindly also note that past performance is not a reliable indicator of future results. Actual results may differ materially from those anticipated in forward-looking or past performance statements. We assume no liability as to the accuracy or completeness of any of the information and/or content provided herein and the Company cannot be held responsible for any omission, mistake nor for any loss or damage including without limitation to any loss of profit which may arise from reliance on any information supplied by Everest Fortune Group.
Bearish continuation?The Swissie (USD/CHF) is rising towards the pivot, which has been identified as a pullback resistance and could reverse to the 1st support.
Pivot: 0.7960
1st Support: 0.7879
1st Resistance: 0.8018
Risk Warning:
Trading Forex and CFDs carries a high level of risk to your capital and you should only trade with money you can afford to lose. Trading Forex and CFDs may not be suitable for all investors, so please ensure that you fully understand the risks involved and seek independent advice if necessary.
Disclaimer:
The above opinions given constitute general market commentary, and do not constitute the opinion or advice of IC Markets or any form of personal or investment advice.
Any opinions, news, research, analyses, prices, other information, or links to third-party sites contained on this website are provided on an "as-is" basis, are intended only to be informative, is not an advice nor a recommendation, nor research, or a record of our trading prices, or an offer of, or solicitation for a transaction in any financial instrument and thus should not be treated as such. The information provided does not involve any specific investment objectives, financial situation and needs of any specific person who may receive it. Please be aware, that past performance is not a reliable indicator of future performance and/or results. Past Performance or Forward-looking scenarios based upon the reasonable beliefs of the third-party provider are not a guarantee of future performance. Actual results may differ materially from those anticipated in forward-looking or past performance statements. IC Markets makes no representation or warranty and assumes no liability as to the accuracy or completeness of the information provided, nor any loss arising from any investment based on a recommendation, forecast or any information supplied by any third-party.
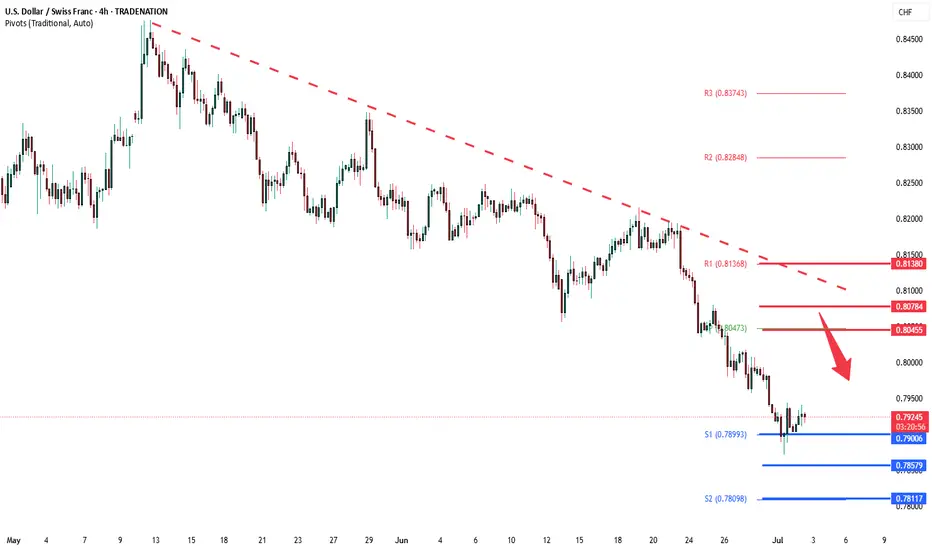
USDCHF oversold bounce backs capped at 0.8045The USD/CHF pair is currently trading with a bearish bias, aligned with the broader downward trend. Recent price action shows a retest of the falling resistance, suggesting a temporary relief rally within the downtrend.
Key resistance is located at 0.8045, a prior consolidation zone. This level will be critical in determining the next directional move.
A bearish rejection from 0.8045 could confirm the resumption of the downtrend, targeting the next support levels at 0.7900, followed by 0.7860 and 0.7810 over a longer timeframe.
Conversely, a decisive breakout and daily close above 0.8045 would invalidate the current bearish setup, shifting sentiment to bullish and potentially triggering a move towards 0.8080, then 0.8140.
Conclusion:
The short-term outlook remains bearish unless the pair breaks and holds above 0.8045. Traders should watch for price action signals around this key level to confirm direction. A rejection favours fresh downside continuation, while a breakout signals a potential trend reversal or deeper correction.
This communication is for informational purposes only and should not be viewed as any form of recommendation as to a particular course of action or as investment advice. It is not intended as an offer or solicitation for the purchase or sale of any financial instrument or as an official confirmation of any transaction. Opinions, estimates and assumptions expressed herein are made as of the date of this communication and are subject to change without notice. This communication has been prepared based upon information, including market prices, data and other information, believed to be reliable; however, Trade Nation does not warrant its completeness or accuracy. All market prices and market data contained in or attached to this communication are indicative and subject to change without notice.
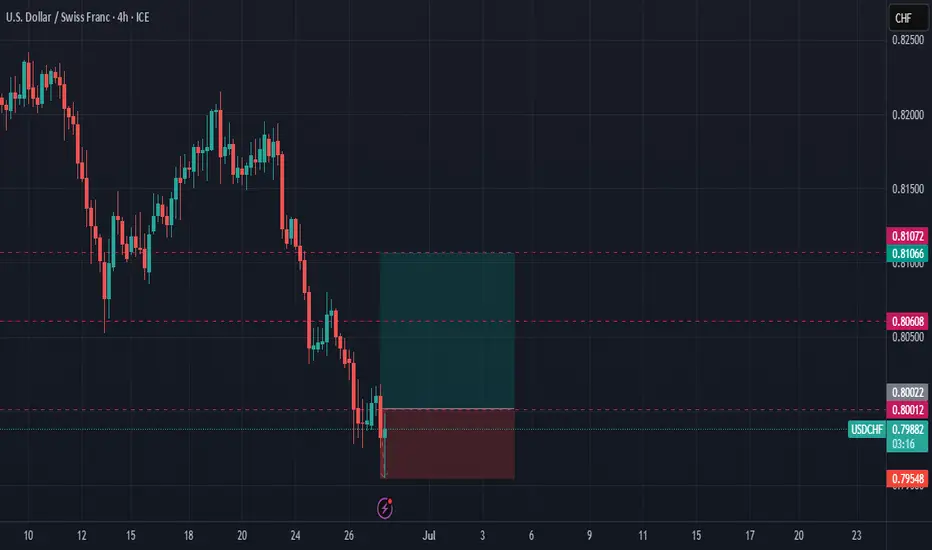
if current candle closes as bullish, long usdchfif current 4hr candle closes (in 5mins) as bullish, usdchf should keep going up until at least the close of today, it's likely bullishness may continue for some time should it stay that case. personally, i would wait for price to cross the 0.8 before i join in. STAY OUT IF 0.8 isnt crossed in the next hour
USDCHF LONG FORECAST Q2 W26 D26 Y25USDCHF LONG FORECAST Q2 W26 D26 Y25
Professional Risk Managers👋
HTF BOS REQUIRED
Welcome back to another FRGNT chart update📈
Diving into some Forex setups using predominantly higher time frame order blocks alongside confirmation breaks of structure.
Let’s see what price action is telling us today!
💡Here are some trade confluences📝
✅Daily order block
✅Weekly order block
✅Intraday breaks of structure Required
✅4H Order block
🔑 Remember, to participate in trading comes always with a degree of risk, therefore as professional risk managers it remains vital that we stick to our risk management plan as well as our trading strategies.
📈The rest, we leave to the balance of probabilities.
💡Fail to plan. Plan to fail.
🏆It has always been that simple.
❤️Good luck with your trading journey, I shall see you at the very top.
🎯Trade consistent, FRGNT X
