USDCHFHello Traders! 👋
What are your thoughts on USDCHF?
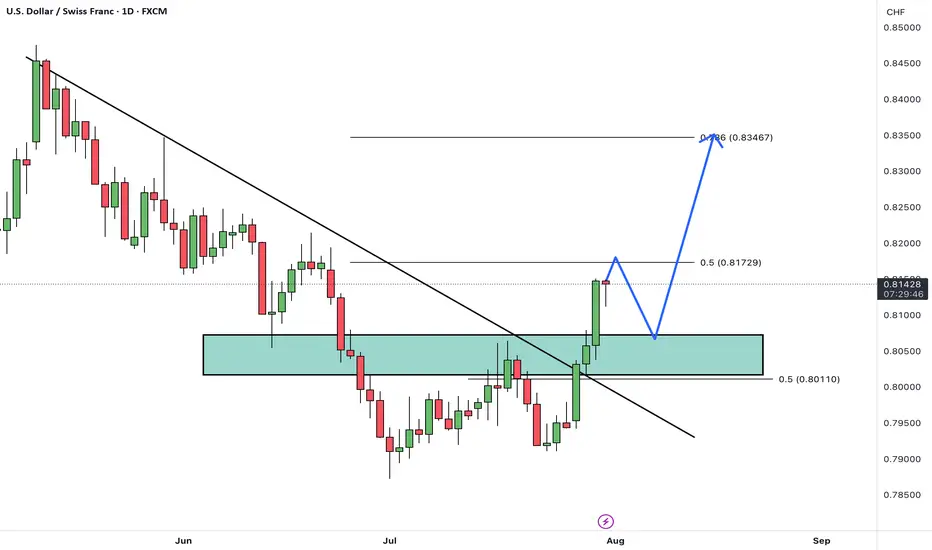
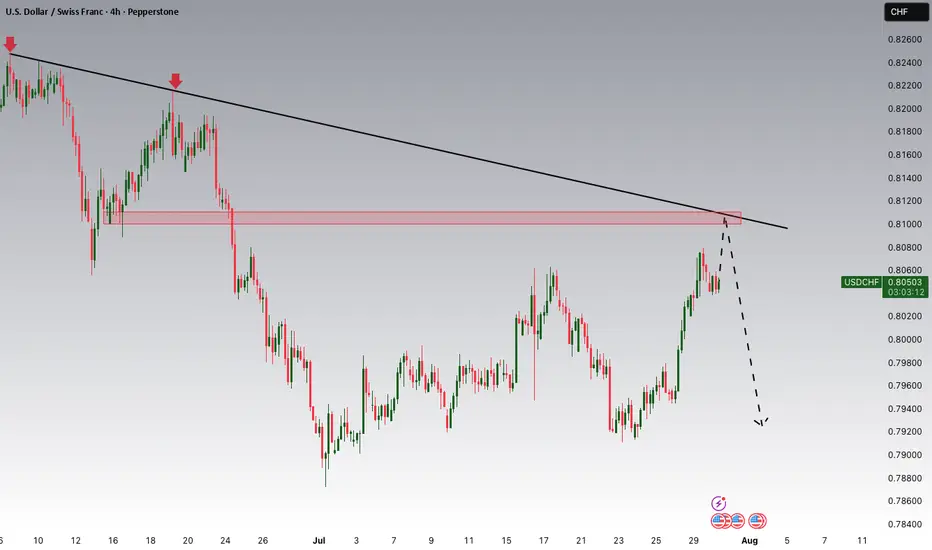
USD/CHF has broken above its descending trendline and cleared a resistance zone, signaling a potential trend reversal and growing bullish momentum.
After some minor consolidation and a pullback to the breakout zone, we expect the pair to continue its rally toward the next identified targets.
The broken resistance now acts as new support, and as long as price remains above this area, the bullish outlook remains valid.
Is USD/CHF ready to extend higher toward its next targets? Share your view below! 🤔👇
Don’t forget to like and share your thoughts in the comments! ❤️
USDCHF trade ideas
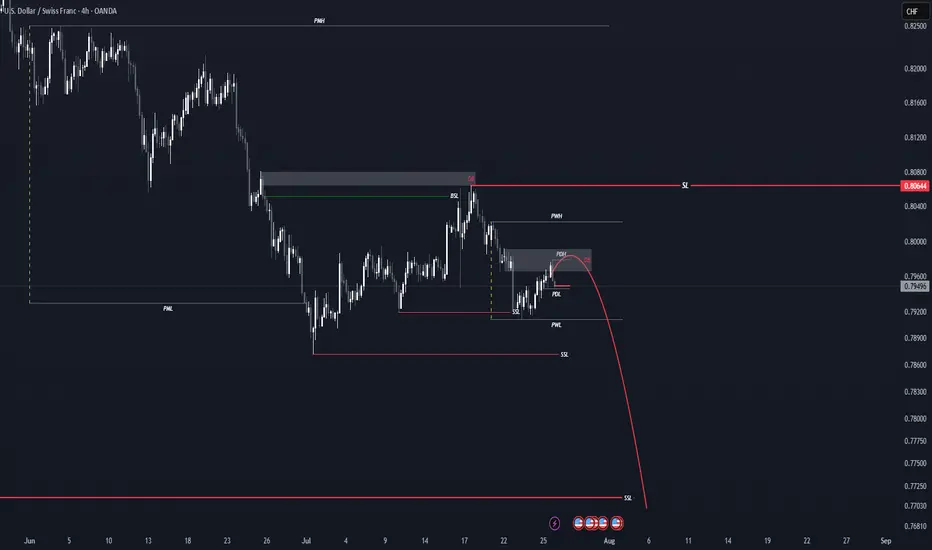
USDCHFHello Trader
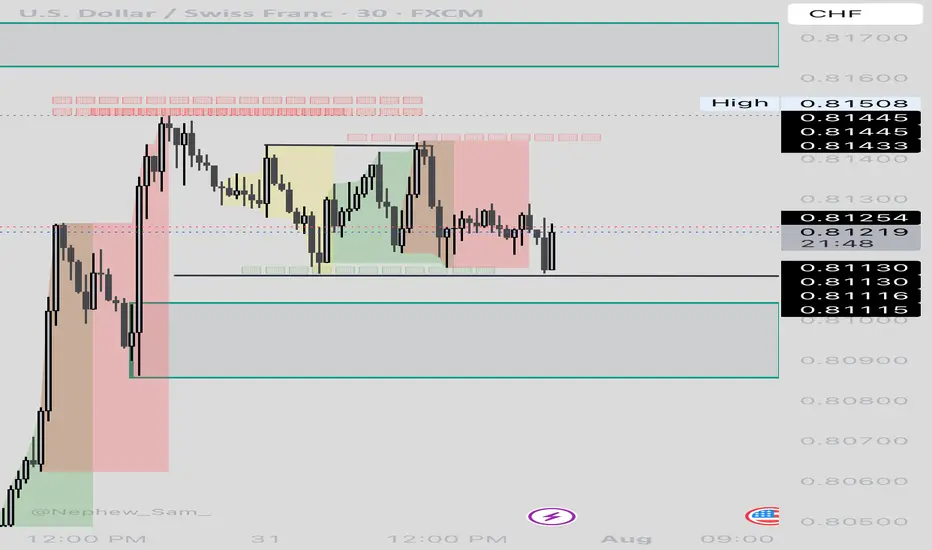
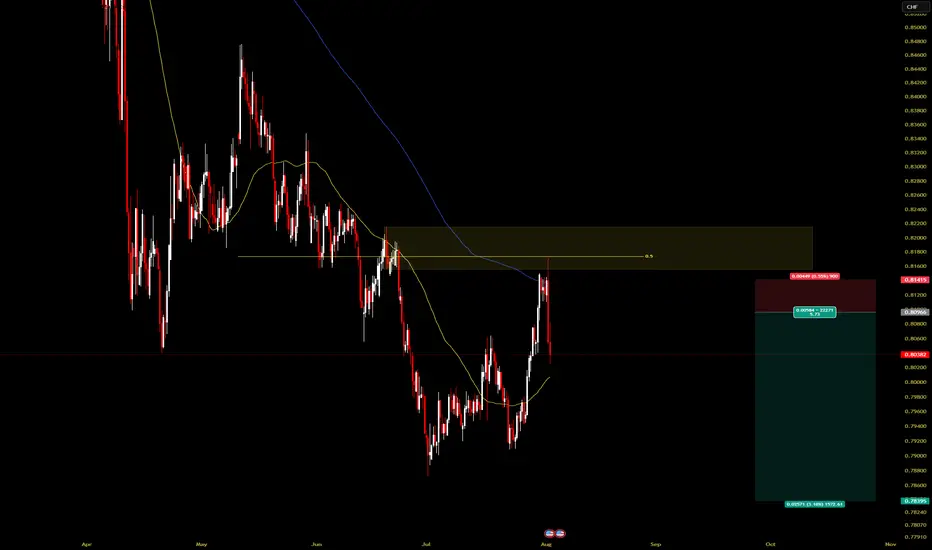
I expect the price to start falling from these areas 🩸
The stop of this scenario is also visible in the image above❌
I hope you make the most of it...
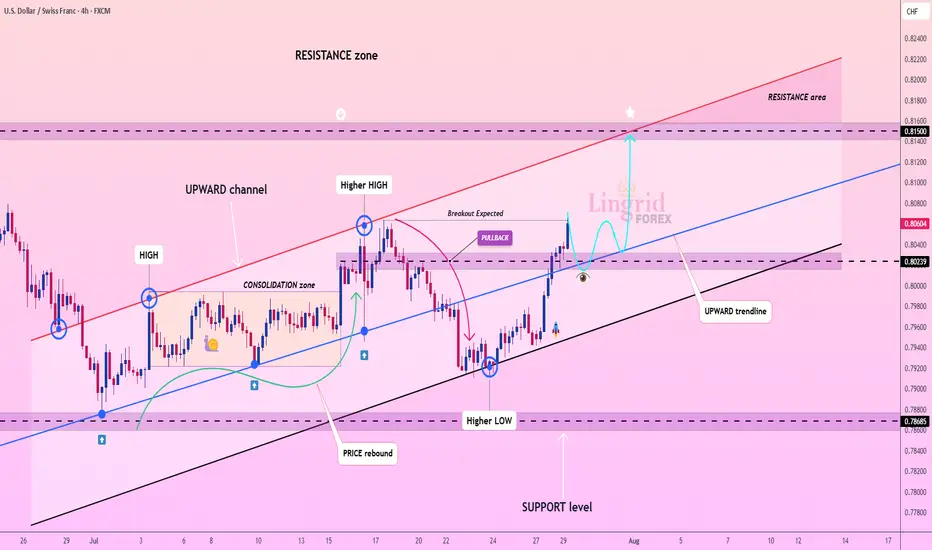
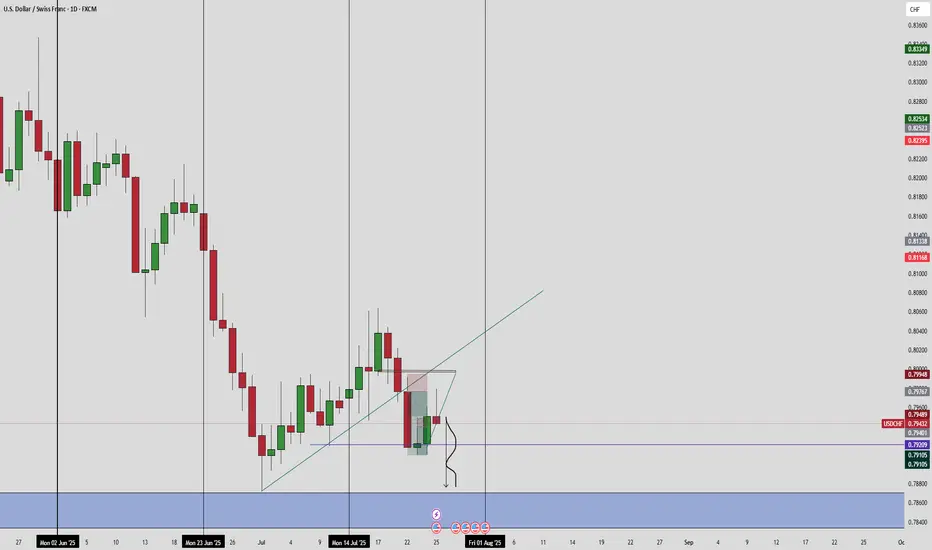
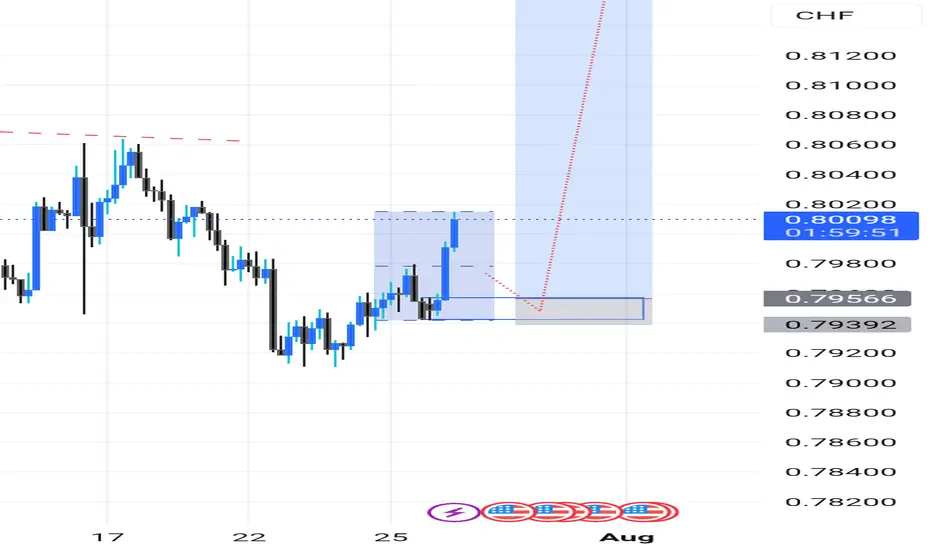
Lingrid | USDCHF Potential Bullish Move Following Level BreakoutFX:USDCHF surged from a higher low and is now retesting the broken structure near 0.802, maintaining its position within the broader upward channel. A clean bounce from this zone would confirm the bullish structure, targeting the upper channel resistance near 0.815. Pullback and higher low structure support continued upside movement with short-term consolidation possible. A breakout from the consolidation box could accelerate momentum toward the resistance area.
📈 Key Levels
Buy zone: 0.802 – 0.805
Buy trigger: Bullish confirmation above 0.805
Target: 0.815
Invalidation: Drop below 0.796
💡 Risks
False breakout near 0.805 may lead to rejection
Failure to form higher high would invalidate bullish sequence
Momentum divergence could slow rally near resistance
If this idea resonates with you or you have your own opinion, traders, hit the comments. I’m excited to read your thoughts!
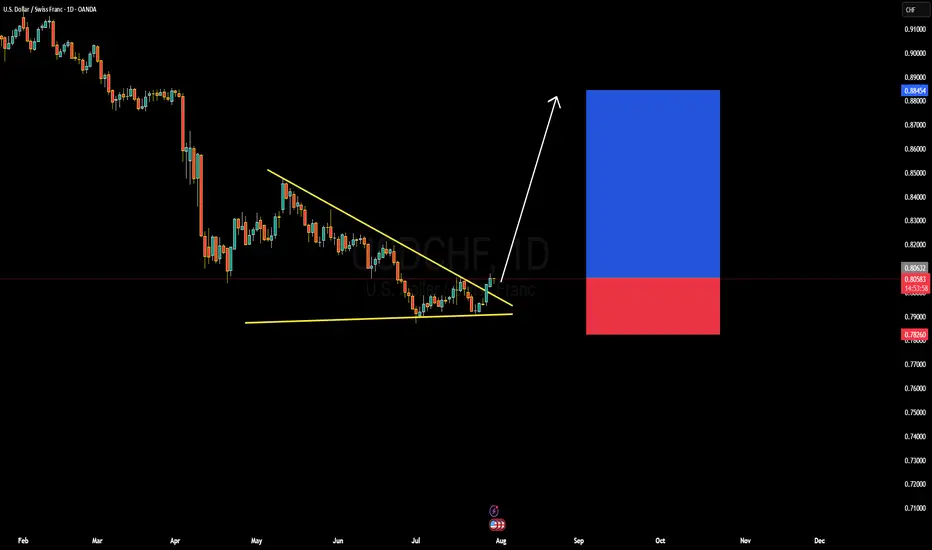
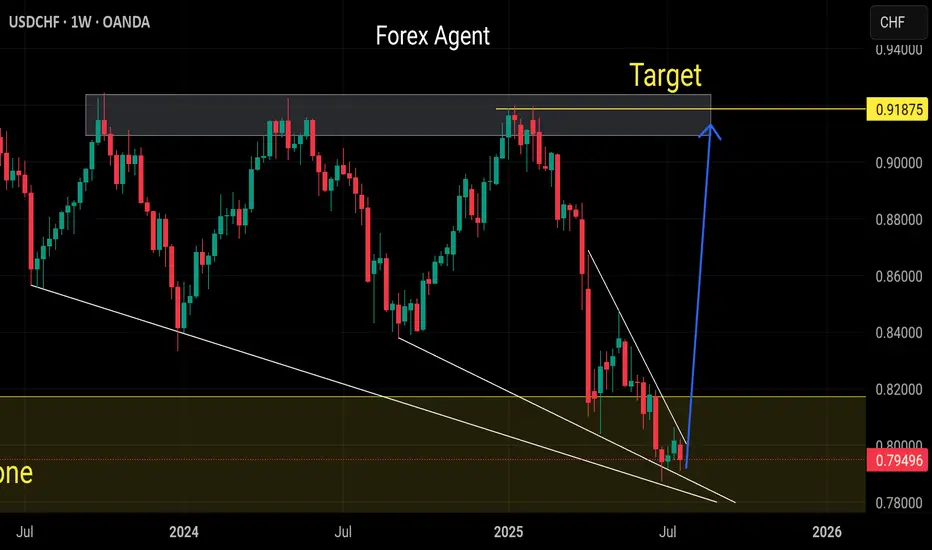
USDCHF Forming Falling WedgeUSDCHF has recently broken out of a falling wedge pattern on the daily timeframe, which is typically a bullish reversal signal. After an extended period of compression and lower highs, the pair has pierced above the descending trendline with strong bullish momentum. This breakout indicates a shift in sentiment, and we are now seeing early signs of a potential trend reversal to the upside. The structure suggests the market could target higher levels, with immediate resistance near the 0.8200–0.8300 zone and extended upside potential toward 0.8800.
From a macro perspective, the US dollar is gaining traction again, supported by firm US GDP growth and persistent inflation pressures, which keep the Federal Reserve in a cautious stance. Investors are now reassessing rate cut expectations, with Fed officials emphasizing data-dependency. On the other hand, the Swiss franc is seeing slight weakness as the Swiss National Bank remains dovish compared to other central banks. The widening monetary policy divergence favors dollar strength in the short to medium term.
Technically, the breakout above the wedge confirms buyer dominance, and with the RSI and MACD turning bullish, momentum favors continuation to the upside. The risk-to-reward remains attractive with a tight invalidation level below the recent lows around 0.7820. Price action traders may consider entering on minor pullbacks toward the breakout zone, with eyes on retesting the previous swing highs.
Overall, USDCHF presents a clean bullish setup following the breakout of a falling wedge pattern. With solid confluence from both technical and fundamental angles, this pair is poised for further gains in the coming sessions. Patience and confirmation remain key, but the structure supports a long bias for those aligned with momentum
USDCHF Potential DownsidesHey Traders, in today's trading session we are monitoring USDCHF for a selling opportunity around 0.81000 zone, USDCHF is trading in a downtrend and currently is in a correction phase in which it is approaching the trend at 0.81000 support and resistance area.
Trade safe, Joe.
BullishWaiting for price to sweep previous daily low the tap in the demand zone higher timeframe is bullish fotsi looking strong let’s see bois
USDCHF CLEAR BEARISH WEEKLY OBJECTIVEUSD/CHF is showing clear bearish sentiment heading into the early part of the week. The pair exhibits signs of a potential sharp decline, with momentum favoring the downside. Traders should keep a close watch on this pair for possible breakdown opportunities throughout the week.
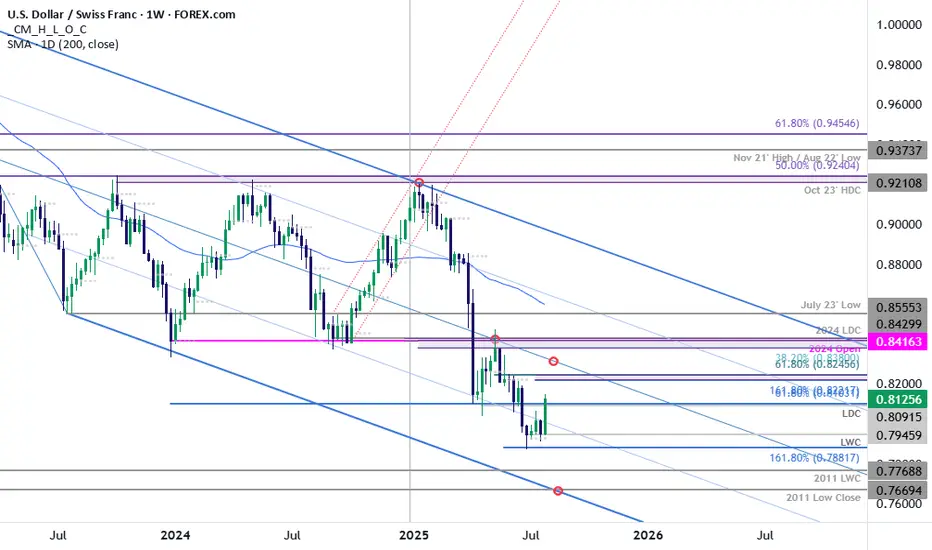
USD/CHF Rally Threatens ReversalThe July opening range broke to the topside on the heels of yesterday’s FOMC rate decision and takes USD/CHF back above the 25% parallel- a weekly close back above the April lows at 8040 tomorrow would suggest a more significant low is in place / a larger reversal is underway. Look for initial support near 8103 today for guidance.
Initial topside resistance objectives eyed at the 1.618% extension of the monthly advance and the 61.8% retracement of the May decline at 8222/46 backed by the median line, currently near the 83-handle. Key lateral resistance stands at 8380-8416- a region defined by the 38.2% retracement of the yearly range, the 2024 low-close, the 2023 low-week close (LWC) and the 2024 yearly open (an area of interest for possible topside exhaustion / price inflection IF reached).
Support rests at the yearly LWC at 7946 with a break / close below 7881 needed to mark resumption of the broader multi-year downtrend. Subsequent support objectives seen at the 2011 LWC at 7769 and the 2011 low-close at 7669.
Bottom line: USD/CHF is threatening a larger reversal within the broader downtrend. From a trading standpoint, losses would need to be limited to 8040 IF price is heading higher on this stretch with weekly close above 8103 on Friday needed to keep the immediate advance viable into the August open.
-MB
Market Analysis: USD/CHF Consolidates GainsMarket Analysis: USD/CHF Consolidates Gains
USD/CHF is rising and might aim for a move toward the 0.8120 resistance.
Important Takeaways for USD/CHF Analysis Today
- USD/CHF is showing positive signs above the 0.8040 resistance zone.
- There is a connecting bullish trend line forming with support at 0.7990 on the hourly chart.
USD/CHF Technical Analysis
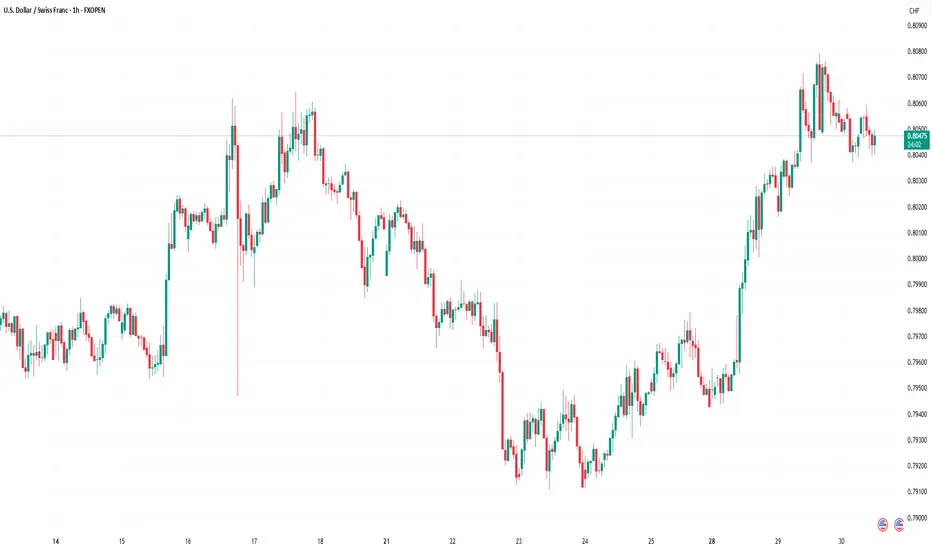
On the hourly chart of USD/CHF at FXOpen, the pair started a decent increase from the 0.7910 support. The US Dollar climbed above the 0.8000 resistance zone against the Swiss Franc.
The bulls were able to pump the pair above the 50-hour simple moving average and 0.8040. A high was formed at 0.8079 and the pair is now consolidating gains above the 23.6% Fib retracement level of the upward move from the 0.7911 swing low to the 0.8079 high.
There is also a connecting bullish trend line forming with support at 0.7990. On the upside, the pair is now facing resistance near 0.8080. The main resistance is now near 0.8120.
If there is a clear break above the 0.8120 resistance zone and the RSI remains above 50, the pair could start another increase. In the stated case, it could test 0.8200. If there is a downside correction, the pair might test the 0.7990 level.
The first major support on the USD/CHF chart is near the 0.7950 level and the 76.4% Fib retracement level.
The next key support is near 0.7910. A downside break below 0.7910 might spark bearish moves. Any more losses may possibly open the doors for a move towards the 0.7850 level in the near term.
This article represents the opinion of the Companies operating under the FXOpen brand only. It is not to be construed as an offer, solicitation, or recommendation with respect to products and services provided by the Companies operating under the FXOpen brand, nor is it to be considered financial advice.
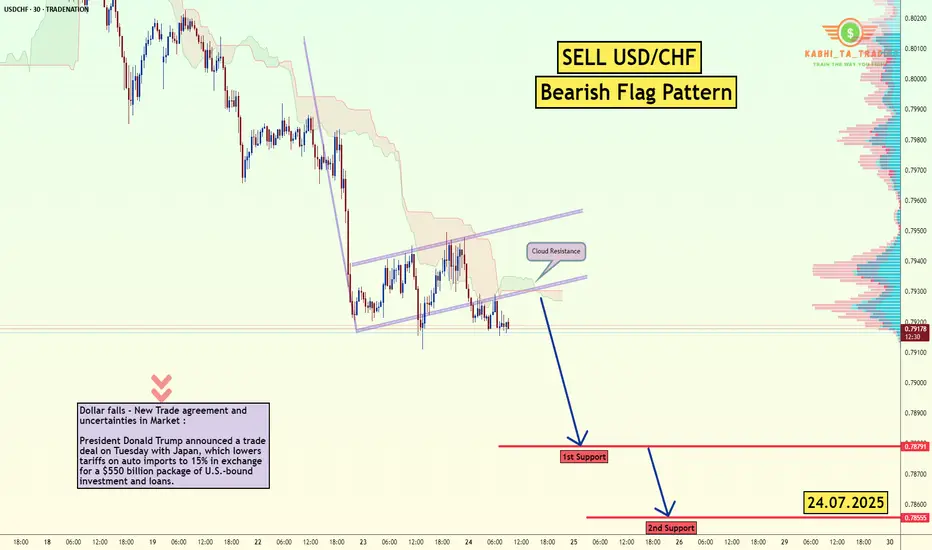
USD/CHF - Bearish Flag (24.07.2025)Fundamental Updates :
Dollar falls - New Trade agreement and uncertainties in Market :
President Donald Trump announced a trade deal on Tuesday with Japan, which lowers tariffs on auto imports to 15% in exchange for a $550 billion package of U.S.-bound investment and loans.
The USD/CHF Pair on the M30 timeframe presents a Potential Selling Opportunity due to a recent Formation of a Bearish Flag Pattern. This suggests a shift in momentum towards the downside in the coming hours.
Possible Short Trade:
Entry: Consider Entering A Short Position around Trendline Of The Pattern.
Target Levels:
1st Support – 0.7878
2nd Support – 0.7855
🎁 Please hit the like button and
🎁 Leave a comment to support for My Post !
Your likes and comments are incredibly motivating and will encourage me to share more analysis with you.
Best Regards, KABHI_TA_TRADING
Thank you.
Disclosure: I am part of Trade Nation's Influencer program and receive a monthly fee for using their TradingView charts in my analysis.
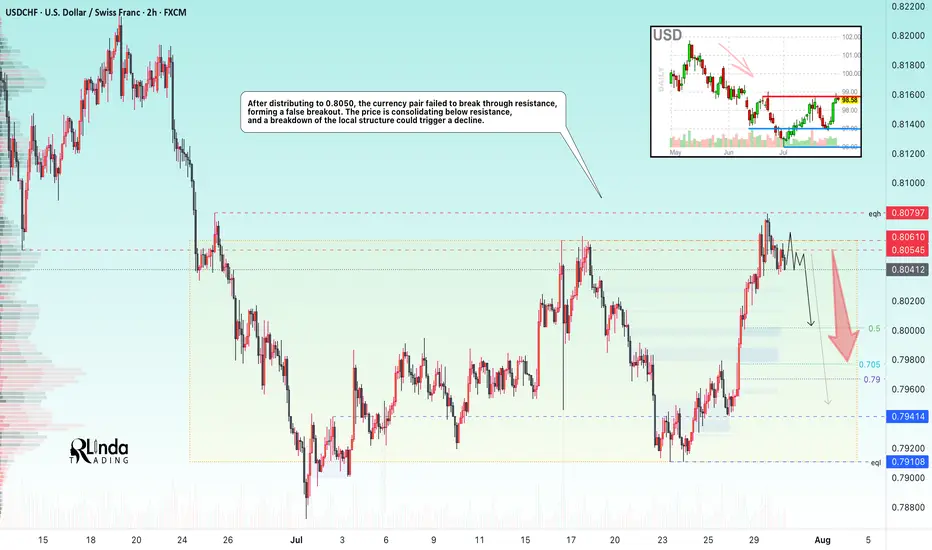
USDCHF → The resistance retest ended with a false breakoutFX:USDCHF tested resistance at 0.805 - 0.806 and formed a false breakout without the possibility of continuing growth. The global trend is downward...
Against the backdrop of the dollar's growth (reaction to news), the currency pair also moved to distribution to 0.8050. The price failed to break through resistance, forming a false breakout. USDCHF is consolidating below resistance, and a breakdown of the local structure could trigger a decline.
The dollar index is also facing fairly strong resistance and may continue its downward trend, which will also affect the decline in the USDCHF price.
Resistance levels: 0.805, 0.806, 0.81
Support levels: 0.800, 0.794, 0.791
If, within the current consolidation, the price begins to fall and break the local structure, then we can expect the decline to continue towards the specified targets!
Best regards, R. Linda!
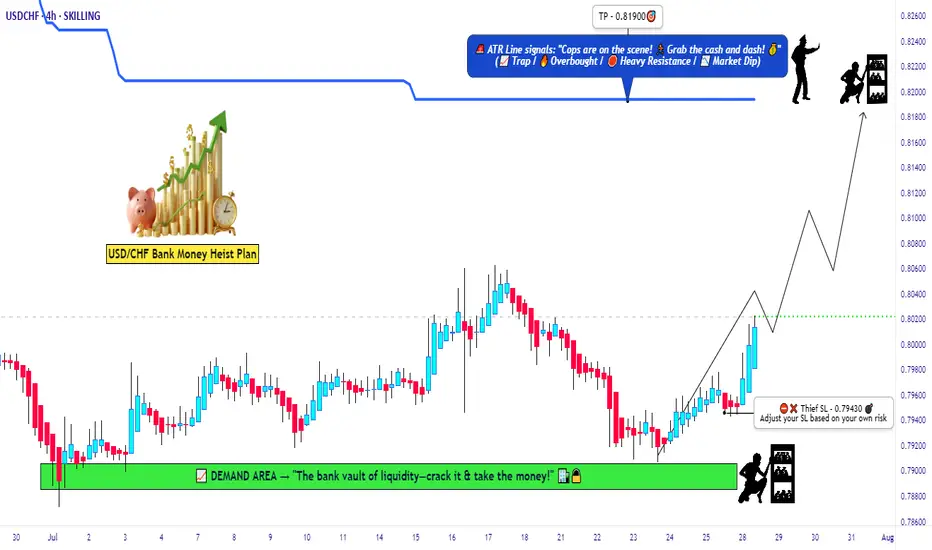
USD/CHF Swissie Heist Plan: Rob the Trend, Ride the Bull!🔐💰 USD/CHF Swissie Forex Heist 💰🔐
“Rob the Trend, Escape the Trap – Thief Style Day/Swing Master Plan”
🌎 Hola! Hello! Ola! Marhaba! Bonjour! Hallo!
Dear Market Looters, Swing Snipers & Scalping Shadows, 🕶️💼💸
Welcome to another elite Thief Trading Operation, targeting the USD/CHF "SWISSIE" vault with precision. Based on sharp technical blueprints & macroeconomic footprints, we're not just trading – we're executing a Forex Bank Heist.
This robbery mission is based on our day/swing Thief strategy – perfect for those who plan, act smart, and love stacking pips like bricks of cash. 💵🧱
💹 Mission Brief (Trade Setup):
🎯 Entry Point – Open the Vault:
Swipe the Bullish Loot!
Price is prepped for an upside raid – jump in at any live price OR set smart Buy Limit orders near the 15m/30m recent pullback zones (last swing low/high).
Use DCA / Layering for better entries, thief-style.
🧠 Thief Logic: Let the market come to you. Pullbacks are entry doors – robbers don’t rush into traps.
🛑 Stop Loss – Exit Strategy If Caught:
📍 Primary SL: Below recent swing low on the 4H chart (around 0.79430)
📍 Adjust based on lot size, risk, and number of stacked entries.
This SL isn’t your leash – it’s your getaway route in case the plan backfires.
🏴☠️ Profit Target – Escape Before the Cops Arrive:
🎯 Target Zone: 0.81900
(Or dip out earlier if the vault cracks fast – Robbers exit before alarms trigger!)
📌 Trailing SL recommended as we climb up the electric red zone.
🔥 Swissie Heist Conditions:
📈 USD/CHF showing upward bias based on:
Momentum shift
Reversal zone bounce
Strong USD sentiment & macro factors
✅ COT positioning
✅ Intermarket correlations
✅ Sentiment & Quant data
➡️ Do your fundamental recon 🔎
⚔️ Scalpers – Here's Your Mini-Mission:
Only play LONGS. No counter-robbing.
💸 Big bags? Enter with aggression.
💼 Small stack? Follow the swing crew.
💾 Always trail your SL – protect the stash.
🚨 News Alert – Avoid Laser Alarms:
🗓️ During high-volatility releases:
⚠️ No new trades
⚠️ Use trailing SLs
⚠️ Watch for spikes & fakeouts – the vault traps amateurs
💣 Community Boost Request:
If this plan helps you loot the market:
💥 Smash that Boost Button 💥
Let’s strengthen the Thief Army 💼
The more we grow, the faster we move, and the deeper we steal. Every like = one more bulletproof trade.
#TradeLikeAThief 🏆🚨💰
📌 Legal Escape Note:
This chart is a strategic overview, not personalized advice.
Always use your judgment, manage risk, and review updated data before executing trades.
📌 Market is dynamic – so keep your eyes sharp, your plan tighter, and your strategy ruthless.
🕶️ Stay dangerous. Stay profitable.
See you soon for the next Forex Vault Hit.
Until then – Lock. Load. Loot.
USDCHF SHORT IDEA FULL BREAKDOWNUSD/CHF is flashing a strong bearish signal from both a macro and sentiment perspective.
✅ Bearish USD Drivers:
FOMC Pivot Watch: July meeting minutes hinted at potential rate cuts before year-end due to inflation moderating and soft jobs data.
Rising Swiss Franc Demand: CHF is benefiting from safe haven flows amid escalating tensions in Eastern Europe and shaky U.S. equity markets.
Swiss CPI Stable: Inflation is in check, allowing SNB to maintain their policy stance without pressure.
Institutional traders are reducing their exposure to the U.S. dollar, while retail traders are net long USDCHF — a classic contrarian bearish signal. Seasonality also favors Swiss Franc strength in August. On the macro side, U.S. data is underwhelming: job growth has slowed, services PMI is soft, and inflation metrics (CPI, PCE) are cooling. This has increased expectations for a Fed rate cut later in the year. Meanwhile, the Swiss National Bank remains stable with no urgency to ease policy. Combined with global risk-off sentiment, capital is flowing into CHF, giving it an added edge over the dollar.
Buy usdchfStrong bullish momentum expected from this level
Monthly too oversold pair
Ready to break the above resistance trend
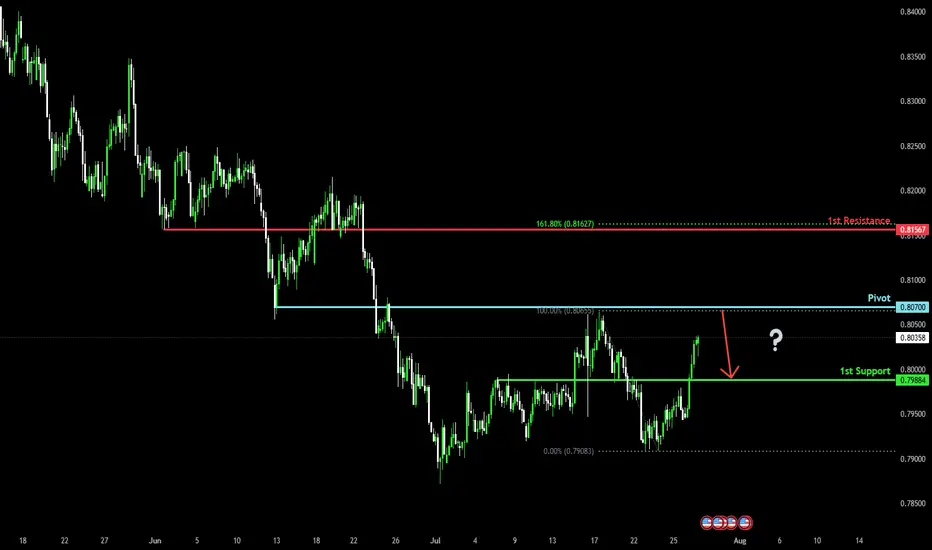
Bearish drop?The Swissie (USD/CHF) has rejected off the pivot and could potentially drop to the 50% Fibonacci support.
Pivot: 0.8070
1st Support: 0.7988
1st Resistance: 0.8128
Risk Warning:
Trading Forex and CFDs carries a high level of risk to your capital and you should only trade with money you can afford to lose. Trading Forex and CFDs may not be suitable for all investors, so please ensure that you fully understand the risks involved and seek independent advice if necessary.
Disclaimer:
The above opinions given constitute general market commentary, and do not constitute the opinion or advice of IC Markets or any form of personal or investment advice.
Any opinions, news, research, analyses, prices, other information, or links to third-party sites contained on this website are provided on an "as-is" basis, are intended only to be informative, is not an advice nor a recommendation, nor research, or a record of our trading prices, or an offer of, or solicitation for a transaction in any financial instrument and thus should not be treated as such. The information provided does not involve any specific investment objectives, financial situation and needs of any specific person who may receive it. Please be aware, that past performance is not a reliable indicator of future performance and/or results. Past Performance or Forward-looking scenarios based upon the reasonable beliefs of the third-party provider are not a guarantee of future performance. Actual results may differ materially from those anticipated in forward-looking or past performance statements. IC Markets makes no representation or warranty and assumes no liability as to the accuracy or completeness of the information provided, nor any loss arising from any investment based on a recommendation, forecast or any information supplied by any third-party.


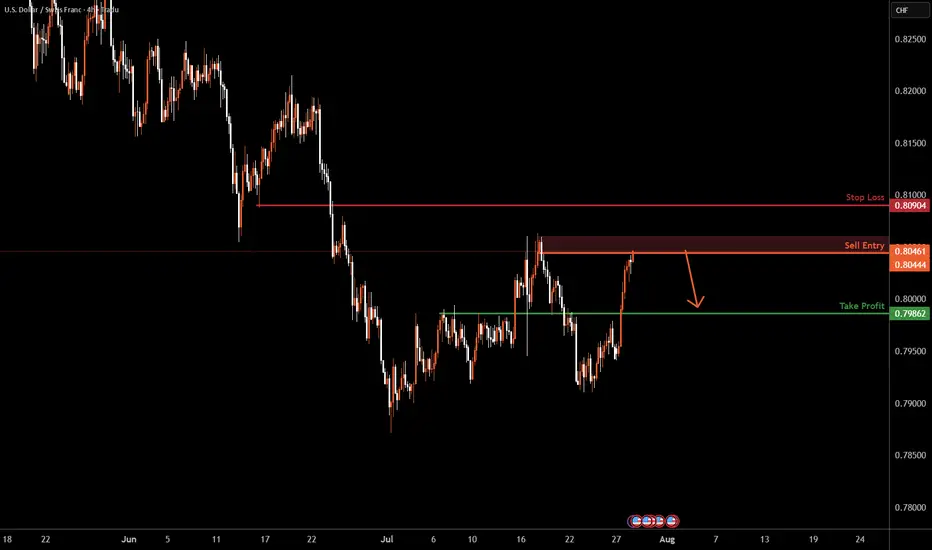
USDCHF H4 I Bearish Drop Based on the H4 chart analysis, we can see that the price is entering our sell zone of 0.8404 - 0.8061.
Our take profit will be at 0.7986, a pullback support level.
The stop loss will be placed at 0.8090, a pullback resistance.
High Risk Investment Warning
Trading Forex/CFDs on margin carries a high level of risk and may not be suitable for all investors. Leverage can work against you.
Stratos Markets Limited (tradu.com ):
CFDs are complex instruments and come with a high risk of losing money rapidly due to leverage. 65% of retail investor accounts lose money when trading CFDs with this provider. You should consider whether you understand how CFDs work and whether you can afford to take the high risk of losing your money.
Stratos Europe Ltd (tradu.com ):
CFDs are complex instruments and come with a high risk of losing money rapidly due to leverage. 66% of retail investor accounts lose money when trading CFDs with this provider. You should consider whether you understand how CFDs work and whether you can afford to take the high risk of losing your money.
Stratos Global LLC (tradu.com ):
Losses can exceed deposits.
Please be advised that the information presented on TradingView is provided to Tradu (‘Company’, ‘we’) by a third-party provider (‘TFA Global Pte Ltd’). Please be reminded that you are solely responsible for the trading decisions on your account. There is a very high degree of risk involved in trading. Any information and/or content is intended entirely for research, educational and informational purposes only and does not constitute investment or consultation advice or investment strategy. The information is not tailored to the investment needs of any specific person and therefore does not involve a consideration of any of the investment objectives, financial situation or needs of any viewer that may receive it. Kindly also note that past performance is not a reliable indicator of future results. Actual results may differ materially from those anticipated in forward-looking or past performance statements. We assume no liability as to the accuracy or completeness of any of the information and/or content provided herein and the Company cannot be held responsible for any omission, mistake nor for any loss or damage including without limitation to any loss of profit which may arise from reliance on any information supplied by TFA Global Pte Ltd.
The speaker(s) is neither an employee, agent nor representative of Tradu and is therefore acting independently. The opinions given are their own, constitute general market commentary, and do not constitute the opinion or advice of Tradu or any form of personal or investment advice. Tradu neither endorses nor guarantees offerings of third-party speakers, nor is Tradu responsible for the content, veracity or opinions of third-party speakers, presenters or participants.
Bearish reversal?The Swissie (USD/CHF) is rising towards the pivot, which acts as an overlap resistance and could reverse to the 1st support.
Pivot: 0.8070
1st Support: 0.7988
1st Resistance: 0.8156
Risk Warning:
Trading Forex and CFDs carries a high level of risk to your capital and you should only trade with money you can afford to lose. Trading Forex and CFDs may not be suitable for all investors, so please ensure that you fully understand the risks involved and seek independent advice if necessary.
Disclaimer:
The above opinions given constitute general market commentary, and do not constitute the opinion or advice of IC Markets or any form of personal or investment advice.
Any opinions, news, research, analyses, prices, other information, or links to third-party sites contained on this website are provided on an "as-is" basis, are intended only to be informative, is not an advice nor a recommendation, nor research, or a record of our trading prices, or an offer of, or solicitation for a transaction in any financial instrument and thus should not be treated as such. The information provided does not involve any specific investment objectives, financial situation and needs of any specific person who may receive it. Please be aware, that past performance is not a reliable indicator of future performance and/or results. Past Performance or Forward-looking scenarios based upon the reasonable beliefs of the third-party provider are not a guarantee of future performance. Actual results may differ materially from those anticipated in forward-looking or past performance statements. IC Markets makes no representation or warranty and assumes no liability as to the accuracy or completeness of the information provided, nor any loss arising from any investment based on a recommendation, forecast or any information supplied by any third-party.
USD REGAINED STRENGTH USD regain strength over CHF at the price of 0.79420
CHF can gain balance the zone 0.79743 to 0.79524 giving an edge to the USD.
📊📉📈🚀🚀
Bearish drop off pullback resistance?USD/CHF is rising towards the resistance level, which is a pullback resistance that aligns with the 50% Fibonacci retracement and could drop from this level to our take-profit.
Entry: 0.7985
Why we like it:
There is a pullback resistance that aligns with the 50% Fibonacci retracement.
Stop loss: 0.8067
Why we like it:
There is an overlap resistance.
Take profit: 0.7888
Why we like it:
There is a swing low support that aligns with the 127.2% Fibonacci extension.
Enjoying your TradingView experience? Review us!
Please be advised that the information presented on TradingView is provided to Vantage (‘Vantage Global Limited’, ‘we’) by a third-party provider (‘Everest Fortune Group’). Please be reminded that you are solely responsible for the trading decisions on your account. There is a very high degree of risk involved in trading. Any information and/or content is intended entirely for research, educational and informational purposes only and does not constitute investment or consultation advice or investment strategy. The information is not tailored to the investment needs of any specific person and therefore does not involve a consideration of any of the investment objectives, financial situation or needs of any viewer that may receive it. Kindly also note that past performance is not a reliable indicator of future results. Actual results may differ materially from those anticipated in forward-looking or past performance statements. We assume no liability as to the accuracy or completeness of any of the information and/or content provided herein and the Company cannot be held responsible for any omission, mistake nor for any loss or damage including without limitation to any loss of profit which may arise from reliance on any information supplied by Everest Fortune Group.

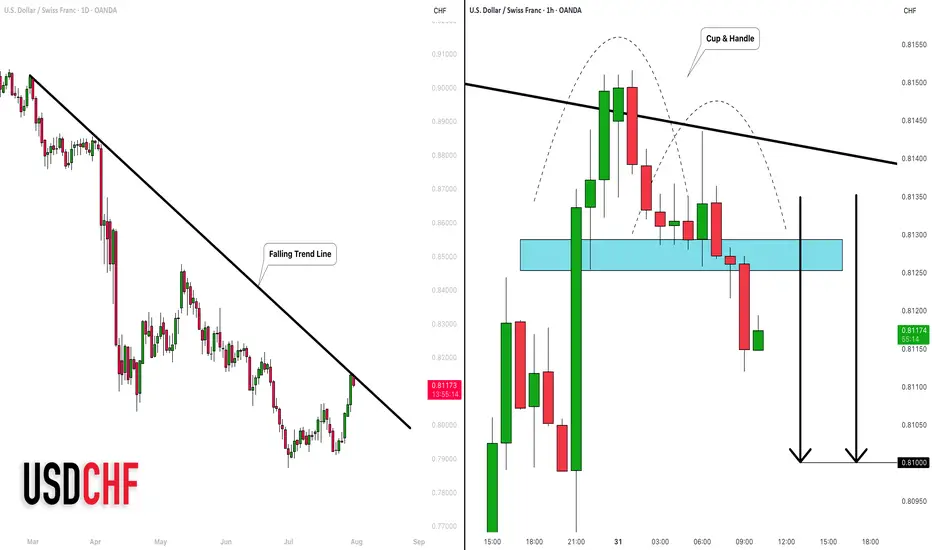
USDCHF: Correction Ahead! 🇺🇸🇨🇭
I think that USDCHF is going to retrace after a test
of a major falling trend line on a daily.
As a confirmation, I found an inverted cup & handle pattern
on an hourly time frame.
Closest support - 0.81
❤️Please, support my work with like, thank you!❤️
USD/CHF potential trend reversalNothing concrete yet. is the down trend over? Road Map idea correct? look for price action to confirm potential setup.
* if trend reversal is in then a major leg up for a stronger US$

US Dollar Strength To Return In Full ForceThe mighty Dollar will once again prevail in the long term across all major pairs. It's status as the world reserve currency is far from removed.
