USDCHF Outlook: Further Downside Expected Next WeekUSDCHF is likely to continue its bearish momentum in the coming week. Technical signals suggest that the pair could drop further, potentially heading toward the 0.779 support zone. Traders should monitor for confirmation signals before entering short positions.
USDCHF trade ideas

USDCHFUSDCHF is expected to continue its downtrend next week. After a weak recovery attempt, selling pressure remains dominant. Traders should keep an eye on key support zones for potential trading opportunities.
Will USDCHF remain bullish?
Hi dears
We are at your service with the analysis of the Swiss Franc against the US Dollar. It seems that we should continue to see the strengthening of the US Dollar. It is possible that we will see the growth of the African Dollar against the opposite currency pairs.
What do you think?
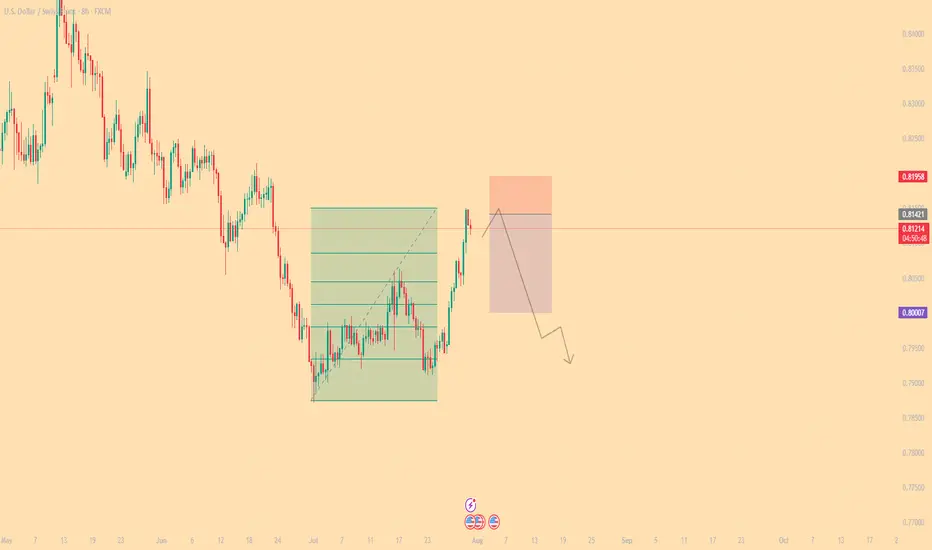
#015: USD/CHF SHORT Investment OpportunityHello readers, I'm Forex Trader Andrea Russo, and today I'd like to share this SHORT investment opportunity I've identified in the USD/CHF pair.
In recent days, USD/CHF has exhibited typical technical exhaustion behavior near key dynamic resistance. The area between 0.81300 and 0.81650 represented a significant supply zone, previously tested with an extended spike and immediately rejected.
The price violated the 200 EMA with an apparent breakout, but without real institutional volume to support the move. This was followed by a rapid retracement below the mean and a sideways movement, suggesting ongoing manipulation and liquidity building.
Meanwhile, global retail sentiment shows a significant anomaly: over 70% of retail traders are long. This imbalance increases the likelihood that market makers are preparing a bearish reversal to target the most fragile positions and restore equilibrium.
The 0.81420 level has been identified as a key point for a possible price reversion to the manipulative zone before the actual directional move. If the price reverts to this level, a technical spike is likely to be executed to complete the hunt for stops before the downtrend begins.
The trade targets a decline towards the 0.80000 area, which represents the first significant level of technical support and a realistic target if the reversal is confirmed.
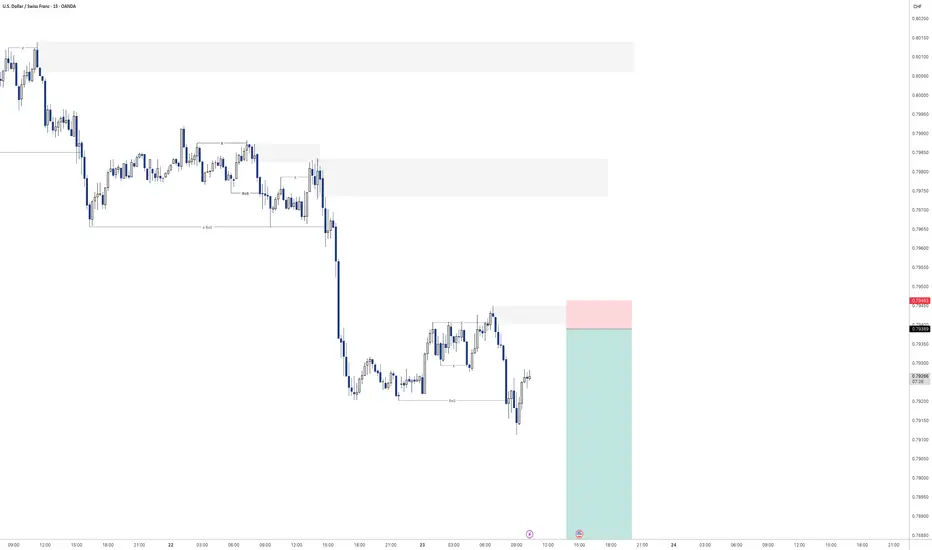
USD/CHF Climbs as Focus Shifts to U.S. Data, Swiss Franc Awaits Technical Analysis
On the 4-hour chart, USD/CHF is building a recovery from the 0.79441 low. Notably, the pair is not retesting the previous falling trendline but is approaching a critical resistance at the last swing high of 0.79793.
If bullish momentum persists, a break above 0.79793 (last swing top and 100% Fibonacci retracement) will open the way to 0.79889 (127.2% Fib extension), 0.80011 (161.8% extension), and potentially the psychological 0.80145 level. The widening Bollinger Bands support the case for an extended move if resistance is cleared.
Alternative Scenario:
Should the pair fail to clear 0.79793, a reversal toward 0.79659 or even a retest of the 0.79441 low becomes plausible. This would likely occur if U.S. macro data disappoints or if safe-haven flows return to CHF.
Fundamental Outlook
US Treasury Bill and Note Auctions:
The 3-month, 6-month, 2-year, and 5-year note auctions will attract institutional attention for yield and demand, but are not expected to cause direct volatility in USD/CHF barring a significant spike in yields or a poor auction result.
No high-impact Swiss data is scheduled today. The franc remains guided by risk sentiment, expectations around SNB liquidity operations, and potential intervention signals.

Lingrid | USDCHF Corrective Move and Bearish ContinuationThe price perfectly fulfills my previous idea . FX:USDCHF is weakening after printing a lower high beneath the resistance zone and rejecting the confluence of the downward trendline and horizontal supply near 0.80079. The structure remains bearish despite short-term corrective moves, as each rally stalls below previous highs. Price is at risk of rolling over again, aiming for the 0.78300 support if the 0.80000 area holds as resistance. Sellers remain in control as long as the pair trades below the red trendline.
📉 Key Levels
Sell trigger: Rejection below 0.80000
Sell zone: 0.79800–0.80100
Target: 0.78300
Invalidation: Close above 0.80150
💡 Risks
Bullish breakout above the descending trendline
Momentum divergence on intraday timeframes
Broader USD strength recovery
If this idea resonates with you or you have your own opinion, traders, hit the comments. I’m excited to read your thoughts!

USDCHF - Sell off continuation?Looking for continuation of the selling pressure here on USDCHF
Will see how we play out for the rest of the day
USDCHF Short ProjectHi guys...😎
My custom indicator says it's time to do a Short Project on USDCHF with 3 key reasons:
1. Price Drivers: institutional shorting
2. Trend: down
3. Momentum: bearish
Action: waiting for entry on the intraday timeframe (entry will be published further)

USDCHF: Bearish Shift Offers Premium Selling ZonesGreetings Traders,
At present, USDCHF is exhibiting a clear shift in institutional order flow toward the bearish side. In response, we aim to align with this directional bias by identifying high-probability selling opportunities within premium price zones.
Higher Timeframe Context:
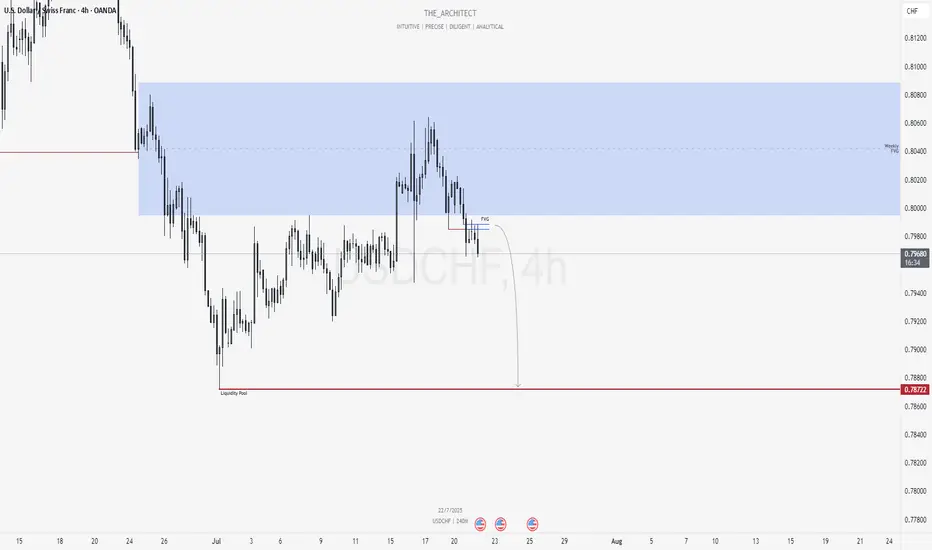
The weekly timeframe remains bearish, offering a macro-level bias. Price recently pulled back into the weekly Fair Value Gap (FVG), a key internal range area. With this retracement complete, we now expect the market to begin its delivery toward external liquidity pools located in discounted price zones.
Key Observations on H4:
Market Structure Shift (MSS): USDCHF has recently presented a bearish MSS on the H4, confirming a change in the internal structure and further validating the bearish narrative.
H4 Fair Value Gap Rejection: Following the MSS, price retraced into a newly formed H4 FVG. This area now serves as a short-term institutional resistance zone.
Sell Opportunity Zone: This H4 FVG provides a valid zone to seek confirmation-based entries on the lower timeframes (e.g., M15), with the objective of targeting downside liquidity.
Trading Plan:
Entry Strategy: Look for short setups via confirmation on the M15 timeframe within the current H4 FVG zone.
Targets: Focus on internal liquidity pools within discounted price levels, with the broader objective being the external liquidity resting beneath recent swing lows.
For a detailed market walkthrough and in-depth execution zones, be sure to watch this week’s Forex Market Breakdown:
Kind Regards,
The Architect 🏛️📉
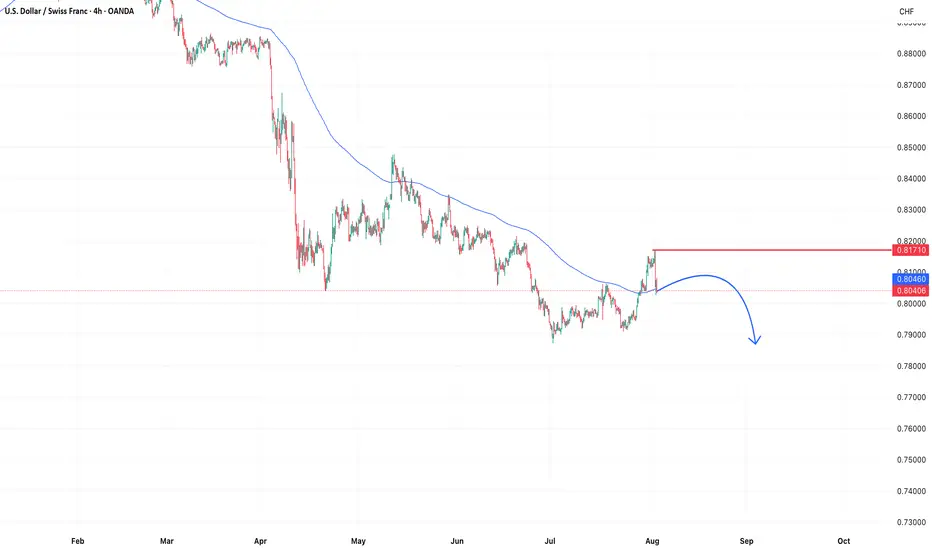
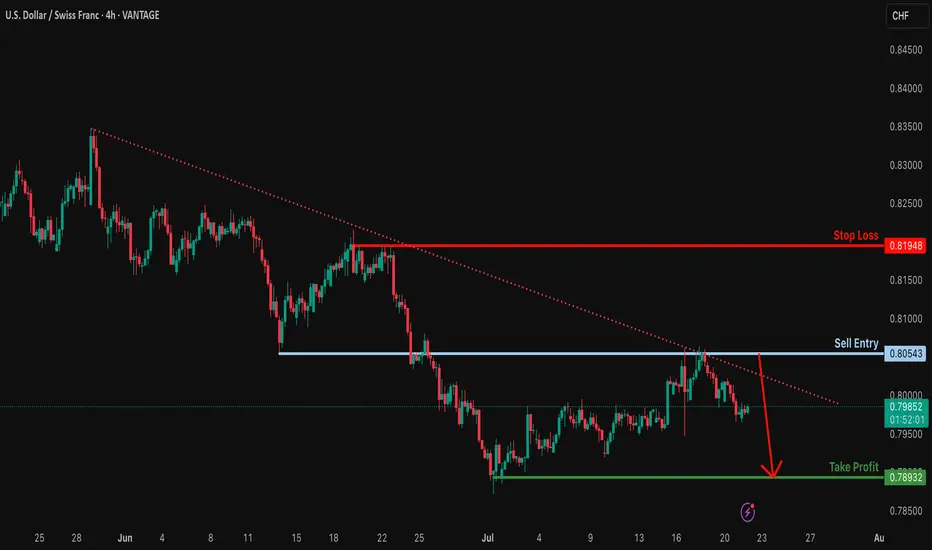
Bearish continuation?USD/CHF is rising towards the resistance level which is an overlap resistance and could drop from this level to our take profit.
Entry: 0.8054
Why we like it:
There is an overlap resistance level.
Stop loss: 0.8194
Why we like it:
There is a pullback resistance.
Take profit: 0.7893
Why we like it:
There a pullback support.
Enjoying your TradingView experience? Review us!
Please be advised that the information presented on TradingView is provided to Vantage (‘Vantage Global Limited’, ‘we’) by a third-party provider (‘Everest Fortune Group’). Please be reminded that you are solely responsible for the trading decisions on your account. There is a very high degree of risk involved in trading. Any information and/or content is intended entirely for research, educational and informational purposes only and does not constitute investment or consultation advice or investment strategy. The information is not tailored to the investment needs of any specific person and therefore does not involve a consideration of any of the investment objectives, financial situation or needs of any viewer that may receive it. Kindly also note that past performance is not a reliable indicator of future results. Actual results may differ materially from those anticipated in forward-looking or past performance statements. We assume no liability as to the accuracy or completeness of any of the information and/or content provided herein and the Company cannot be held responsible for any omission, mistake nor for any loss or damage including without limitation to any loss of profit which may arise from reliance on any information supplied by Everest Fortune Group.
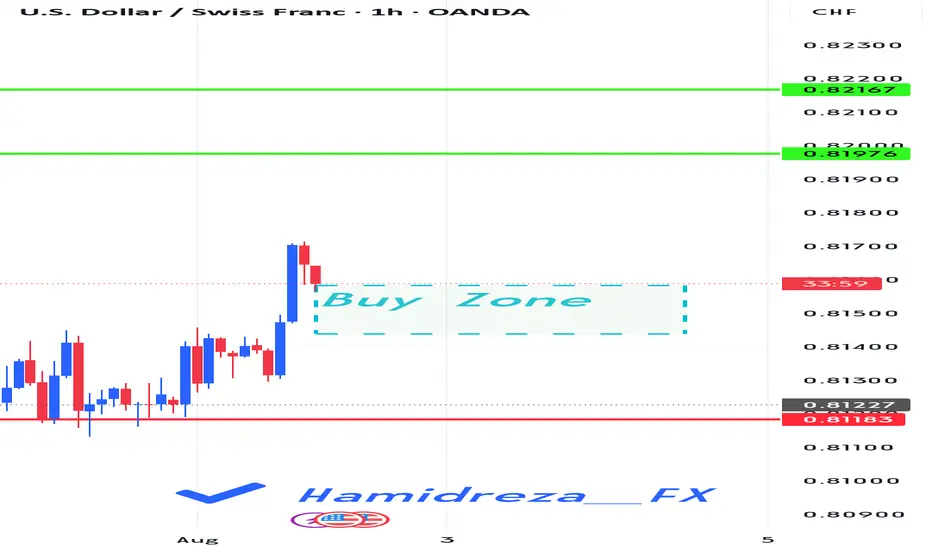
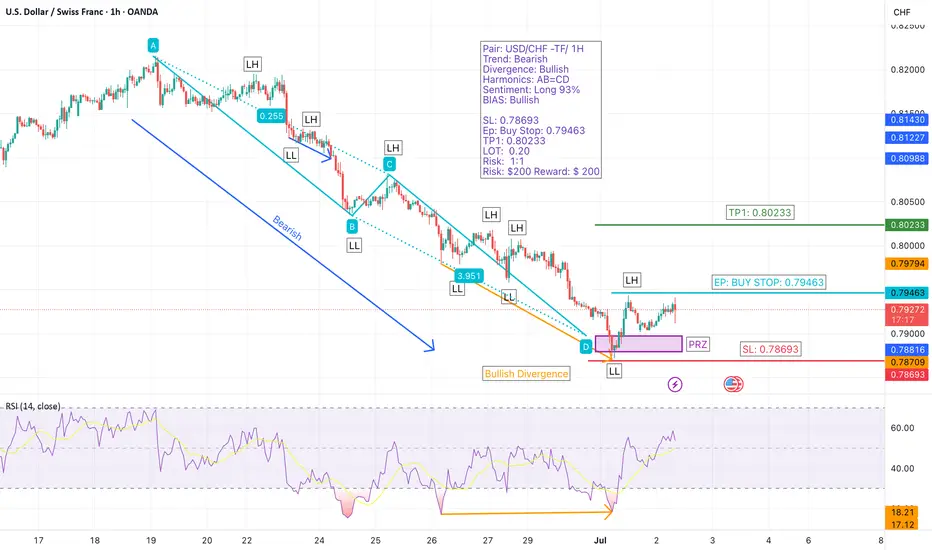
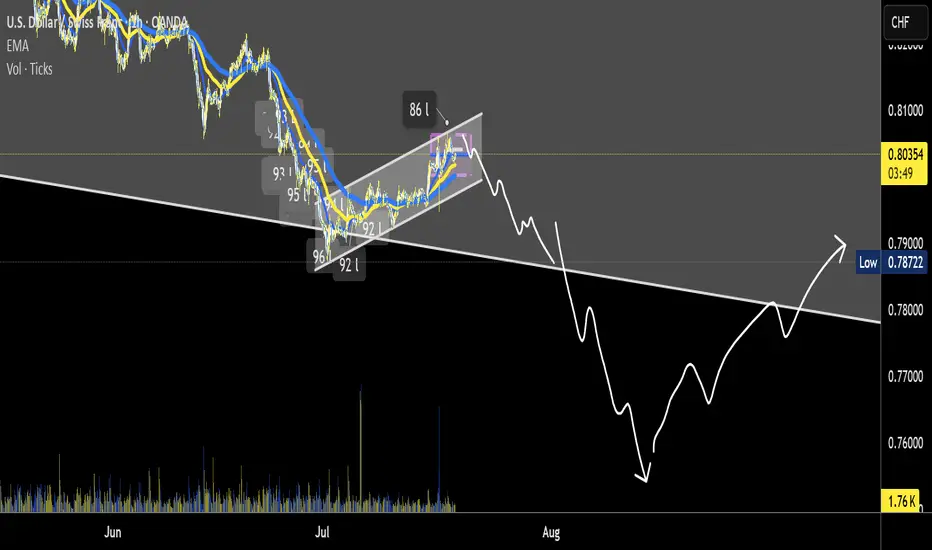
USD/CHF – Bullish Reversal Setup with AB=CD Harmonics (1H TimefrWe’re closely watching USD/CHF, which has been in a bearish trend but is now showing strong signs of a bullish reversal.
A bullish divergence has formed, and the price has reached the Potential Reversal Zone (PRZ) as projected by the AB=CD harmonic pattern. This suggests that the trend may already be reversing.
Additionally, Myfxbook sentiment shows 93% of retail traders are long, reinforcing overall bullish bias. However, for confirmation, we’re waiting for a breakout above the last lower high (LH) to ensure a shift in structure before entering.
🔹 Pair: USD/CHF
🔹 Timeframe: 1H
🔹 Trend: Bearish (reversal expected)
🔹 Divergence: Bullish
🔹 Harmonic Pattern: AB=CD (PRZ hit)
🔹 Sentiment: 93% Long (Myfxbook)
🔹 Bias: Bullish
🔹 Entry (Buy Stop): 0.79463
🔹 Stop Loss: 0.78693
🔹 Take Profit 1: 0.80233
🔹 Lot Size: 0.20
🔹 Risk/Reward: 1:1
🔹 Risk: $200
🔹 Potential Reward: $200
🎯 Strategy: Entry will be triggered only after the breakout of the previous LH, confirming a shift to bullish structure and validating the harmonic reversal.
📌 #USDCHF #ABCDPattern #BullishDivergence #HarmonicTrading #TrendReversal #SmartMoneyMoves #BreakoutSetup #TechnicalAnalysis #PriceAction #ForexSignals #RiskManagement #1HChart #ForexTradeIdeas
USDCHF Broke the Trendline resistance, what about Fib 0 .5? USDCHF was trading in downward and recently it has Broken the trendline resistance and price is currently at 0.5 fib will it reject form here again ? or fib 0.5 will be broken after correction and further growth ?

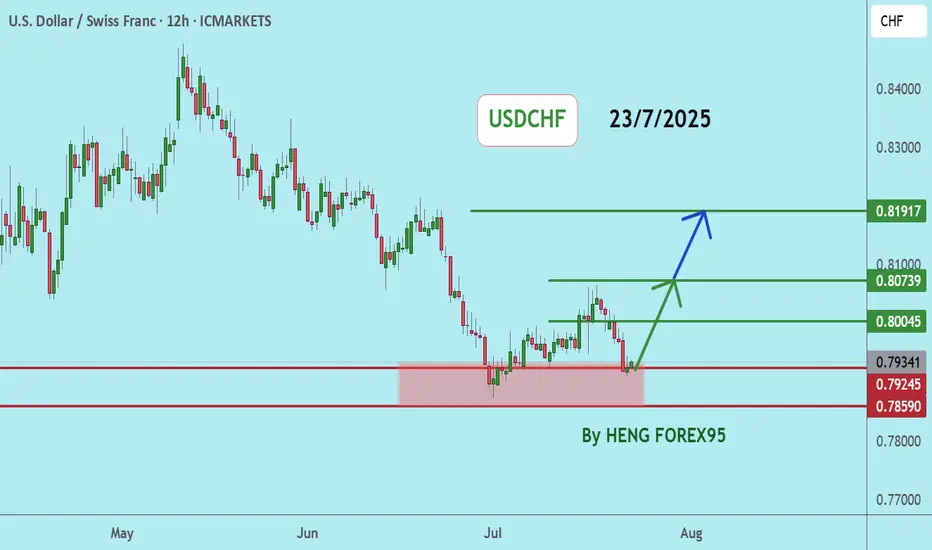
USDCHFUSDCHF price is near the main support zone 0.79245-0.78590. If the price cannot break through the 0.78590 level, it is expected that the price will rebound. Consider buying the red zone.
🔥Trading futures, forex, CFDs and stocks carries a risk of loss.
Please consider carefully whether such trading is suitable for you.
>>GooD Luck 😊
❤️ Like and subscribe to never miss a new idea!
USD/CHF hoping lower. before major up turnA note to myself:
- remember no matter what happens. its a 50/50 chance you are right. even with a winning
strategy.
- whats going on inside of yourself. why? whats it trying to tell you?
- what have you learned about yoursefl?
- be patient, take a breathe and be aware of FOMO
- Its not about quantity. its about quality.(choose MAX. 3 trades a week)
- stick to your plan. load up on quality trades.
- RISK MANAGEMENT is the key to being a successful trader AND Risk Reward Ratio minimum 1:3 w
USDCHF – The Wind Still Blows South!USDCHF remains trapped below the descending trendline since June. Every bullish attempt has been sharply rejected – showing sellers are still in control.
Fresh U.S. data just released:
Jobless claims dropped → strong labor market → Fed likely to keep rates high → USD gains strength.
Manufacturing PMI beat expectations → resilient economy → more reason for a hawkish Fed.
But don’t forget: CHF is attracting safe-haven flows, adding downward pressure on USD!
If price fails to break above 0.7990 and gets rejected at the trendline, a drop toward 0.7890 is likely.
Strategy: Look to SELL around the trendline – follow the trend, not your emotions!
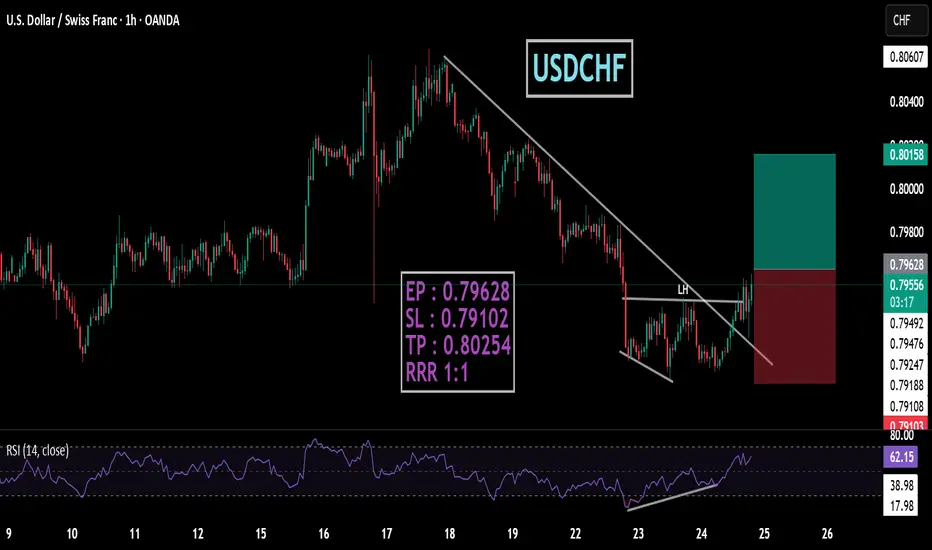
USDCHFtrendline breakout also divergence break last LH
EP : 0.79628
SL : 0.79102
TP : 0.80254
RRR 1:1
USD/CHF Update: Missed the Last Short? Grab the New Trigger!Yo traders and market lovers, it’s Skeptic from Skeptic Lab! Here’s a quick USD/CHF update: my last short trigger after the support break gave us a 50-pip drop . With a solid stop loss, you’re likely sitting on a 2:1 R/R; risk-takers might even be at 5:1. I’m breaking down a fresh trigger in this video—don’t miss it! Drop your thoughts or coin requests in the comments, give it a boost if it helped , and don’t miss my educational post coming tonight on Skeptic Lab’s TradingView page with lessons from my first 100 trades—it’s gonna be fire. Catch you tonight! 😎

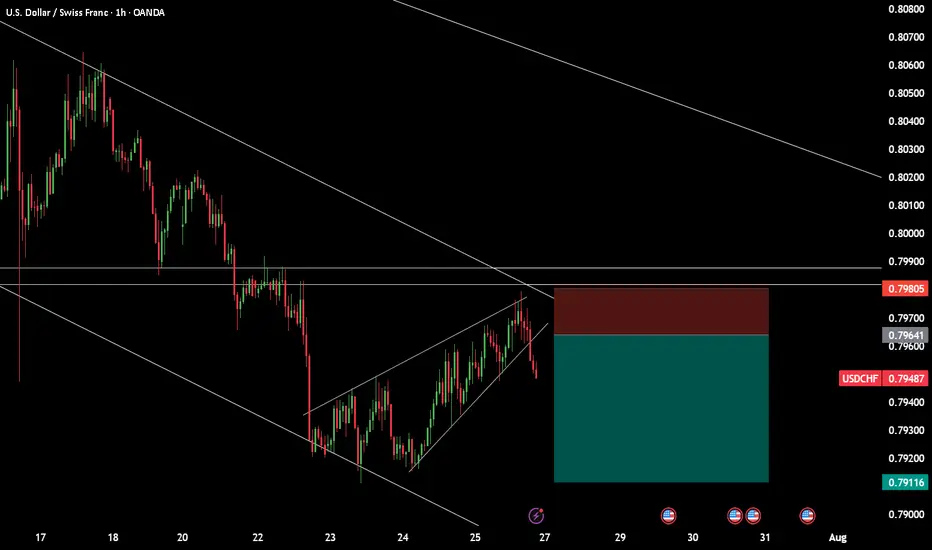
USDCHFPossible move to the down side. Waiting for a retracement around the 0.79650 zone before we go short.
@musehanezwothe
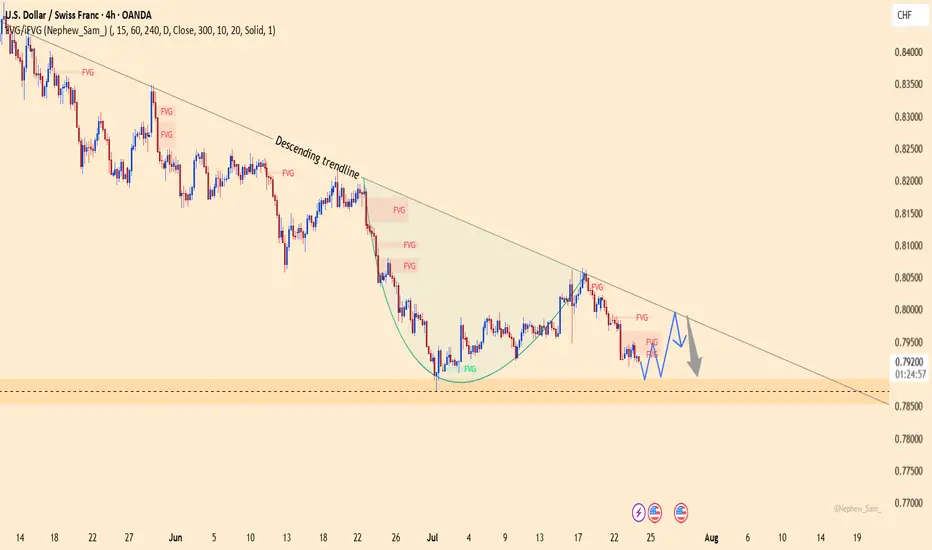
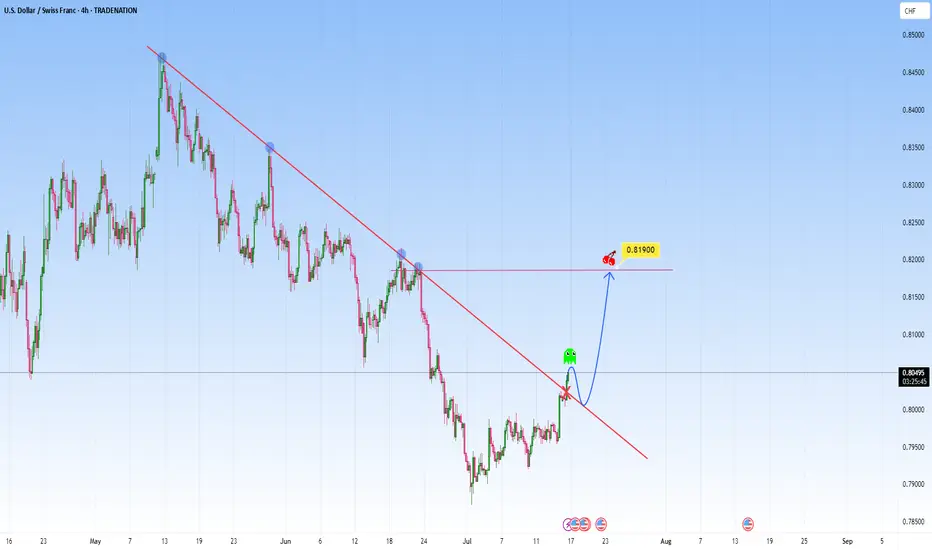
USDCHF: Could be telling a story of break-retest-reversalThe price action on the USDCHF presents an opportunity of structural transition. The descending trendline has acted as dynamic resistance, has contained each rally attempt beautifully. This trendline is marked by multiple rejections, reflected bearish dominance, a controlled downtrend in motion.
The recent movement though could signal a shift. The market has started to break above this descending structure, and it could early suggest that bearish momentum is weakening.
I will be waiting for the price to return to the broken trendline, treating former resistance as newfound support. It’s a confirmation pattern in order to filter false moves, a structure retest that reinforces breakout reliability.
From this base, I am expecting it to target the 0.81900 level, as shown. This area coinciding with horizontal resistance that aligns with previous reactions. Such levels as natural “gravitational pivots”.
An ideal approach here would involve observing the character of the pullback. If the market returns to the trendline with declining bearish volume and forms higher lows on lower timeframes, it strengthens the bullish case.
The trendline break on the chart is not just a signal, it’s a storyline unfolding. It marks a shift with a story. And if volume, price structure, and timing align as they appear poised to, this move could be the first move in a broader upside correction or trend reversal.
Just sharing my thoughts for the charts, this isn’t financial advice. Always confirm your setups and manage your risk properly.
Disclosure: I am part of Trade Nation's Influencer program and receive a monthly fee for using their TradingView charts in my analysis.
USDCHF 23.07.25~+ Pressure on Powell, Waller is dovish
~+ Anticipation of the Trade deals deadline
+ Risk-on general sentiment after Japan trade deal

USDCHF sellUSD/CHF is currently in a downtrend, with the US Dollar exhibiting weakness throughout the year. From a technical standpoint, the pair appears poised for further decline, given the formation of a bearish flag. If considering this trade, it's essential to prioritize risk management or look for a potential retest of the flag's resistance level (or the apex of an ascending wedge, if applicable) before entering a short position.

USDCHF extension to the downside The USD/CHF pair is currently trading with a bearish bias, aligned with the broader downward trend. Recent price action shows a retest of the falling resistance, suggesting a temporary relief rally within the downtrend.
Key resistance is located at 0.8045, a prior consolidation zone. This level will be critical in determining the next directional move.
A bearish rejection from 0.8045 could confirm the resumption of the downtrend, targeting the next support levels at 0.7900, followed by 0.7860 and 0.7810 over a longer timeframe.
Conversely, a decisive breakout and daily close above 0.8045 would invalidate the current bearish setup, shifting sentiment to bullish and potentially triggering a move towards 0.8080, then 0.8140.
Conclusion:
The short-term outlook remains bearish unless the pair breaks and holds above 0.8045. Traders should watch for price action signals around this key level to confirm direction. A rejection favours fresh downside continuation, while a breakout signals a potential trend reversal or deeper correction.
This communication is for informational purposes only and should not be viewed as any form of recommendation as to a particular course of action or as investment advice. It is not intended as an offer or solicitation for the purchase or sale of any financial instrument or as an official confirmation of any transaction. Opinions, estimates and assumptions expressed herein are made as of the date of this communication and are subject to change without notice. This communication has been prepared based upon information, including market prices, data and other information, believed to be reliable; however, Trade Nation does not warrant its completeness or accuracy. All market prices and market data contained in or attached to this communication are indicative and subject to change without notice.

USD/CHF WATCHING🔍 USD/CHF – Watching for Pullback Setup
We’re monitoring USD/CHF for a potential pullback into a strong S/R zone.
Here’s what we need to see before considering entry:
✅ Volume increasing in the direction of the setup
✅ Momentum rising, then hooking down in alignment
✅ A clean engulfing candle at the zone for the trigger
If all criteria align, we’ll drop to the 1H chart to fine-tune the entry per VMS strategy rules.
📌 We don’t guess—we prepare. The trade either fits the strategy, or it doesn’t.
