USDCHF H4 I Bullish Bounce Off Based on the H4 chart analysis, we can see that the price could fall toward our buy entry at 0.7985 which is a pullback support.
Our take profit will be at 0.8039, which is a pullback resistance level.
The stop loss will be placed at 0.7938, which is a pullback support level.
High Risk Investment Warning
Trading Forex/CFDs on margin carries a high level of risk and may not be suitable for all investors. Leverage can work against you.
Stratos Markets Limited (tradu.com ):
CFDs are complex instruments and come with a high risk of losing money rapidly due to leverage. 63% of retail investor accounts lose money when trading CFDs with this provider. You should consider whether you understand how CFDs work and whether you can afford to take the high risk of losing your money.
Stratos Europe Ltd (tradu.com ):
CFDs are complex instruments and come with a high risk of losing money rapidly due to leverage. 63% of retail investor accounts lose money when trading CFDs with this provider. You should consider whether you understand how CFDs work and whether you can afford to take the high risk of losing your money.
Stratos Global LLC (tradu.com ):
Losses can exceed deposits.
Please be advised that the information presented on TradingView is provided to Tradu (‘Company’, ‘we’) by a third-party provider (‘TFA Global Pte Ltd’). Please be reminded that you are solely responsible for the trading decisions on your account. There is a very high degree of risk involved in trading. Any information and/or content is intended entirely for research, educational and informational purposes only and does not constitute investment or consultation advice or investment strategy. The information is not tailored to the investment needs of any specific person and therefore does not involve a consideration of any of the investment objectives, financial situation or needs of any viewer that may receive it. Kindly also note that past performance is not a reliable indicator of future results. Actual results may differ materially from those anticipated in forward-looking or past performance statements. We assume no liability as to the accuracy or completeness of any of the information and/or content provided herein and the Company cannot be held responsible for any omission, mistake nor for any loss or damage including without limitation to any loss of profit which may arise from reliance on any information supplied by TFA Global Pte Ltd.
The speaker(s) is neither an employee, agent nor representative of Tradu and is therefore acting independently. The opinions given are their own, constitute general market commentary, and do not constitute the opinion or advice of Tradu or any form of personal or investment advice. Tradu neither endorses nor guarantees offerings of third-party speakers, nor is Tradu responsible for the content, veracity or opinions of third-party speakers, presenters or participants.
USDCHF trade ideas

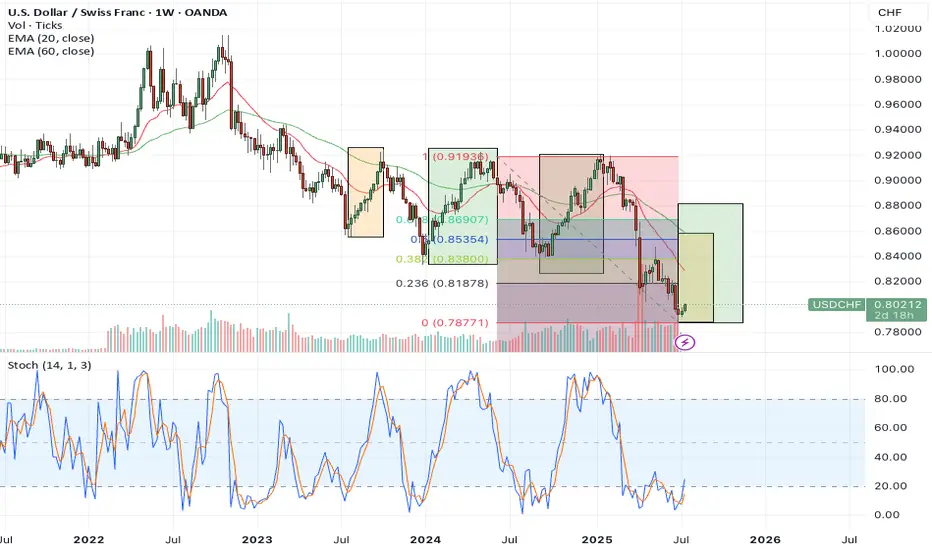
USDCHF is due for reboundThe USDCHF is showing some interesting signs that a rebound could be on the horizon. Looking at the weekly chart, it's clear that the pair has been under considerable selling pressure—it's not only dipped below the 20-period and 60-period EMAs, but it's also trading in territory that historically marks previous turning points. When USDCHF reaches these oversold levels, there's often a technical bounce as sellers run out of steam and bargain-hunters step in.
Another point worth highlighting is the Fibonacci retracement. The technicals suggest a key rebound target around the 0.8535 level, which aligns with the 50% retracement from the last major swing down. This area isn't just a mathematical target—it also coincides with previous congestion and resistance zones, making it a logical place for bulls to aim for. So, with prices oversold, historical patterns favoring a longer rebound, and a clear technical target overhead, the pieces are falling into place for a USDCHF recovery heading into the autumn months.
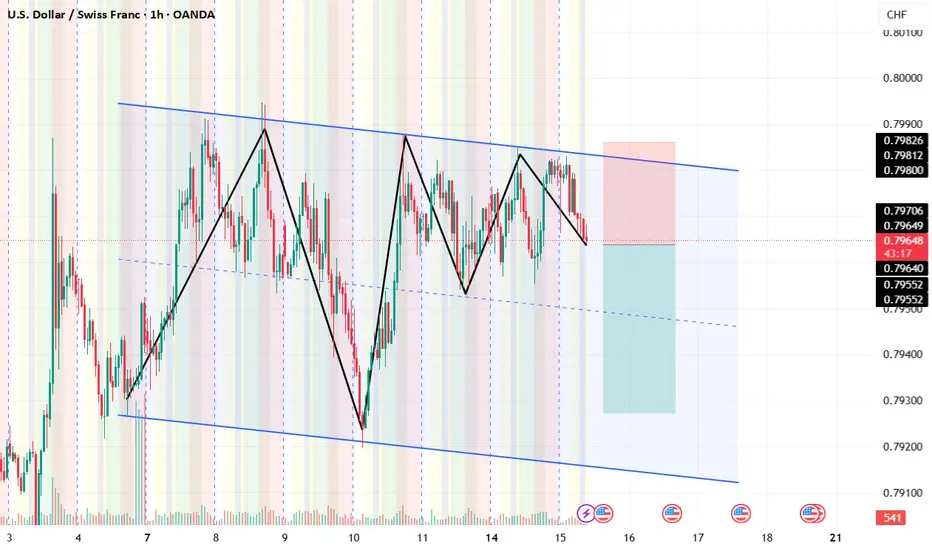
long-term bearish trendUSD/CHF is in a strong long-term bearish trend, and the recent move up is likely a temporary correction, not a reversal. Price is currently testing the 0.7980–0.8000 resistance zone, which aligns with the upper boundary of a descending channel and could attract sellers. Unless the pair breaks and holds above 0.8050–0.8100, the bearish trend remains intact. A rejection in this area or a break below 0.7870 would confirm continuation to lower targets like 0.7790 and 0.7710. In short, it's a good setup to consider a sell, but wait for clear bearish confirmation.
USDCHF Wave Analysis – 15 July 2025
- USDCHF reversed from support zone
- Likely to rise to resistance level 0.8055
USDCHF currency pair recently reversed from the support zone lying at the intersection of the support level 0.7900, lower daily Bollinger Band and the support trendline of the daily down channel from May.
The upward reversal from support zone started the active short-term ABC correction ii.
Given the strongly bullish US dollar sentiment seen today, USDCHF currency pair can be expected to rise to the next resistance level 0.8055 (former strong support from April and June).

USD CHF shortA possible scenario for USD/CHF with a good risk-to-reward ratio could be a viable setup.
A long term downside completedThe dxy is starting a long term shift of market structure a long position can hold for a year
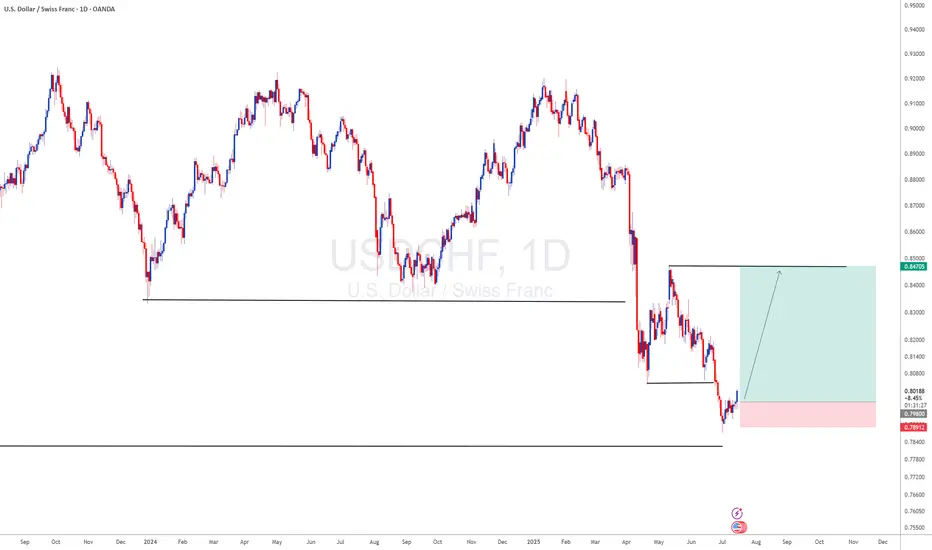
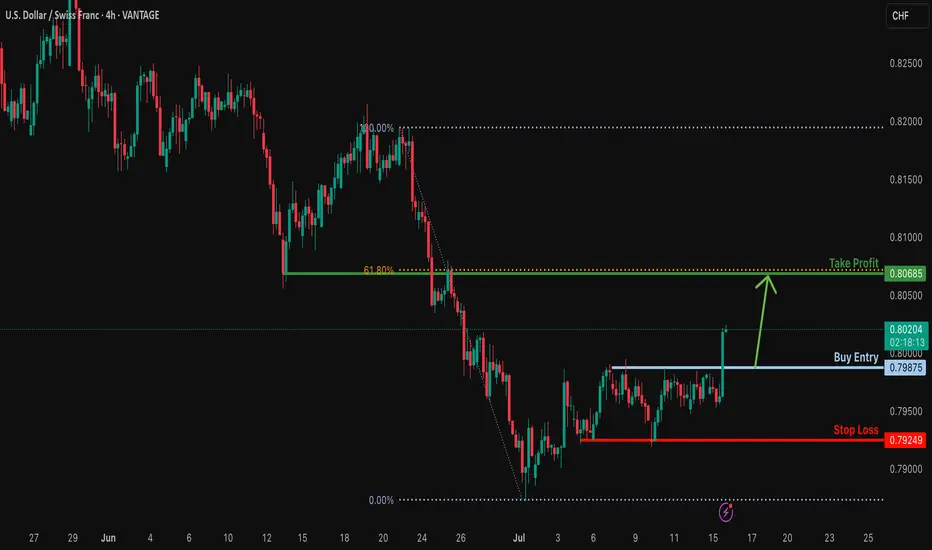
Bullish bounce?USD/CHF is falling towards the support level which is a pullback support and could bounce from this level to our take profit.
Entry: 0.7987
Why we like it:
There is a pullback support.
Stop loss: 0.7924
Why we like it:
There is a pullback support.
Take profit: 0.8068
Why we like it:
There is an overlap resistance that aligns with the 61.8% Fibonacci retracement.
Enjoying your TradingView experience? Review us!
Please be advised that the information presented on TradingView is provided to Vantage (‘Vantage Global Limited’, ‘we’) by a third-party provider (‘Everest Fortune Group’). Please be reminded that you are solely responsible for the trading decisions on your account. There is a very high degree of risk involved in trading. Any information and/or content is intended entirely for research, educational and informational purposes only and does not constitute investment or consultation advice or investment strategy. The information is not tailored to the investment needs of any specific person and therefore does not involve a consideration of any of the investment objectives, financial situation or needs of any viewer that may receive it. Kindly also note that past performance is not a reliable indicator of future results. Actual results may differ materially from those anticipated in forward-looking or past performance statements. We assume no liability as to the accuracy or completeness of any of the information and/or content provided herein and the Company cannot be held responsible for any omission, mistake nor for any loss or damage including without limitation to any loss of profit which may arise from reliance on any information supplied by Everest Fortune Group.
USD/CHF Tests Critical Resistance at 0.804FenzoFx—USD/CHF is testing the critical resistance level at 0.804, a demand zone that coincides with the descending trendline.
A new bearish wave would form if the price remains below this level. In this scenario, USD/CHF will likely retest the previous support level at 0.787.
USD/CHF: The Swiss Franc Continues to WeakenOver the past four trading sessions, the USD/CHF pair has appreciated by nearly 0.5%, as a new bullish bias has begun to consolidate on the daily chart. For now, buying pressure remains steady, supported by the recovery of the U.S. dollar, which started gaining strength shortly after it was revealed that the year-over-year CPI in the U.S. came in at 2.7%, above the 2.6% expected. This outcome may lead the Federal Reserve to adopt a more hawkish tone, and if elevated interest rates persist, it’s likely that demand for the dollar will continue to strengthen in the short term.
Downtrend Still in Place
The recent bearish movements have kept the pair within a steady downward trend in the short term. However, a relevant bullish correction is now emerging, and if it continues, it could put the current bearish structure at risk. As price continues to test resistance levels, buying pressure may become increasingly relevant.
Technical Indicators:
RSI: The RSI line is showing clear bullish behavior, with a sustained upward slope in the short term. It is currently approaching the neutral 50 level, and a breakout above that could signal bullish momentum dominance, reinforcing the current upward pressure.
MACD: The MACD histogram shows consistent bullish momentum, remaining above the neutral zero line. This suggests that moving average strength remains in bullish territory, and if the histogram continues to move away from the neutral axis, it could confirm stronger buying pressure in the short term.
Key Levels to Watch:
0.80812 – Immediate Resistance: This level aligns with the main descending trendline on the chart. Sustained movement above this zone could invalidate the current bearish structure and open the door to a more dominant bullish bias.
0.82980 – Distant Resistance: A zone that coincides with previous highs. If price consistently reaches this level, it could trigger the formation of a new bullish structure in the coming weeks.
0.79125 – Key Support: This level marks the recent weekly lows. A break below this zone could revive bearish momentum and potentially initiate a broader downward trend in the short term.
Written by Julian Pineda, CFA – Market Analyst

7.15 USD/CHF WATCH FOR A PULLBACKThis market has a VERY strong S/R zone, certainly worth keeping an eye on for the pullback and the other indicators to line up with it.........4 Hour chart is what I use for the setup then I go down to the 1 Hour chart for the entry. We will wait and see if this develops into something for us.

All I see, is sell The 4-hour candlestick has decisively broken below the 50 MA, confirming bearish momentum. Moves like this typically trigger strong selling pressure. Combined with the overall bearish market structure and a key Fibonacci resistance level sitting neatly within our stop-loss zone, this setup offers an excellent risk-to-reward trade opportunity.

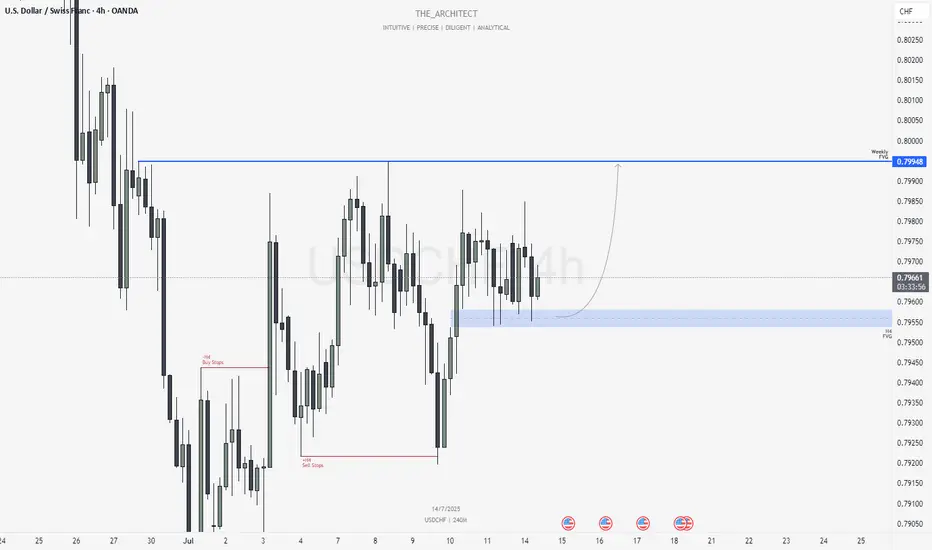
USDCHF: H4 Bullish Order Flow Targeting Weekly FVGGreetings Traders,
In today’s analysis of USDCHF, we observe that the H4 timeframe is currently delivering bullish institutional order flow. As a result, our directional bias is aligned with seeking buying opportunities that reflect this bullish momentum.
Market Context:
Higher Timeframe Objective:
The current draw on liquidity is aimed at a Weekly Fair Value Gap, which now serves as our primary upside target. Since the higher timeframe narrative is bullish, it’s essential that our intermediate timeframe—the H4—confirms this bias, which it does through consistent bullish structure.
Institutional Support Zone (H4):
As price continues to form higher highs and higher lows, it has now retraced into an H4 Fair Value Gap, functioning as an institutional support zone. Notably, this area has been retested multiple times, further reinforcing its strength and significance.
Trading Plan:
Entry Strategy:
Monitor the lower timeframes for confirmation signals within the H4 Fair Value Gap. Look for bullish price action cues before executing buy orders.
Target:
The primary objective remains the Weekly Fair Value Gap, which represents a key area of institutional interest and a likely zone for price to be drawn into.
July 13, Forex Outlook : This Week’s Blueprint to Profit!
Stay patient, follow your confirmations, and align with the flow of smart money.
Kind Regards,
The Architect 🏛️📊
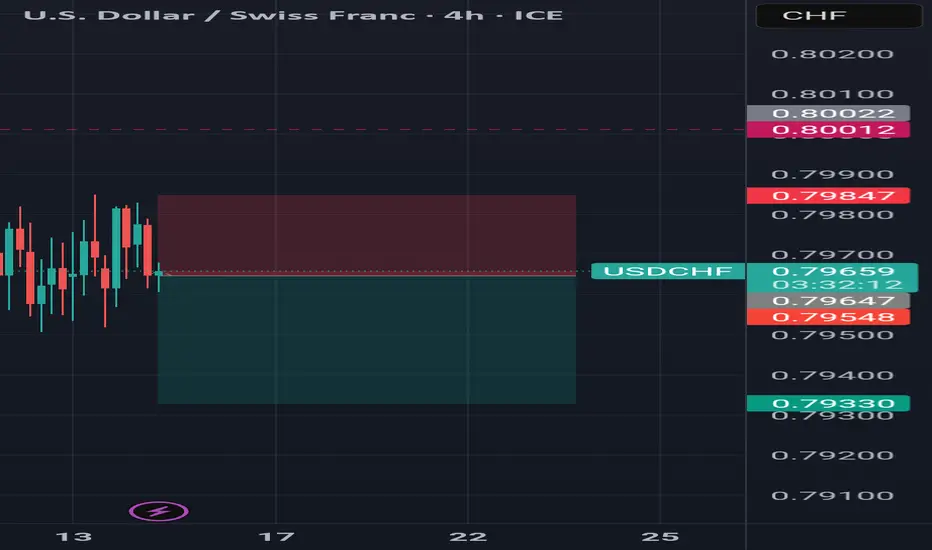
USD weakness has potential shorts on USDCHFUSD continues to show overall weakness ahead of CPI figures later today
Retests of the breakdown area on USDCHF at 0.8033-0.8048 can act as resistance on any retests
Stops should be above 0.8058
Targets can be back towards 0.7990

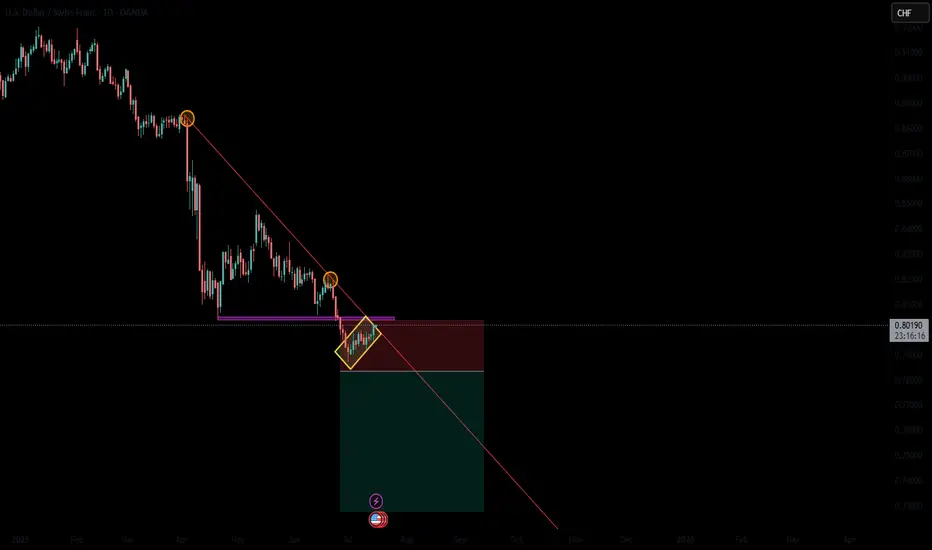
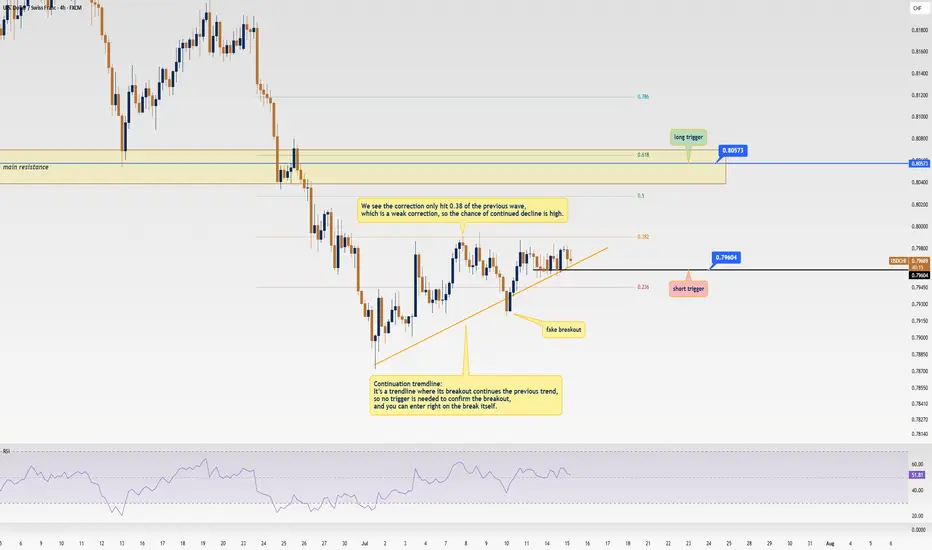
USD/CHF Update: Killer Short Trigger Ready to Pop!Welcome back, traders, it’s Skeptic from Skeptic Lab! 😎 We’ve got a juicy short trigger on USD/CHF that could deliver serious profits if it fires. Stay with me till the end to nail this trade! Let’s dive into the Daily and 4-hour timeframes for the full picture. Currently at $0.79671, here’s the play:
✔️ Daily Timeframe:
We’re in a rock-solid bearish major trend . After hitting a high of $ 0.84649 , we broke the key support at $ 0.80573 , resuming the bearish trend. A pullback to the broken $ 0.80573 level is likely, as it aligns with the 0.6 Fibonacci retracement from the prior 4-hour wave. Trading with the trend is smartest, so shorts are the focus. If you want to long, go with lower risk and close positions faster.
📊 4-Hour Timeframe (Futures Triggers):
Short Trigger: Two options here. Either enter on a trendline break (no extra trigger needed, as continuation trendlines mean the prior trend resumes on a break), or, for a safer play, short on a break of support at $ 0.79604 —this needs minimal confirmation.
Long Trigger: Wait for a break of the resistance zone at $ 0.80573 . Confirm with RSI entering overbought. Check my RSI guide ( link ) for how I use it differently—game-changing stuff!
📉 Key Insight: Stick to the bearish trend for higher-probability trades. Shorts at $0.79604 or on a trendline break are your best bet.
🔔Risk management is your lifeline—cap risk at max 1%–2% per trade to stay in the game.
I’ll catch you in the next analysis—good luck, fam! <3
💬 Let’s Talk!
Which USD/CHF trigger are you locked on? Hit the comments, and let’s crush it together! 😊 If this update lit your fire, smash that boost—it fuels my mission! ✌️
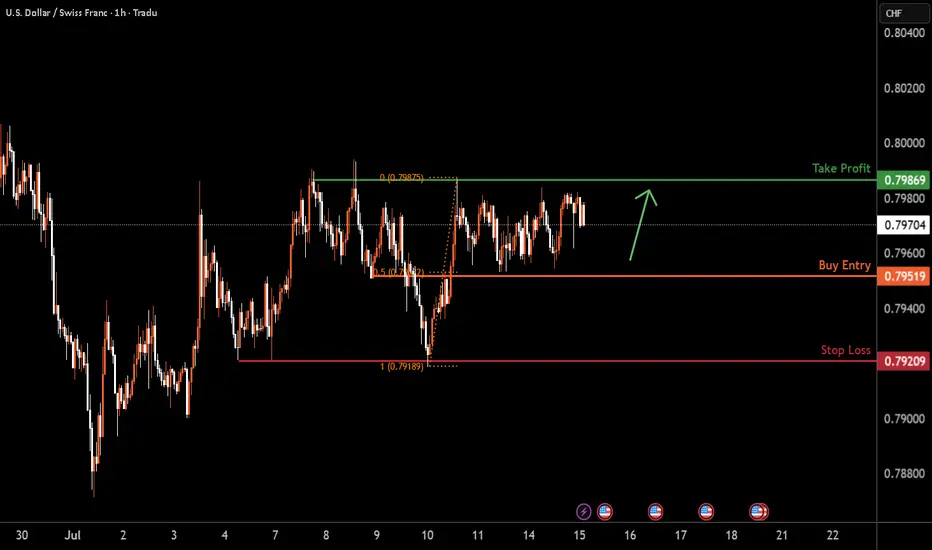
USDCHF H1 I Bullish Bounce Off the 50%Based on the H1 chart analysis, we can see that the price is falling toward our buy entry at 0.7951, which is a pullback support that aligns with the 50% Fib retracement.
Our take profit will be at 0.7986, which is a multi-swing high resistance level.
The stop loss will be placed at 0.7920, a swing low support.
High Risk Investment Warning
Trading Forex/CFDs on margin carries a high level of risk and may not be suitable for all investors. Leverage can work against you.
Stratos Markets Limited (tradu.com ):
CFDs are complex instruments and come with a high risk of losing money rapidly due to leverage. 63% of retail investor accounts lose money when trading CFDs with this provider. You should consider whether you understand how CFDs work and whether you can afford to take the high risk of losing your money.
Stratos Europe Ltd (tradu.com ):
CFDs are complex instruments and come with a high risk of losing money rapidly due to leverage. 63% of retail investor accounts lose money when trading CFDs with this provider. You should consider whether you understand how CFDs work and whether you can afford to take the high risk of losing your money.
Stratos Global LLC (tradu.com ):
Losses can exceed deposits.
Please be advised that the information presented on TradingView is provided to Tradu (‘Company’, ‘we’) by a third-party provider (‘TFA Global Pte Ltd’). Please be reminded that you are solely responsible for the trading decisions on your account. There is a very high degree of risk involved in trading. Any information and/or content is intended entirely for research, educational and informational purposes only and does not constitute investment or consultation advice or investment strategy. The information is not tailored to the investment needs of any specific person and therefore does not involve a consideration of any of the investment objectives, financial situation or needs of any viewer that may receive it. Kindly also note that past performance is not a reliable indicator of future results. Actual results may differ materially from those anticipated in forward-looking or past performance statements. We assume no liability as to the accuracy or completeness of any of the information and/or content provided herein and the Company cannot be held responsible for any omission, mistake nor for any loss or damage including without limitation to any loss of profit which may arise from reliance on any information supplied by TFA Global Pte Ltd.
The speaker(s) is neither an employee, agent nor representative of Tradu and is therefore acting independently. The opinions given are their own, constitute general market commentary, and do not constitute the opinion or advice of Tradu or any form of personal or investment advice. Tradu neither endorses nor guarantees offerings of third-party speakers, nor is Tradu responsible for the content, veracity or opinions of third-party speakers, presenters or participants.
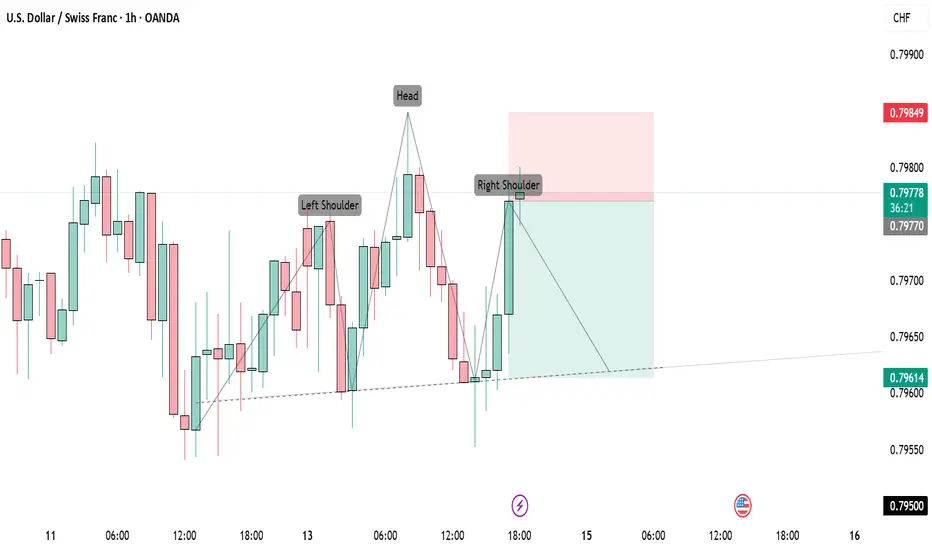
Sell USDCHFShort scalp on USDCHF. Trading what I see now, and I see a head and shoulder pattern. Let's risk and see how it goes.
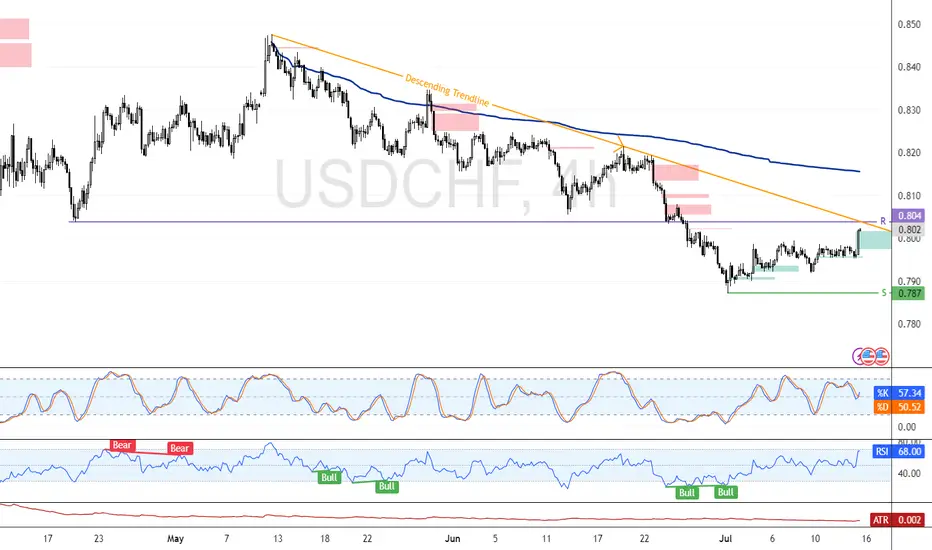
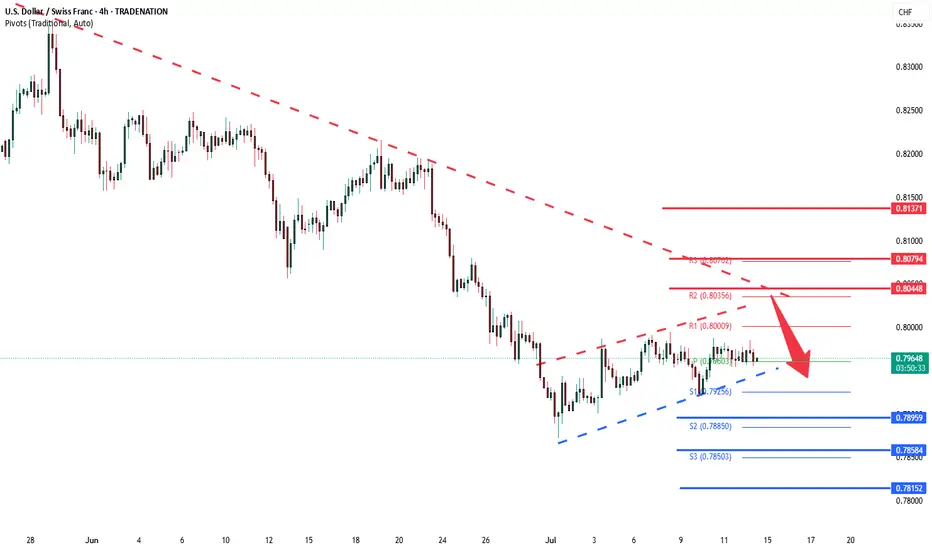
USDCHF downtrend capped by resistance at 0.8045The USD/CHF pair is currently trading with a bearish bias, aligned with the broader downward trend. Recent price action shows a retest of the falling resistance, suggesting a temporary relief rally within the downtrend.
Key resistance is located at 0.8045, a prior consolidation zone. This level will be critical in determining the next directional move.
A bearish rejection from 0.8045 could confirm the resumption of the downtrend, targeting the next support levels at 0.7900, followed by 0.7860 and 0.7810 over a longer timeframe.
Conversely, a decisive breakout and daily close above 0.8045 would invalidate the current bearish setup, shifting sentiment to bullish and potentially triggering a move towards 0.8080, then 0.8140.
Conclusion:
The short-term outlook remains bearish unless the pair breaks and holds above 0.8045. Traders should watch for price action signals around this key level to confirm direction. A rejection favours fresh downside continuation, while a breakout signals a potential trend reversal or deeper correction.
This communication is for informational purposes only and should not be viewed as any form of recommendation as to a particular course of action or as investment advice. It is not intended as an offer or solicitation for the purchase or sale of any financial instrument or as an official confirmation of any transaction. Opinions, estimates and assumptions expressed herein are made as of the date of this communication and are subject to change without notice. This communication has been prepared based upon information, including market prices, data and other information, believed to be reliable; however, Trade Nation does not warrant its completeness or accuracy. All market prices and market data contained in or attached to this communication are indicative and subject to change without notice.
USDCHFOne key factor in my trading style is adapting to market structure, primarily guided by the daily time frame. However, when I analyze lower time frames, I often spot potential shifts to the upside—that's the immediate trend I focus on. While I’m fully aware that overall momentum remains bearish, I understand that for the market to move downward, it first needs liquidity. That’s why I target zones where buyers get trapped.
The difference between me and most buyers is that I know exactly where to exit before the overall trend takes control. From now on, I’ve learned that I’m rarely wrong about the market’s direction—just wrong about my stop loss placement. It’s clear they hunt stop losses, so my strategy now is using minimal risk with wider stop losses.

USDCHF SHORT TRADE PLANThe pair is trading in a bearish trend. It started a correction move after reaching a strong key zone and from this area the price may start the bearish rally again.
Please do your own analysis before placing any trades.
Cheers and Happy Trading !!!!
USDCHF | DOWNTREND CONTINUATIONUSDCHF seems to be in bearish continuation since it has not exhibited bullish divergence on RSI.

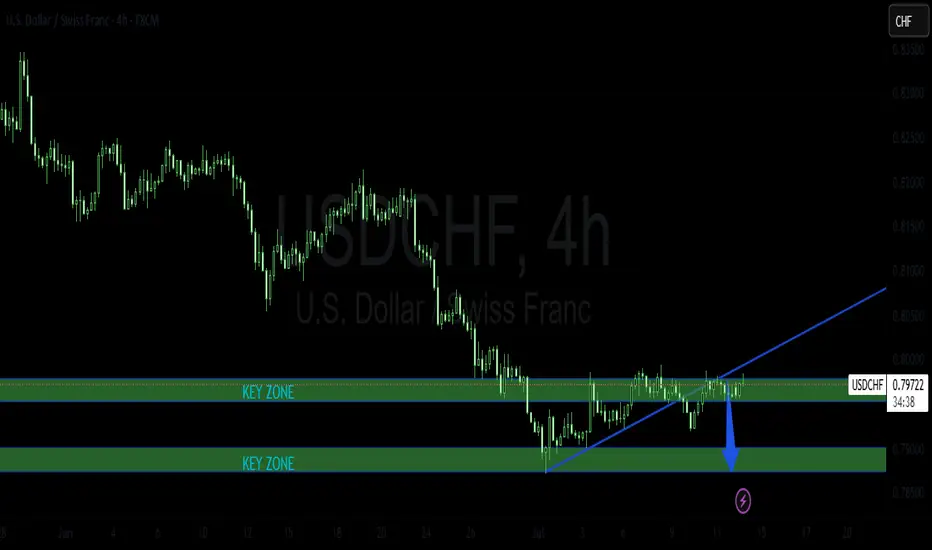
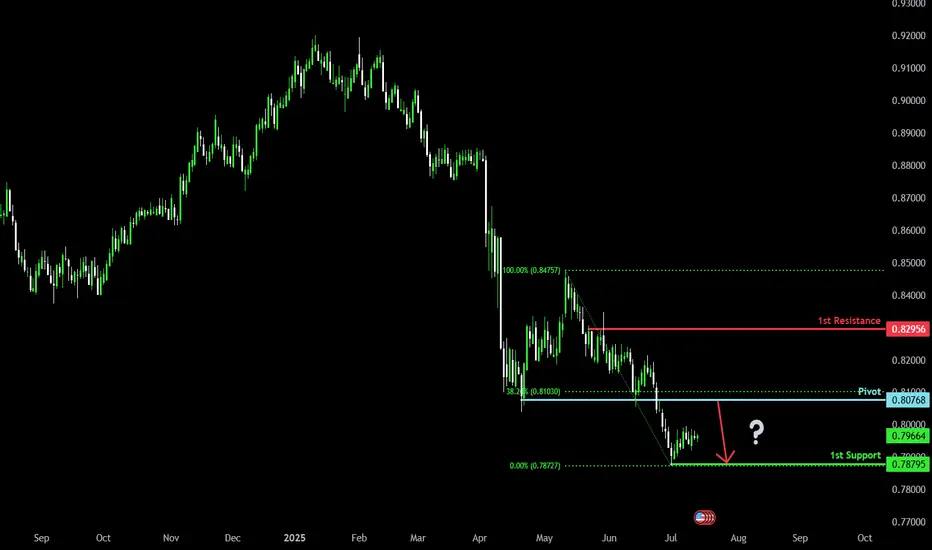
Bearish reversal off pullback resistance?The Swissie (USD/CHF) is rising towards the pivot, which is a pullback resistance that lines up with the 38.2% Fibonacci retracement and could reverse to the 1st support.
Pivot: 0.8076
1st Support: 0.7879
1st Resistance: 0.8295
Risk Warning:
Trading Forex and CFDs carries a high level of risk to your capital and you should only trade with money you can afford to lose. Trading Forex and CFDs may not be suitable for all investors, so please ensure that you fully understand the risks involved and seek independent advice if necessary.
Disclaimer:
The above opinions given constitute general market commentary, and do not constitute the opinion or advice of IC Markets or any form of personal or investment advice.
Any opinions, news, research, analyses, prices, other information, or links to third-party sites contained on this website are provided on an "as-is" basis, are intended only to be informative, is not an advice nor a recommendation, nor research, or a record of our trading prices, or an offer of, or solicitation for a transaction in any financial instrument and thus should not be treated as such. The information provided does not involve any specific investment objectives, financial situation and needs of any specific person who may receive it. Please be aware, that past performance is not a reliable indicator of future performance and/or results. Past Performance or Forward-looking scenarios based upon the reasonable beliefs of the third-party provider are not a guarantee of future performance. Actual results may differ materially from those anticipated in forward-looking or past performance statements. IC Markets makes no representation or warranty and assumes no liability as to the accuracy or completeness of the information provided, nor any loss arising from any investment based on a recommendation, forecast or any information supplied by any third-party.
posible scenario for usd chf we have jobless clame news coming out so we may not trade this but its a good looking setup
