EURUSD market structure analysis on M15, H1 timeframesH1 Timeframe – Main Trend: BULLISH
🟢 Current Situation:
The H1 structure is showing a clear sequence of Higher Highs (HH) and Higher Lows (HL) ⇒ indicating an uptrend.
The market is currently in a retracement phase following the last bullish impulse.
Price is approaching a demand zone from a previous structure, where buy orders may be stacked.
📉 M15 Timeframe – Main Trend: BEARISH (within H1 pullback)
🔍 Current Observations:
While H1 is in a retracement, M15 shows a clear bearish market structure (Lower Lows – Lower Highs).
However:
Price has tapped into the H1 demand zone.
A liquidity grab (sweep of highs/lows) just occurred on M15.
This was followed by a Break of Structure (BOS) to the upside ⇒ signaling potential absorption of sell-side liquidity and a reversal in alignment with the higher timeframe (H1).
USDEUR trade ideas
EURUSD--LONG--02_08_25--strong reaction from monthly support around 1.14142
--price will move higher towards 1.17019
--best entry is between 1.15585 and 1.15619

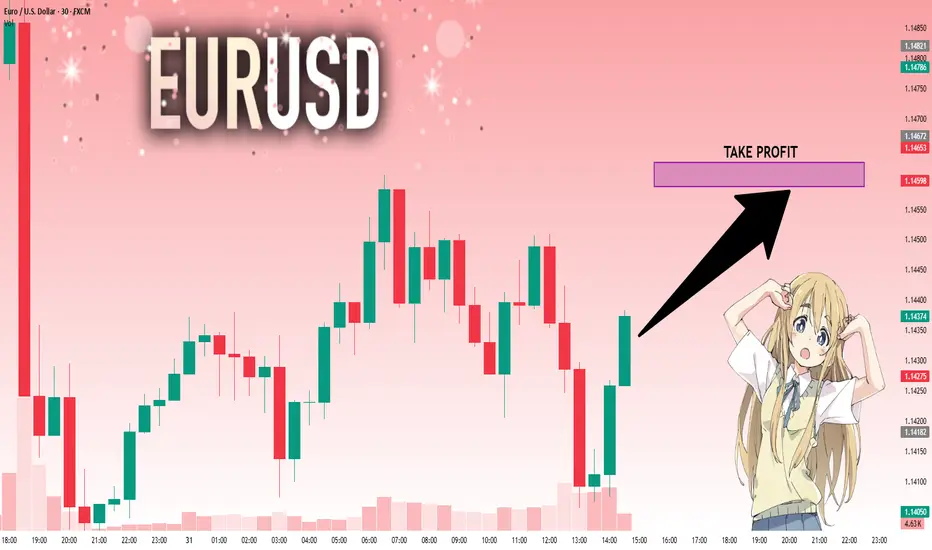
EURUSD: The Market Is Looking Up! Long!
My dear friends,
Today we will analyse EURUSD together☺️
The price is near a wide key level
and the pair is approaching a significant decision level of 1.14350 Therefore, a strong bullish reaction here could determine the next move up.We will watch for a confirmation candle, and then target the next key level of 1.14588.Recommend Stop-loss is beyond the current level.
❤️Sending you lots of Love and Hugs❤️
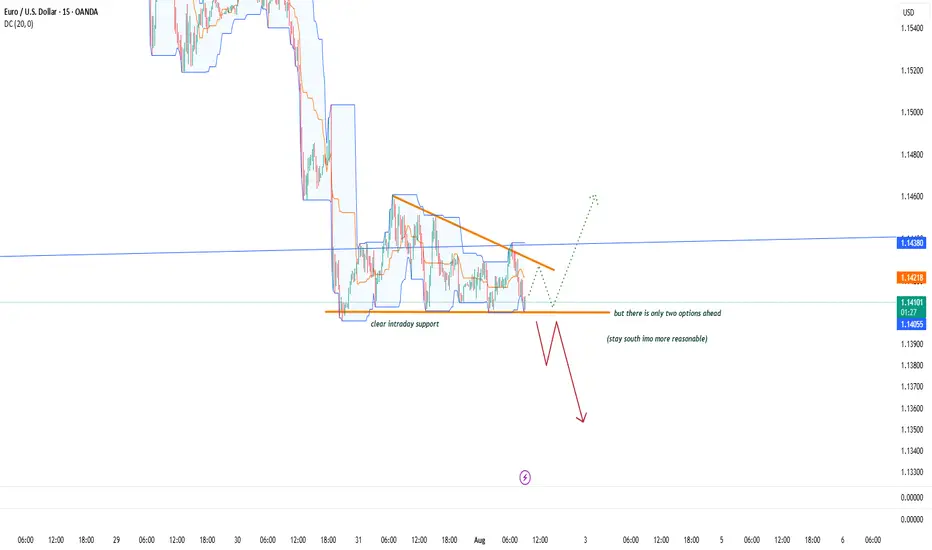
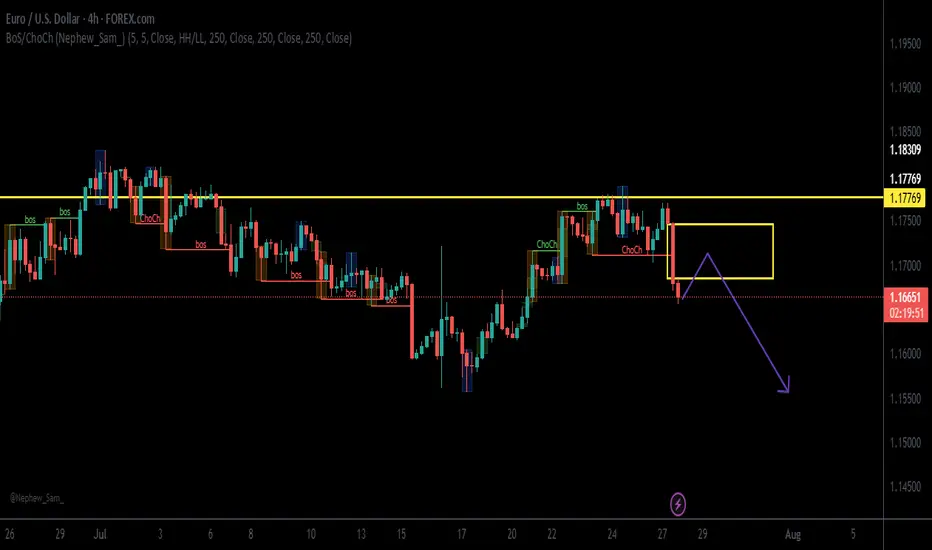
Levels im interested on EU | Price Action BreakdownHere's my current view on EURUSD I’m watching a few key zones based on structure, previous liquidity grabs, and confluences lining up this week.
Short-term price expectations
Educational purpose only this is not financial advice.


EURUSD First of August The information and publications are not meant to be, and do not constitute, financial, investment, trading, or other types of advice or recommendations.
Have a nice w/e ahead.
EURUSD Sell Explained...+100 pips, 3 TPS, 1 StrategyHey Rich Friends,
Happy Wednesday. I wanted to updated you on the EURUSD sell idea I posted a few days ago:
All of my TPs were hit and I was able to secure more than 100 pips in this trade.
Here is a synopsis of my strategy:
- Draw support and resistance lines on 2-3 time frames
- Wait for a break of structure above or below previous support or resistance to enter
- Check confirmations on the stochastic (buy = if stoch is facing up and the blue line is on top. sell = if stoch is facing down and the orange line is on top)
I will make a full strategy video soon, but that is basically it. I follow the same process over and over again because it works.
If this video was helpful or you have any questions, let me know below in the comments.
Peace and Profits,
Cha

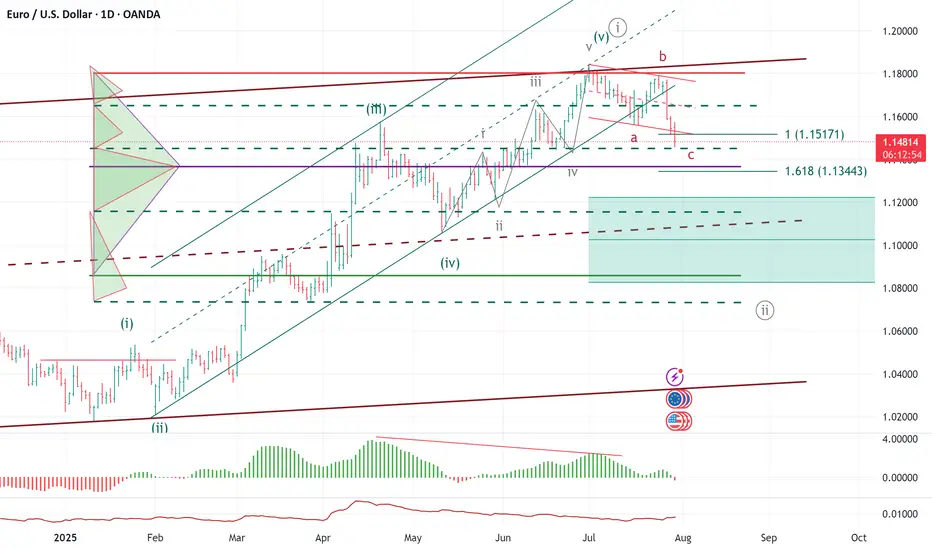
ELLIOTT WAVE EURUSD Daily update
EW Trade Set Up daily
minute ((i)) seems finished
H4 scenario 210725:
the price upward movement from 1.1557 area on 17/07/25 has broken decisively 1.1684-1.1705 area but it had not the
strenght to go further so that the lagging span (green line) could break upward the leading span B (red line).
A decrescent high has been registered at 1.1800 area on 24/07/25.
In this new scenario it looks like that the impulsive movement that started from 1.0180 on 13/01/25
finisced at 1.1834 on 010725 in the minute wave (i). (EWO divergence, break down of the upward (ii)/(iv) channel).
So i have to register that a correction to minute wave ((ii) has started
key levels VP area
1.1800
1.1370 POC
1.0850
note :
monitor the price reaction at any supports level: VP area and LVN
EURUSDEUR/USD Exchange Rate
Current Rate: About 1.1525
Government Bond Yields
U.S. 10-Year Treasury Yield: 4.328%
Eurozone 10-Year Government Bond Yield: Last reported at 2.686%
Economic Data Reports for Today
U.S. Data:
1:15pm
USD
ADP Non-Farm Employment Change
82K -33K
1:30pm
USD
Advance GDP q/q
2.4% -0.5%
USD
Advance GDP Price Index q/q
2.3% 3.8%
3:00pm
USD
Pending Home Sales m/m
0.3% 1.8%
3:30pm
CAD
BOC Press Conference
USD
Crude Oil Inventories
-3.2M
7:00pm
USD
Federal Funds Rate
4.50% 4.50%
USD
FOMC Statement
7:30pm
USD
FOMC Press Conference
Market Focus Today: The Federal Reserve announces its policy decision.
Eurozone Data:
GDP Growth (Q2): Eurostat reports second-quarter growth at 0.1% quarter-on-quarter (QoQ) and 1.4% year-on-year (YoY). Germany and Italy contracted by 0.1% QoQ, France rose 0.3%, and Spain outperformed at 0.7%.
Outlook: The Eurozone economy faces headwinds from new U.S. tariffs and tepid industrial output, though Q2 was somewhat better than feared.
Current Interest Rates
Area Main Rate (July 2025) Policy Outlook
U.S. 4.25% – 4.50% Fed expected to hold steady
EU 2.15% (main refi rate) ECB in data-dependent pause
2.00% (deposit rate)
U.S.: The Federal Reserve is widely expected to hold rates in the 4.25%–4.50% range at today's FOMC meeting, reflecting a cautious approach in light of current growth and inflation figures.
Eurozone: The ECB last held its main refinancing rate at 2.15% and the deposit facility at 2.00% as of the July 24, 2025 meeting, emphasizing a meeting-by-meeting, data-driven stance.
Key Takeaways
EUR/USD is subdued just above 1.15 as the euro weakens on modest Eurozone growth and broad dollar strength ahead of the Fed.
10-year yields remain elevated in both regions, reflecting stable but cautious outlooks.
Today’s U.S. and ECB meetings/data are critical: Markets are watching for central bank reactions to new economic data and the ongoing effects of tariffs and global uncertainty.
This overview captures the most significant developments relevant to currency, rates, bonds, and economic trends for July 30, 2025.
#EURUSD #DOLLAR #EURO

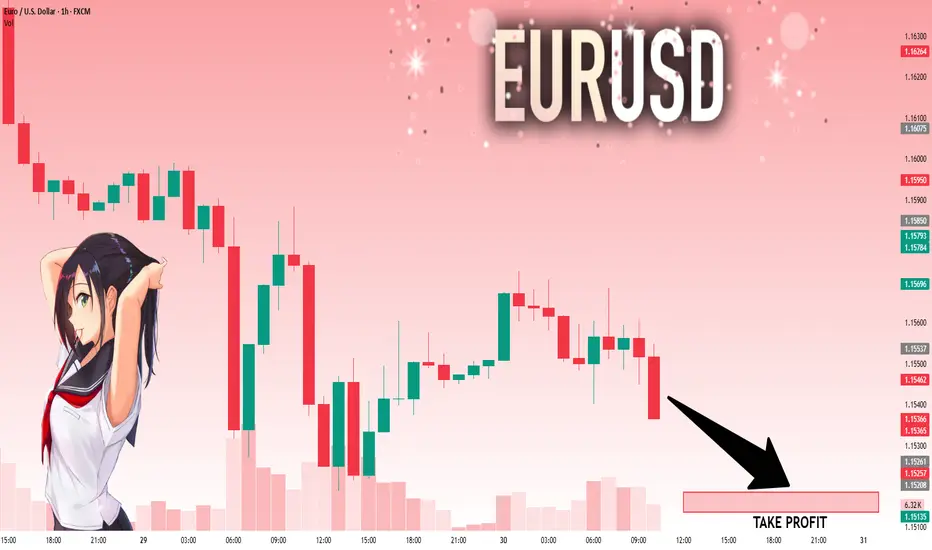
EURUSD: Target Is Down! Short!
My dear friends,
Today we will analyse EURUSD together☺️
The price is near a wide key level
and the pair is approaching a significant decision level of 1.15428 Therefore, a strong bearish reaction here could determine the next move down.We will watch for a confirmation candle, and then target the next key level of 115186..Recommend Stop-loss is beyond the current level.
❤️Sending you lots of Love and Hugs❤️
EURUSD has formed a double top patternOn the daily chart, EURUSD has formed a double top pattern. Currently, attention should be paid to the resistance around 1.1600. If the rebound does not break through, it is expected to continue to fall. The support below is around 1.1450. If it falls below, the support below is around 1.1370.

EURUSD BUYEUR/USD retreats below 1.1550 ahead of US data
EUR/USD finds it difficult to stage a rebound following Monday's sharp decline and trades in negative territory below 1.1550 on Tuesday. The US Dollar (USD) preserves its strength ahead of consumer sentiment and employment-related data releases, weighing on the pair.
From a technical point of view, the EUR/USD pair is poised to extend its slump. It keeps falling below a mildly bearish 20 Simple Moving Average (SMA), which provides dynamic resistance at around 1.1690. The 100 SMA, in the meantime, maintains its bullish slope, albeit partially losing its upward strength at around 1.1340. Finally, technical indicators keep heading south well below their midlines, and at multi-week lows, in line with a bearish extension ahead.
The near-term picture shows EUR/USD is oversold and may bounce or consolidate before the next directional move. In the 4-hour chart, technical indicators turned flat at extreme levels, yet it keeps developing below all its moving averages, which skews the risk to the downside. A firmly bearish 20 SMA is crossing below the 100 SMA and aims to extend its slide below a directionless 200 SMA, usually a sign of prevalent selling interest.
SUPPORT 1.15566
SUPPORT 1.15819
SUPPORT 1.15566
RESISTANCE 1.15114

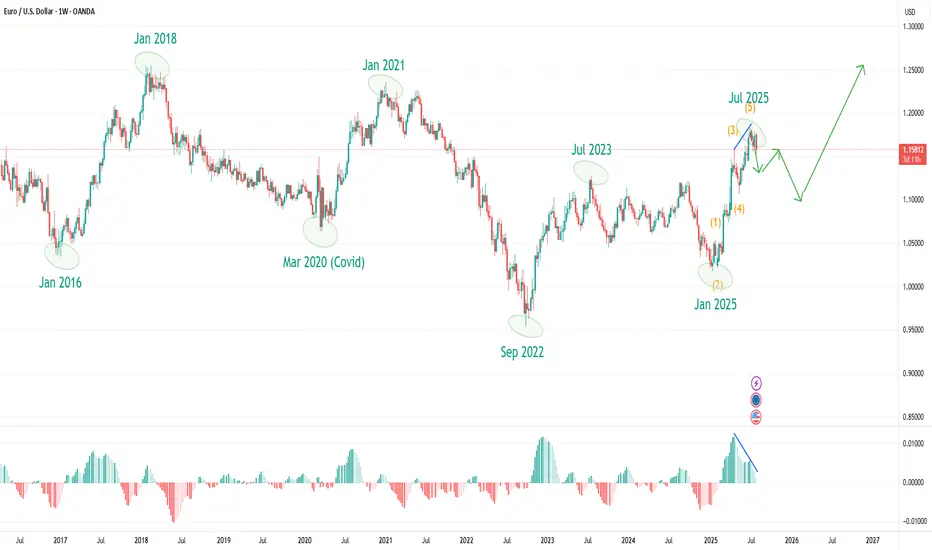
EUR/USD: Is the Next Big Correction Already Underway?EUR/USD: After 120 Days Up, Are We Entering a Year-Long Correction? What Market Cycles Reveal.
As EUR/USD traders digest the stunning 120-day, five-wave rally from the January 2025 lows to the July 2025 highs, the big question now is—what's next? The clues are right in front of us, and they suggest we may be headed into an extended corrective phase, one that could last until the very start of 2026.
What the Current Structure Shows
Motive Wave Complete: The impulsive surge just wrapped up a textbook five-wave move, with each leg unfolding cleanly and culminating in a July top. Motive waves like this are the engines of market trends—fast-moving, decisive, and packed with momentum.
Corrective Phase Incoming: But all trends eventually pause, and here the evidence points to a shift. Corrective waves—unlike their trending counterparts—are time-consuming, choppy, and have a tendency to frustrate impatient traders. The completed motive wave took just 120 days, but corrections often take much longer to play out. According to this chart, the probable timeline for this correction extends into December 2025, or possibly beyond.
Why the Count Is Labelled This Way
Wave Duration Clue: One of the most reliable Elliott Wave principles is that corrective phases outlast the sharp, high-energy motive moves that precede them. With the motive wave spanning four months, a comparable correction stretching into late 2025 makes perfect structural sense.
Cycle Awareness, Major Turning Points, and MACD Divergence:
Flip to the weekly turning points chart, and a deeper pattern emerges: Major EUR/USD direction changes consistently cluster around the start of a new year, with minor tops and bottoms often forming near mid-year. Over the last eight years, six out of seven major pivots have landed at those cycle pivots.
Notably, if you look at the weekly chart’s MACD, there’s now a clear bearish divergence—while price clocked new highs into July, the MACD failed to confirm, rolling over and diverging lower. This kind of momentum divergence at a major turning point is classic for trend exhaustion and aligns perfectly with the idea that a correction is not only likely, but perhaps overdue.
This powerful confluence—timing, price structure, and momentum—underscores just how much “cycle” and structure awareness can add to your trading playbook.
What to Watch Next (Trade Planning)
Timing the Correction: If the correction follows historical precedent, expect sideways or choppy price action well into Q4 2025, with the next big directional opportunity around the calendar turn into 2026.
Cycle-Based Strategies: Recognising these cycles lets you prepare for reversals, especially if price is diverging from the MACD at those major timing windows.
Structure > Prediction: The motive phase is where you ride the trend; cycles, structure, and momentum help you avoid exhaustion traps and see when patience is required.
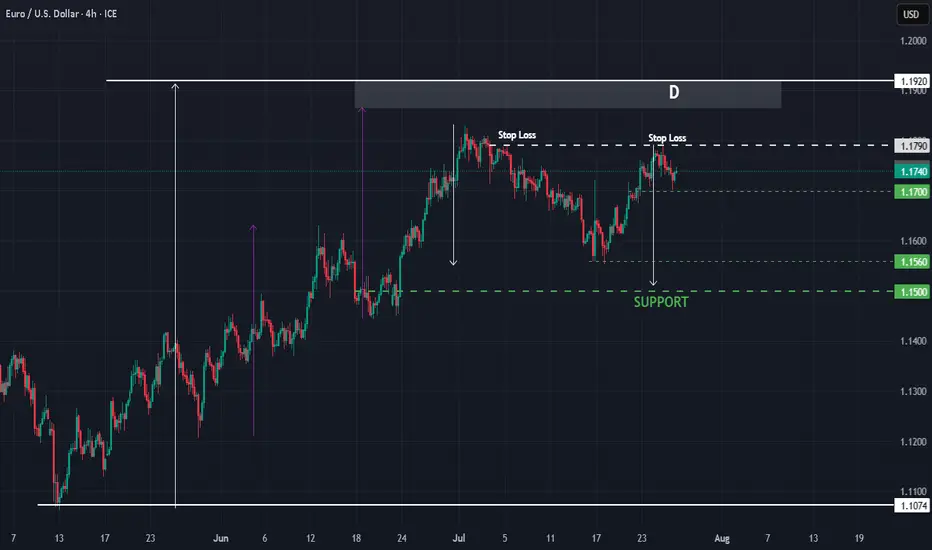
EURUSD : Status @ 25/7Direction: Sell
Signal triggered: 25/7/2025
Stop when:
a) Stop Loss @ 1.1790; or if
b) Buy signal triggered
Action:
Sell the rally
Good luck.
P/S: It seems that 1.1790 is a good resistance line as anticipated. The price may reach as low as 1.1500, which will serve as the next support level. Then we wait there for the next sell or maybe buy signal!
And a BIG congratulation to those who sold @ D - 1.1780 :-)
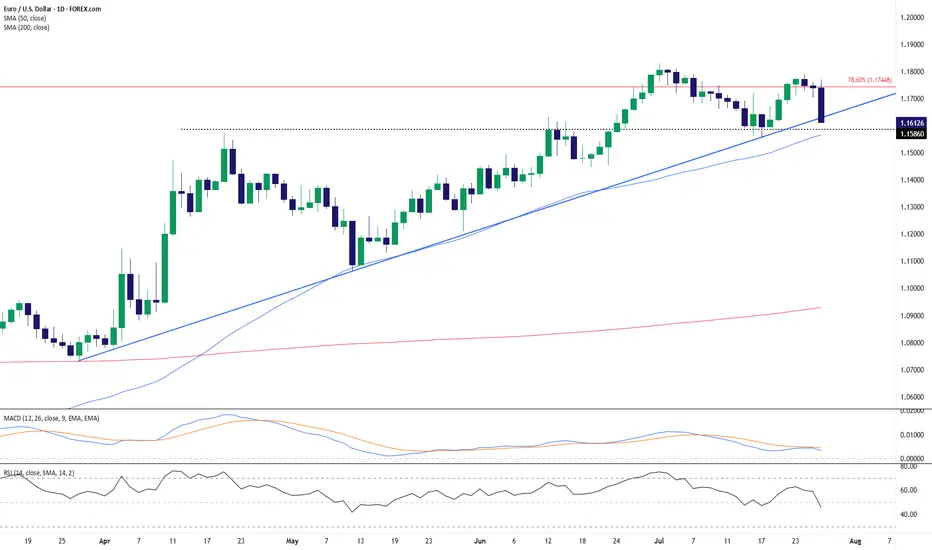
EUR/USD: Breakdown From Key Fib Confluence Threatens UptrendEUR/USD has snapped a key confluence zone after rejecting the 78.6% Fibonacci retracement level near 1.1745. The latest daily candle shows a sharp bearish engulfing bar that sliced below both the ascending trendline and the 50-day SMA (1.1565), signaling a potential trend reversal or deeper correction.
This breakdown follows a multi-week uptrend, and momentum indicators are starting to confirm the bearish shift:
MACD is showing a bearish crossover below the signal line.
RSI has dropped below 50 (currently around 45.8), reflecting weakening bullish momentum.
The pair has now settled just above horizontal support near 1.1586. A decisive close below this level could open the door toward the next support zone around 1.1450–1.1500, where prior consolidation and the rising 200-day SMA (1.0929) may act as stronger demand.
Bulls will need to reclaim the 1.1650–1.1700 zone and see a bullish crossover on momentum indicators to regain control. Until then, the path of least resistance appears tilted to the downside, especially with trendline and Fib support now breached.
Bias: Bearish while below 1.1700. Watch for continuation lower if 1.1586 fails to hold.
-MW
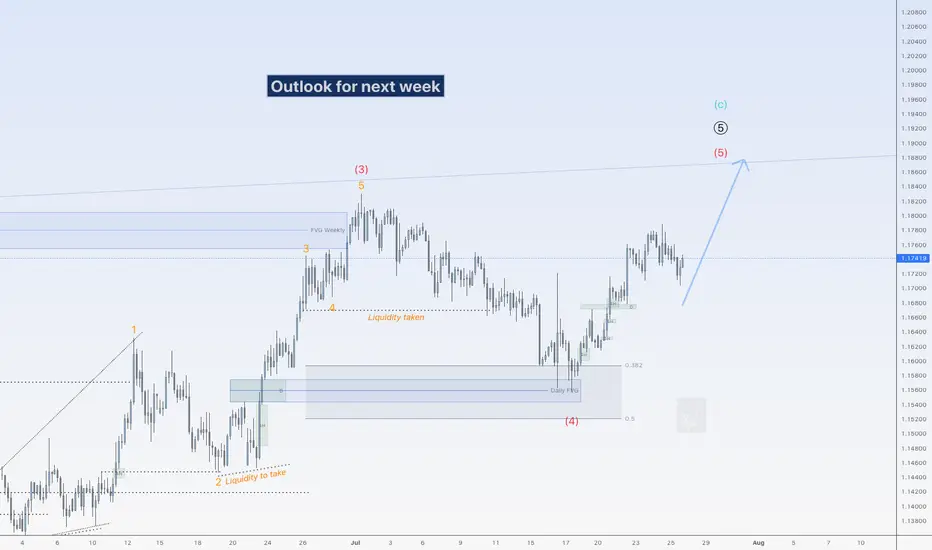
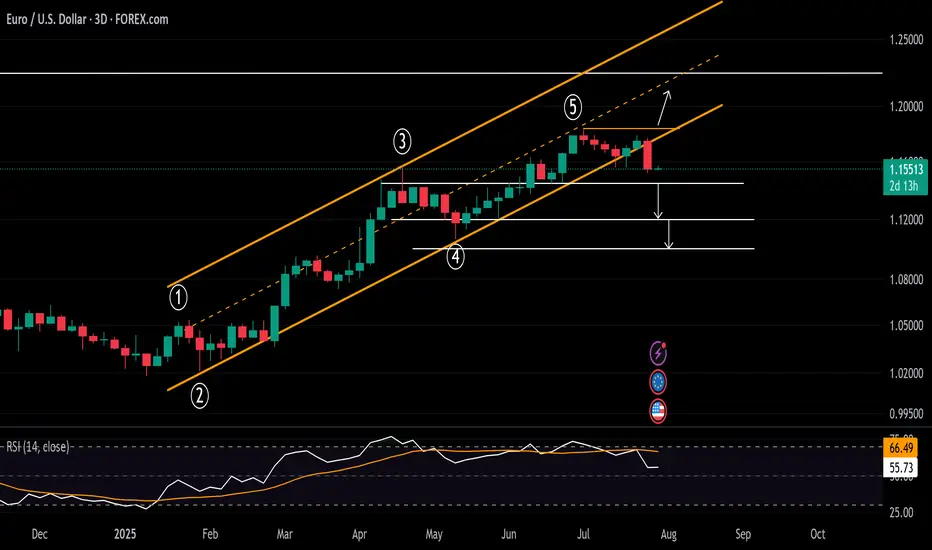
More upside for EUHi traders,
Last week EU went higher for the start of the next (impulsive or corrective) wave up as expected.
Next week we could see price go higher to finish (red) wave 5 but price is slowing down.
So the next big impulsive wave down is coming soon.
Let's see what the market does and react.
Trade idea: Wait for the finish of a correction down and a change in orderflow to bullish on a lower time frame to trade longs.
NOTE: the next three weeks I'm on holiday and I will not post any outlook during this period publicly.
If you want to learn more about trading with FVG's, liquidity sweeps and Wave analysis, then make sure to follow me.
This shared post is only my point of view on what could be the next move in this pair based on my technical analysis.
Don't be emotional, just trade your plan!
Eduwave
EURUSD - Short Term Setup Could Trigger MAJOR ReversalThis bounce is likely to be a connective wave into another wave down.
In the video I break down a classic algo driven liquidity sweep just above the 0.786 retracement.
This signals potential reversal.
Stop loss placement depends on how aggressive you want to be with margin.
Tighter risk gives more upside potential with defined exposure.
Invalidation of potential retracement failure swing @ $1.18.
If this unfolds on a higher timeframe, it could develop into a heavy-hitting move.
I'm layering shorts through this area, as discussed in the video.
Trade executed on Pepperstone CFD 👍.
This analysis is shared for educational purposes only and does not constitute financial advice. Please conduct your own research before making any trading decisions.

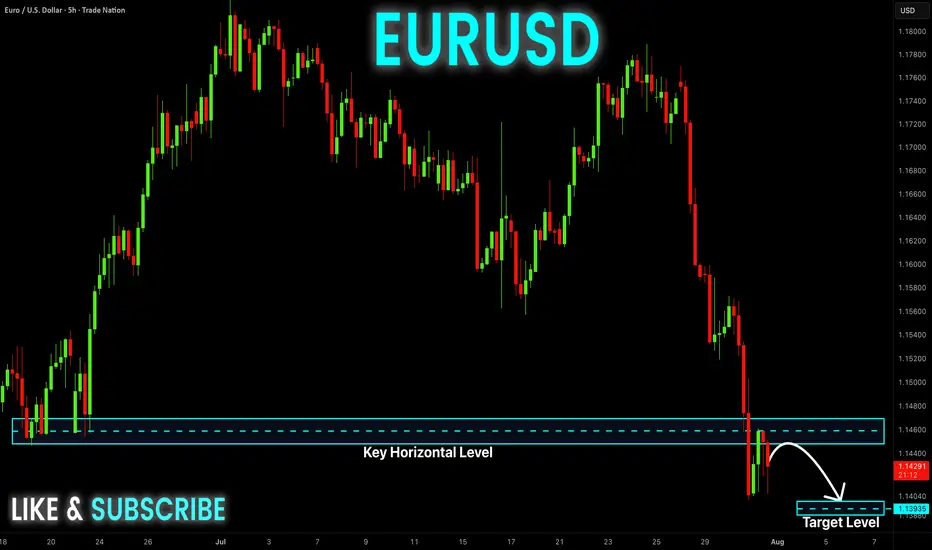
EUR-USD Bearish Breakout! Sell!
Hello,Traders!
EUR-USD made a bearish
Breakout of the key horizontal
Level of 1.1460 then made
A retest and a pullback so
We are bearish biased and
We will be expecting a
Further bearish continuation
Sell!
Comment and subscribe to help us grow!
Check out other forecasts below too!
Disclosure: I am part of Trade Nation's Influencer program and receive a monthly fee for using their TradingView charts in my analysis.
DXY Rebound Pulls EURUSD Below 1.16Following the DXY’s significant rebound off a 17-year trendline, the EURUSD has broken below a trendline that connected all consecutive lows of 2025. This opens the door to further bearish risks, with key support levels now in sight.
If the pair closes cleanly below 1.15, 1.1440 and 1.1380, downside extensions could reach 1.12 and 1.11, respectively.
On the upside, a close back above the 2025 trendline and the 1.18 mark could reinstate bullish momentum, potentially lifting the pair toward the 2021 highs between 1.20 and 1.23.
Written by Razan Hilal, CMT
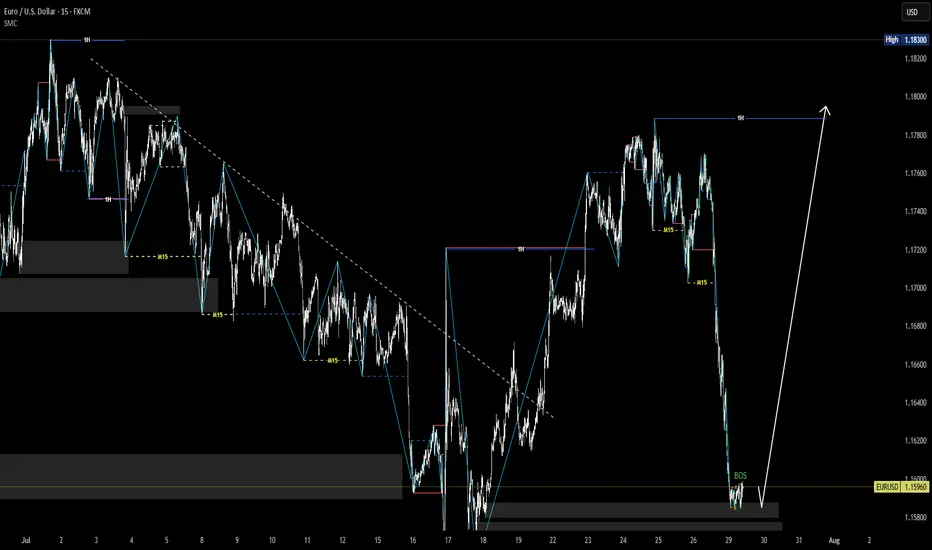
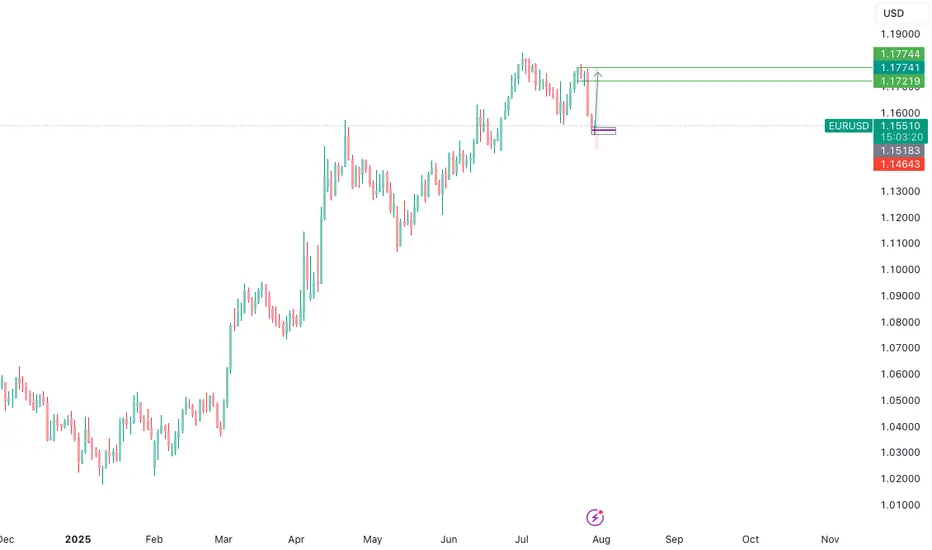
EURUSD Long Setup – Liquidity Sweep + Distribution Opportunity**📍 EURUSD Long Setup – Liquidity Sweep + Distribution Opportunity**
Currently monitoring EURUSD as price consolidates near a potential short-term demand zone. The recent price action suggests that we may observe a **liquidity grab below previous session lows**, possibly during the **London session**, before a directional move.
My focus remains on **how New York session will react** — potentially stepping in as a **distribution phase**, which could initiate the bullish leg toward the upper imbalance zones.
Key confluences:
* Anticipated liquidity below previous session lows (Asia & London).
* Bullish FVG aligned with higher timeframe structure.
* Targets at **1.17219** and extension toward **1.17744**, matching daily imbalance and previous supply area.
Patience is key here. Waiting for **clear confirmation post-sweep**, ideally via a CHoCH or bullish engulfing on the lower timeframe, before executing.
`DO NOT USE THIS AS SIGNAL OR ANY OF A KIND´
Emerson Massawe
COO | FINANCIAL MARKET ANALYST|
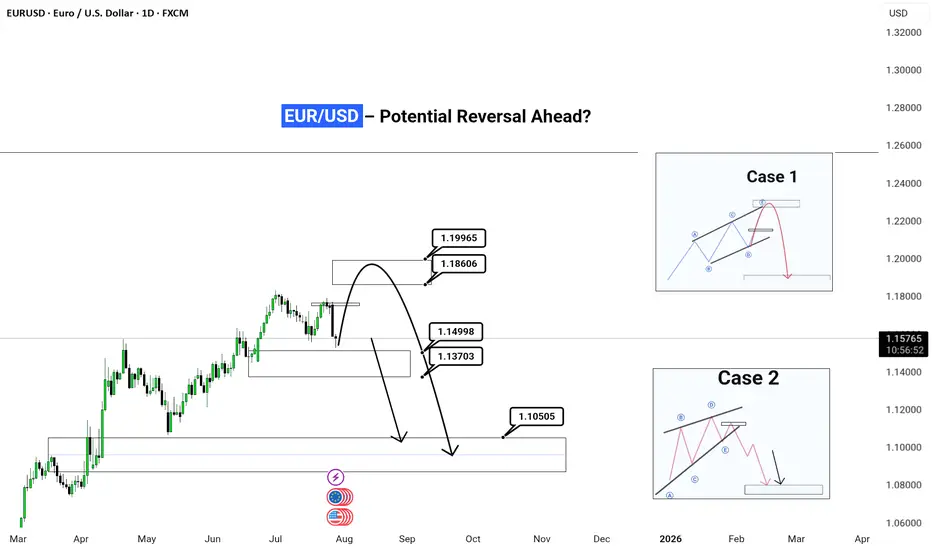
EUR/USD – Potential Reversal Ahead?| Daily Timeframe | Outlook (Published July 29, 2025)
⚠️ Setup Summary:
This chart is highlighting a critical juncture for EUR/USD, where price is nearing a major decision zone. Based on price action and wave structure, there are two likely scenarios unfolding. Let’s break it down simple .
EUR/USD has seen a strong bullish rally from March to July, but current price action suggests momentum exhaustion. Now, we’re watching for signs of a reversal or deeper correction in the coming weeks.
📊 Two Probable Scenarios:
✅ Case 1 – Simple Corrective Wave (ABC Pattern)
Expected Move:
Price may spike up into the 1.186–1.199 zone (final bull trap/liquidity grab)
Followed by a sharp bearish move (impulse C wave) towards 1.10505 zone
This reflects a clean correction before possible reaccumulation
📌 This is often seen after retail traders get caught chasing highs late in a move.
---
✅ Case 2 – Complex Corrective Wave (ABCDE Flat/Running Triangle)
Expected Move:
A longer, more sideways and choppy correction into Q1 2026
Price forms a distribution pattern under resistance
After a breakout below the structure, a sharp drop to 1.10505 zone (or deeper)
📌 This is a slower bleed-out pattern before continuation lower. Often traps both buyers and sellers in the chop.
---
🎯 Current Price: 1.15756
We are in a decision zone, and watching the reaction around 1.165–1.186 will be crucial to validate either Case 1 or Case 2.
---
💡 My View:
> Wait for confirmation at the 1.186 zone.
If price rejects strongly from there, Case 1 is in play. 👈❤️
If price chops sideways and holds higher for weeks, expect Case 2 structure.
---
🚨 Reminder for Traders:
Don’t chase moves — let the market show its hand
Use proper risk management
Combine this structure with session timing, liquidity sweeps, and fundamental events
---
💬 Drop a comment if you're seeing similar setups in other majors!
🧠 Follow for real-time updates & actionable setups.
#EURUSD #ForexAnalysis #WaveTheory #SmartMoney #OrderBlock #LiquidityHunt #ForexStrategy #ElliottWave #PriceAction #FXTrader #TradingView
---
EURUSD – DAILY FORECAST Q3 | W31 | D29 | Y25📊 EURUSD – DAILY FORECAST
Q3 | W31 | D29 | Y25
Daily Forecast 🔍📅
Here’s a short diagnosis of the current chart setup 🧠📈
Higher time frame order blocks have been identified — these are our patient points of interest 🎯🧭.
It’s crucial to wait for a confirmed break of structure 🧱✅ before forming a directional bias.
This keeps us disciplined and aligned with what price action is truly telling us.
📈 Risk Management Protocols
🔑 Core principles:
Max 1% risk per trade
Only execute at pre-identified levels
Use alerts, not emotion
Stick to your RR plan — minimum 1:2
🧠 You’re not paid for how many trades you take, you’re paid for how well you manage risk.
🧠 Weekly FRGNT Insight
"Trade what the market gives, not what your ego wants."
Stay mechanical. Stay focused. Let the probabilities work.
FX:EURUSD
