#EURUSD - Pivot Point is 1.174Date: 22-07-2025
#EURUSD - Current Price: 1.175
Pivot Point: 1.174 Support: 1.162 Resistance: 1.185
Upside Targets:
Target 1: 1.190
Target 2: 1.195
Target 3: 1.203
Target 4: 1.211
Downside Targets:
Target 1: 1.157
Target 2: 1.152
Target 3: 1.144
Target 4: 1.136
#TradingView #Forex #Currency #StockMarket #Investing #Trading #EURUSD
#TechnicalAnalysis #SotockCharts #Finance
#PivotPoints #SupportResistance
USDEUR trade ideas
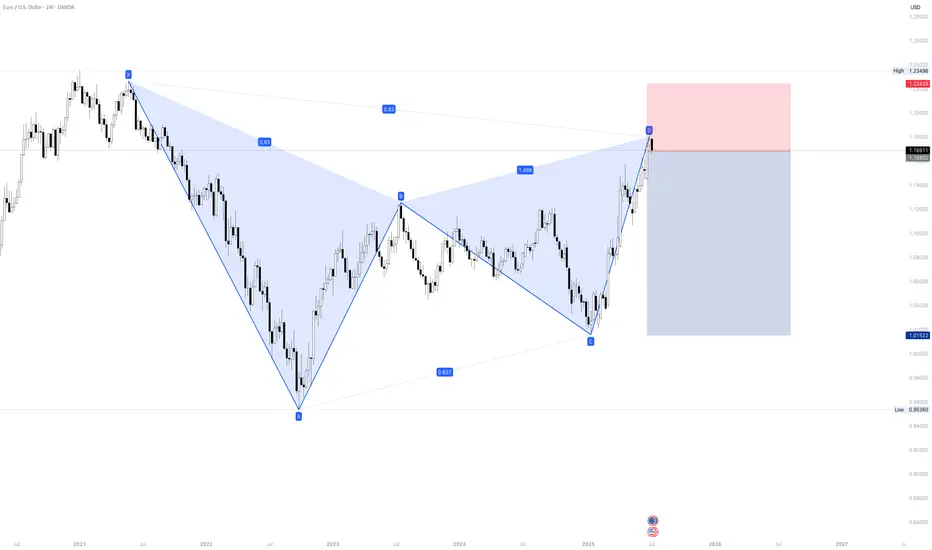
EUR/USD - Potential TargetsDear Friends in Trading,
How I see it,
KEY SUPPORT AREA @ 1.1250
If support area holds, more bullish action will follow
I sincerely hope my point of view offers a valued insight
Thank you for taking the time study my analysis.
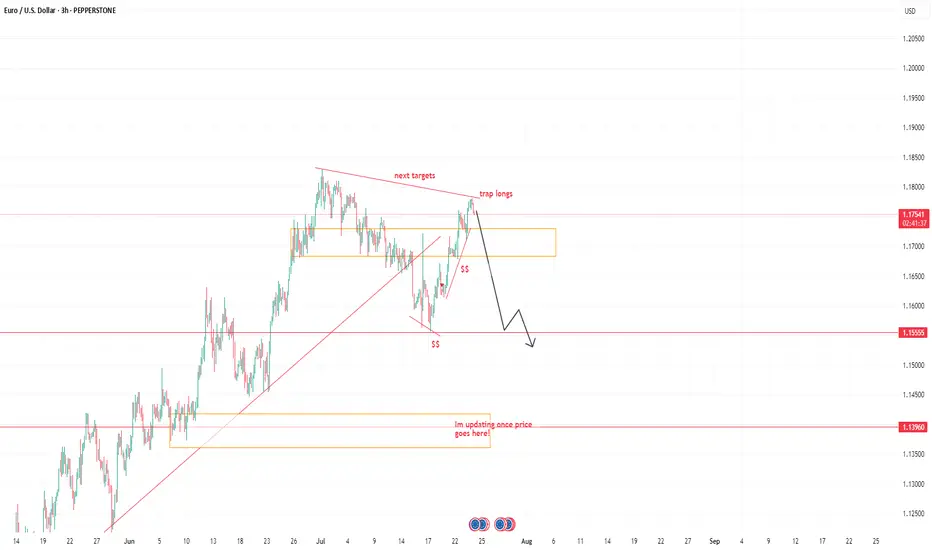
EURUSD NEW IDEASee the chart above, were on decling its momentum, I believe more trap longs this move.
SEE it in 2 days how things works. targets see charts.
I don't really explain to gain more tractions on how trading works.
I am here to understand the movement. Don't complicate too much, If you're a swing trader, take it a leap and have patience. stick to your own proper stoploss.
Trade it or leave it.
Goodluck folks.
EUR/USD Elliott Wave Update –Classic Wave 5 Breakout OpportunityThis chart of the EUR/USD pair shows a well-structured Elliott Wave impulse pattern unfolding on the 4-hour timeframe. The price action is currently progressing in the final Wave (5) of the impulse cycle, which typically represents the last bullish leg before a larger correction begins.
Wave (1): The initial move up from the bottom (early May), showing a clean 5-wave internal structure.
Wave (2): A healthy retracement after Wave 1, forming a base for further upside.
Wave (3): The strongest and steepest rally, as expected in Elliott theory. It broke past previous highs and extended sharply.
Wave (4): A corrective phase that formed a falling wedge pattern — typically a bullish continuation pattern.
Wave (5): Currently in progress. The wedge has broken to the upside, confirming the potential start of Wave 5.
Target 1 (T1): 1.18306
Target 2 (T2): 1.19012
Stop Loss (SL): 1.16600
After a strong uptrend, the market went sideways in a wedge pattern (a typical wave 4 behavior). It has now broken out, signaling the start of the final wave 5 move. This is often a strong and sharp push. Since the breakout is clean and the Elliott wave count aligns well, this creates a favorable long opportunity

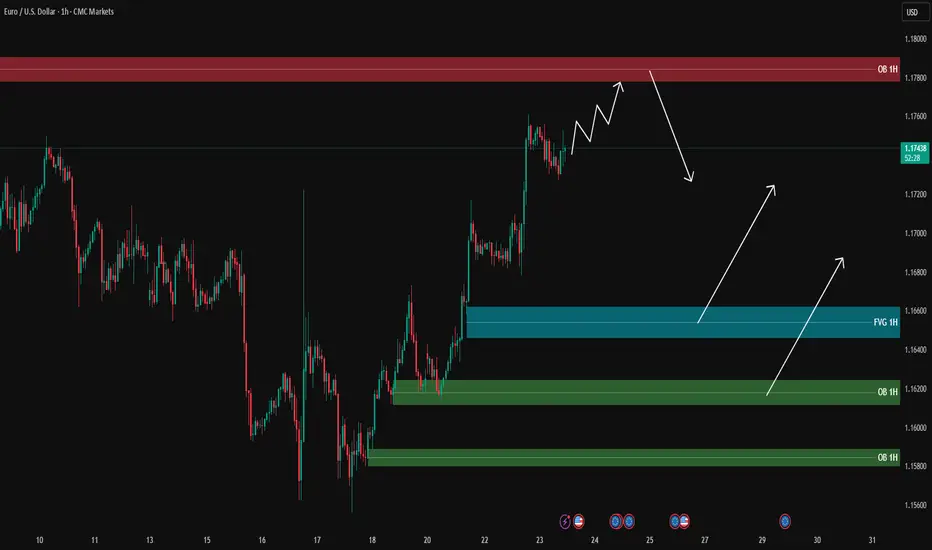
EURUSD analysis - 1H FVG and OB setupsOn the 1H timeframe, price is moving strongly towards the 1H supply zone (around 1.1780), and it is likely to reach this area first before pulling back.
During the pullback, the blue FVG and green OB zones below are key areas for potential long entries:
🔹 FVG 1H around 1.1660
🔹 OB 1H around 1.1620
🔹 OB 1H around 1.1580
📌 Plan:
1️⃣ If the price reaches the upper supply zone, we will look for short scalps with confirmation on the lower timeframe (5M/3M).
2️⃣ After the pullback to lower zones, we will look for long opportunities with PA confirmation.
🎯 Long targets after pullback: 1.1700 – 1.1720, potentially 1.1750.
❌ No entry without confirmation.
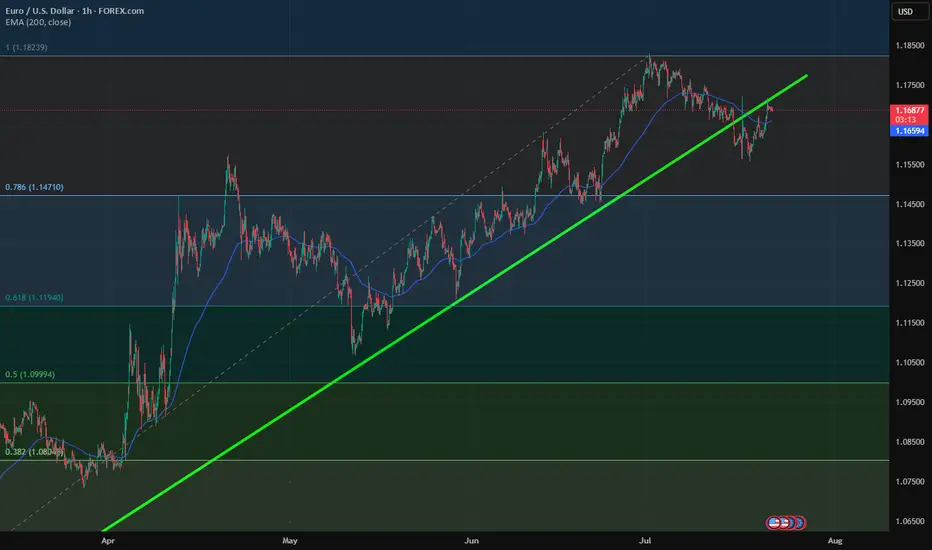
sell eurusd long term1.1450 target suport line fibo, this is my ideea
In my opinion, EUR/USD will go down to a resistance level ....., considering that the 200 EMA has crossed the trend line and the Fibo is doing its job.
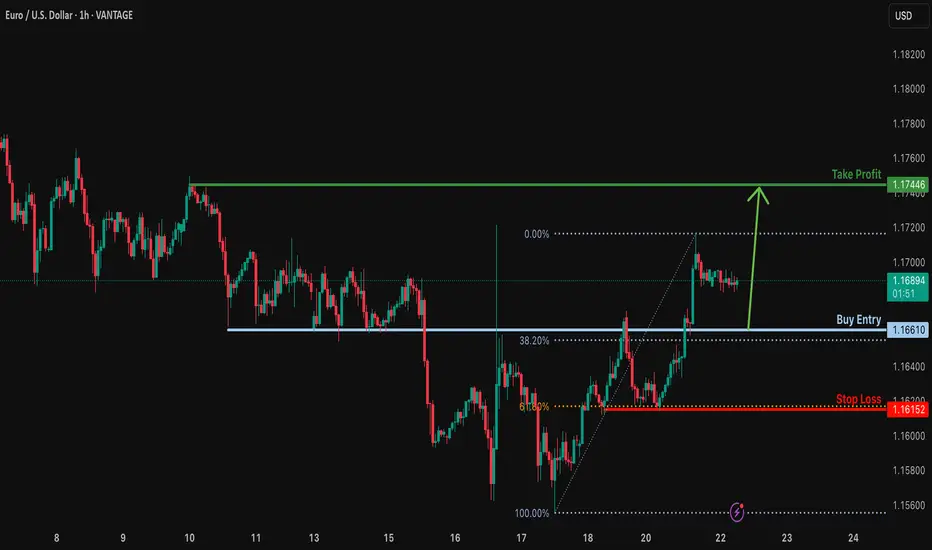
Bullish bounce off overlap support?EUR/USD is falling towards the support level which is an overlap support that aligns with the 38.2% Fibonacci retracement and could bounce from this level to our take profit.
Entry: 1.1661
Why we like it:
There is an overlap support that lines up with the 38.2% Fibonacci retracement.
Stop loss: 1.1615
Why we like it:
There is a pullback support that aligns with the 61.8% Fibonacci retracement.
Take profit: 1.1744
Why we like it:
There is a pullback resistance.
Enjoying your TradingView experience? Review us!
Please be advised that the information presented on TradingView is provided to Vantage (‘Vantage Global Limited’, ‘we’) by a third-party provider (‘Everest Fortune Group’). Please be reminded that you are solely responsible for the trading decisions on your account. There is a very high degree of risk involved in trading. Any information and/or content is intended entirely for research, educational and informational purposes only and does not constitute investment or consultation advice or investment strategy. The information is not tailored to the investment needs of any specific person and therefore does not involve a consideration of any of the investment objectives, financial situation or needs of any viewer that may receive it. Kindly also note that past performance is not a reliable indicator of future results. Actual results may differ materially from those anticipated in forward-looking or past performance statements. We assume no liability as to the accuracy or completeness of any of the information and/or content provided herein and the Company cannot be held responsible for any omission, mistake nor for any loss or damage including without limitation to any loss of profit which may arise from reliance on any information supplied by Everest Fortune Group.
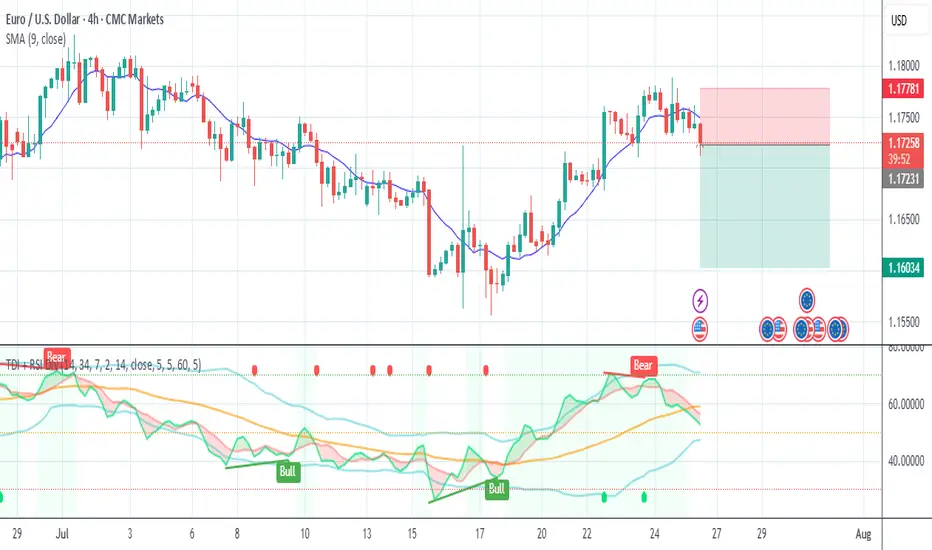
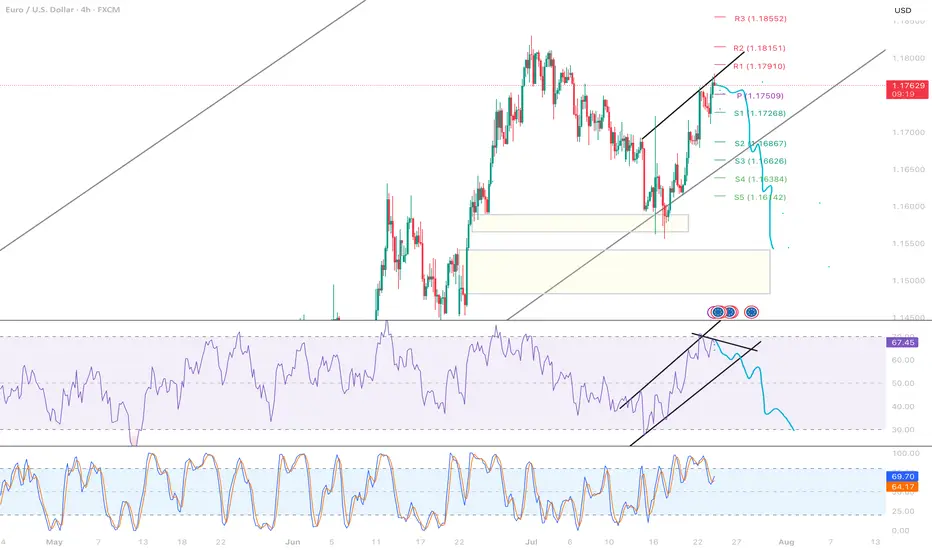
EURUSD Bearish Ahead as US Resilience Meets Eurozone FragilityEURUSD has shifted into bearish territory, pressured by growing divergence between a resilient US economy and a struggling Eurozone. The pair recently rejected the 1.1700 zone, forming multiple bearish structures on the 4H chart. With sticky US inflation, Trump’s renewed tariff agenda, and a dovish ECB, EUR/USD appears poised for a deeper move toward 1.1527 and possibly 1.1445 in the coming sessions. This setup is both technically and fundamentally aligned, but key event risk remains.
🔸 Technical Structure (4H)
Clear rejection from the 1.1700–1.1710 zone.
Bearish pennants and wedge patterns confirm continuation lower.
Downside targets:
🔹 First: 1.1637
🔹 Second: 1.1527
🔹 Final: 1.1445
Risk zone: Above 1.1785 (invalidates short bias if broken cleanly).
🧭 Key Fundamentals
🇺🇸 Dollar Strength: Sticky inflation, stable labor market, and geopolitical risk all favor USD demand.
🇪🇺 Euro Weakness: ECB dovish tone persists amid weak data, soft PMIs, and stagnating growth.
Yield Spread: US-Euro real yield spread supports further EUR/USD downside.
Tariff Pressure: Trump’s 50% tariff plan and tensions with the EU weigh on EUR.
⚠️ Risks to Watch
A surprise dovish pivot from the Fed.
Weak US CPI or disappointing retail sales.
Major risk-on flows that trigger broad USD weakness.
New EU fiscal stimulus or Germany/France recovery surprises.
📆 Key Events Ahead
🇺🇸 US Core CPI – A hot print supports USD strength.
🇺🇸 Retail Sales & Powell testimony – Watch tone on rate cuts.
🇪🇺 German ZEW Sentiment, Eurozone HICP inflation – Weak readings would further drag EUR.
🔄 Leader or Lagger?
EUR/USD is a lagger to GBP/USD, often following UK-driven USD moves.
Acts as a leader for EUR/JPY, EUR/AUD, EUR/CHF – weakness here cascades across EUR crosses.
Tracks broad USD sentiment – dovish Fed pricing boosts EURUSD, while rate hike fears drag it.
✅ Summary: Bias and Watchpoints
EUR/USD is bearish below 1.1700 as economic divergence, sticky US inflation, and rising geopolitical tensions favor the dollar. ECB policy remains soft, offering little support to the euro. Key risk lies in a dovish Fed pivot or softer US data. Watch US CPI and Powell for clues. This pair is likely to lag GBP/USD moves, but will lead EUR crosses lower if the downside momentum continues.

Short Term Market Reversal IncomingRetail’s still buying breakouts, but the music just stopped.
This was the rally they weren’t supposed to catch.
Now it’s time to flip the script and bleed it back to origin.
Trading is a very difficult profession. Most people fail, but it's also not impossible. If you don't trade you're a loser.
It's a zero-sum game. 0 1
Zero-sum game is a mathematical representation in game theory and economic theory of a situation that involves two competing entities, where the result is an advantage for one side and an equivalent loss for the other.
It's all just digits on a screen and if they want your money they'll take your money, so you gotta respect your risk management if you don't want to lose everything or you'll have to break the matrix by seeing into the future,
Once you get to see the future. THERE IS NO TURNING BACK.
If you're reading this I hope you're having a great year. This year is all about endings and new beginnings. So stay locked in.
WAGMI
Oh yeah don't forget I gave you guys FX_IDC:EURUSD at 1.03 and FX_IDC:XAGUSD at $22
Nerds

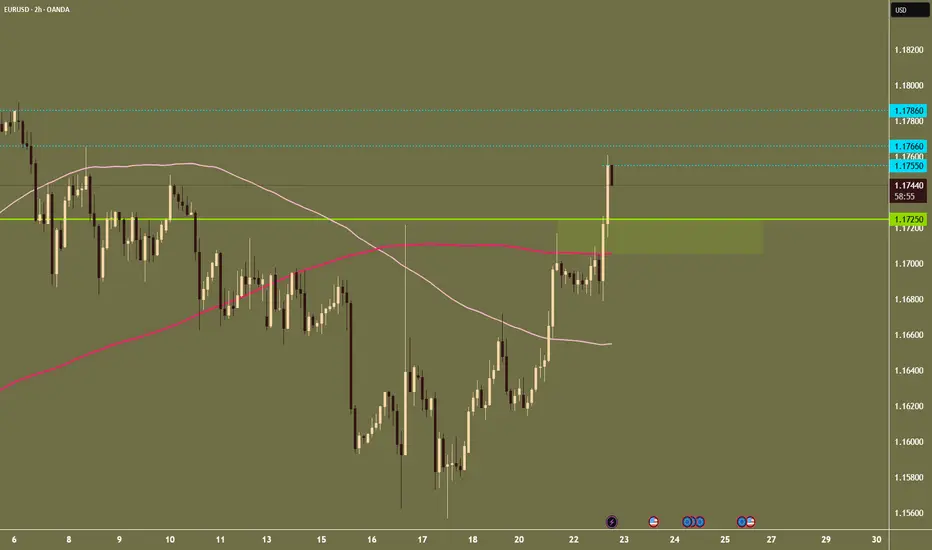
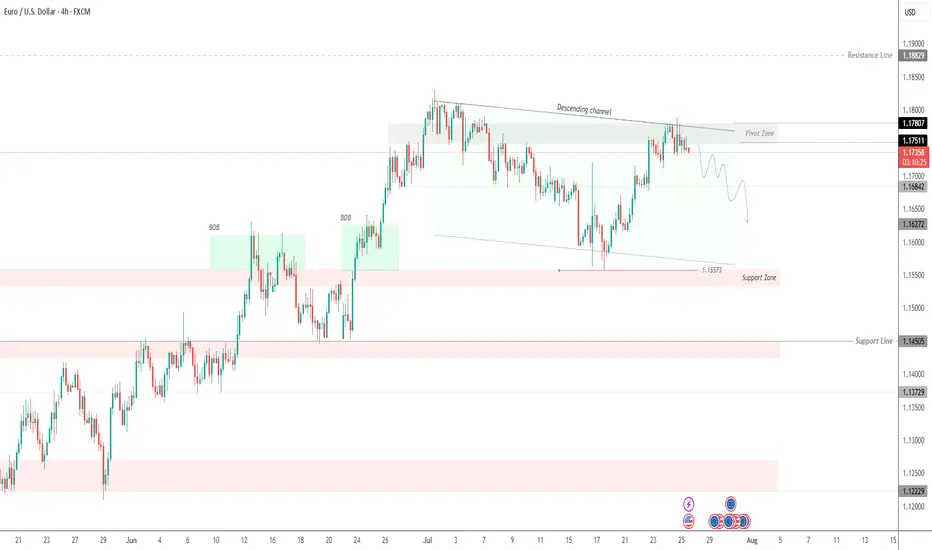
EURUSD –Bearish Pressure Below 1.1780 |Channel Structure HoldingEURUSD | UPDATE
The price is currently respecting the descending channel, failing to close above the pivot zone (1.1780 – 1.1750) and rejecting from the upper boundary of the structure.
Bias: Bearish While Below 1.1780
As long as price remains under the pivot zone and inside the descending channel, the bearish pressure is likely to persist. A potential correction may retest 1.1750 – 1.1730 levels before continuation.
Next Targets:
1.1700 – Minor support
1.1684 – Short-term level
1.1627 – Mid-target
1.1557 – Main support zone and channel bottom
Invalidation:
Clear breakout and H4 close above 1.1780 would invalidate the short bias and open a path toward 1.1820 and possibly 1.1882.
Structure: Bearish inside descending channel
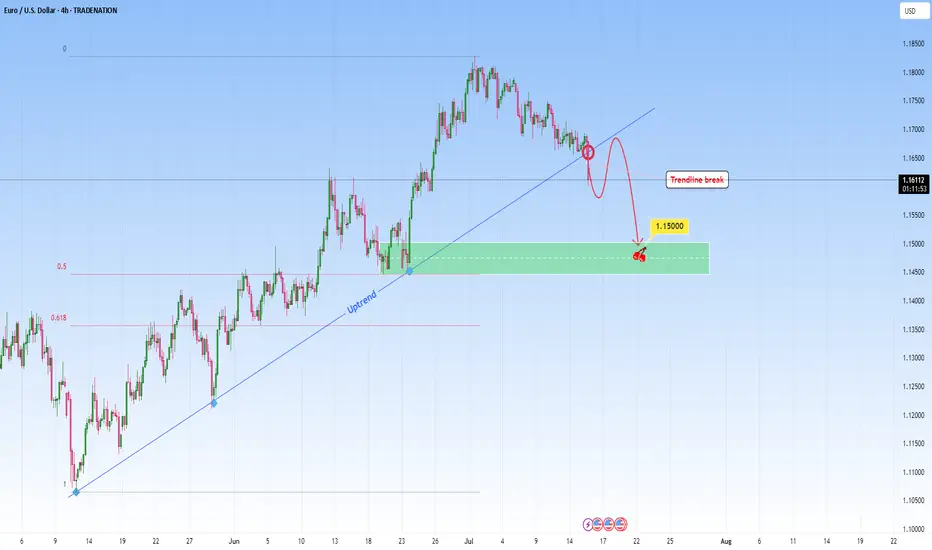
EURUSD: Sell Opportunity after Trendline breakEURUSD was in a steep uptrend but it might stop with this recent break through the uptrend. A break like this one on a strong trendline that had multiple touches, indicates either a potential reversal or major pause in the trend. This candle that broke the trendline signals the first hint of structural change.
I will be waiting for a retest and look to get involved in a short setup.
Ideally, what I look for in retests is to be met with a confirming candle. This would confirm the sellers have taken over and validate the change from uptrend to potential downtrend or consolidation phase.
My target would be around 1.1500.
Just sharing my thoughts for the charts, this isn’t financial advice. Always confirm your setups and manage your risk properly.
Disclosure: I am part of Trade Nation's Influencer program and receive a monthly fee for using their TradingView charts in my analysis .
EUR/USD About to Trap the Bears? Final Push Before the Drop! EUR/USD is showing a solid short-term bullish structure, with a move initiated from the demand base around 1.1560, fueling a strong rally toward the current level near 1.1770. Price is now approaching a significant supply zone between 1.1790 and 1.1875, previously responsible for the last major bearish swing. This area also aligns with projected Fibonacci levels (25%-100%), reinforcing its relevance as a possible inflection point.
This movement suggests there’s still room for price to push higher, likely completing the final leg of this bullish cycle before a more convincing short setup develops. At this stage, Fibonacci levels are not acting as firm supports, but rather as hypothetical pullback projections: once price enters the 1.1800–1.1875 area, it will be key to monitor for signs of exhaustion. A rejection here may initiate a bearish retracement toward 1.1670–1.1650, in line with the 62–70.5% fib levels.
Retail sentiment remains highly contrarian: 76% of traders are short, positioning themselves too early against the trend. This imbalance adds fuel for a potential continuation higher, as the market may seek to "squeeze" these premature shorts. Additionally, the COT report confirms growing institutional interest in the euro, with non-commercials increasing their net longs, while USD net long exposure continues to shrink.
Seasonality adds further confluence: late July is historically bullish for EUR/USD, suggesting one final leg up could materialize before a typically weaker August.
✅ Trading Outlook
EUR/USD is technically aligned for a final push toward the 1.1800–1.1875 premium zone, where a potential short opportunity may arise. The rally is currently driven by overextended retail shorts and supportive institutional flows. Only after price interacts with the upper supply zone should reversal signs be evaluated, with correction targets around 1.1670–1.1650. The ideal play: wait for confirmation of bearish intent in August, when seasonal weakness typically kicks in.

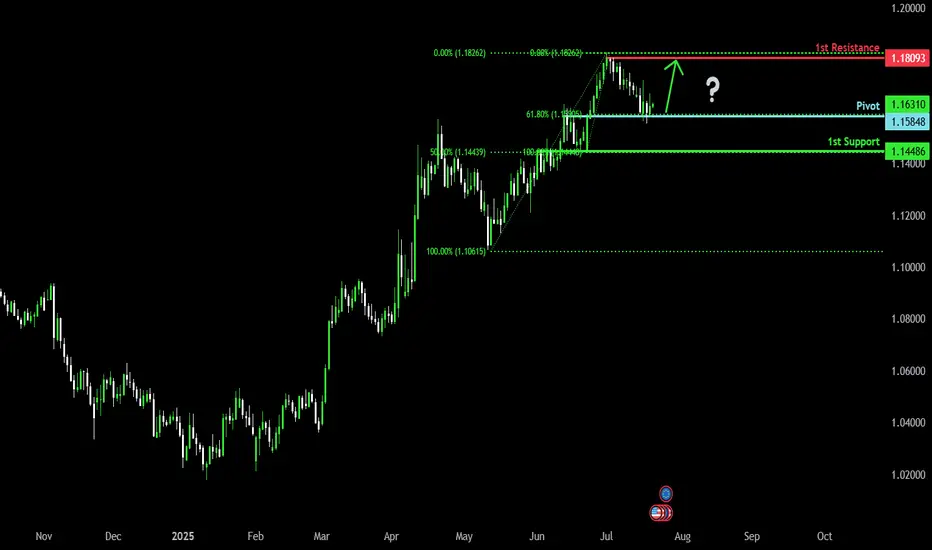
Bullish momentum to extend?The Fiber (EUR/USD) is reacting off the pivot which is a pullback support that aligns with the 61.8% Fibonacci retracement and could bounce to the 1st resistance.
Pivot: 1.1584
1st Support: 1.1448
1st Resistance: 1.1809
Risk Warning:
Trading Forex and CFDs carries a high level of risk to your capital and you should only trade with money you can afford to lose. Trading Forex and CFDs may not be suitable for all investors, so please ensure that you fully understand the risks involved and seek independent advice if necessary.
Disclaimer:
The above opinions given constitute general market commentary, and do not constitute the opinion or advice of IC Markets or any form of personal or investment advice.
Any opinions, news, research, analyses, prices, other information, or links to third-party sites contained on this website are provided on an "as-is" basis, are intended only to be informative, is not an advice nor a recommendation, nor research, or a record of our trading prices, or an offer of, or solicitation for a transaction in any financial instrument and thus should not be treated as such. The information provided does not involve any specific investment objectives, financial situation and needs of any specific person who may receive it. Please be aware, that past performance is not a reliable indicator of future performance and/or results. Past Performance or Forward-looking scenarios based upon the reasonable beliefs of the third-party provider are not a guarantee of future performance. Actual results may differ materially from those anticipated in forward-looking or past performance statements. IC Markets makes no representation or warranty and assumes no liability as to the accuracy or completeness of the information provided, nor any loss arising from any investment based on a recommendation, forecast or any information supplied by any third-party.
EUR/USD - Sells on H1EUR/USD broke an Ascending Channel and have also shifted the trend downwards.
We will wait for a pullback to 0.5 - 0.618 Fib level for entry with the SL placed above the last high
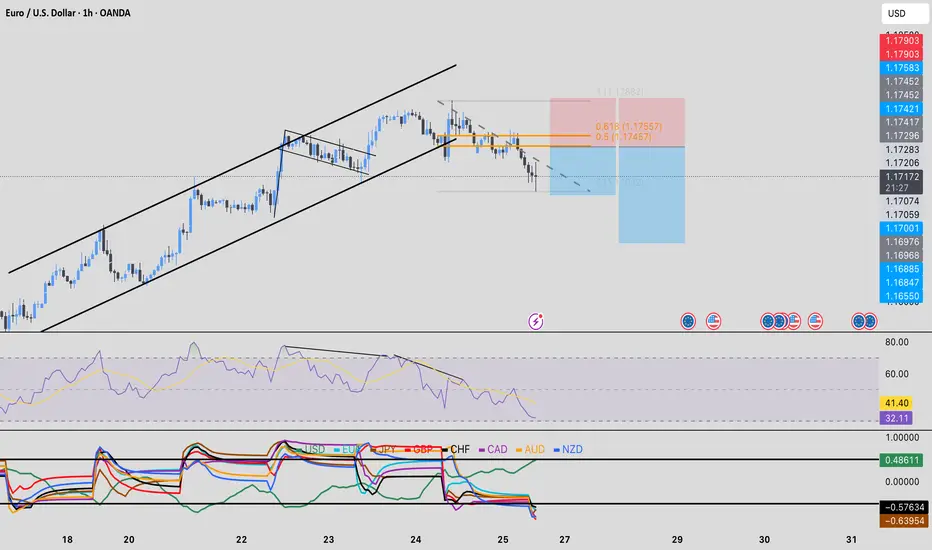
eurusd sell tradeThe Relative Strength Index (RSI) is showing a downward trend, indicating weakening momentum. Additionally, the Moving Average Convergence Divergence (MACD) is showing a bearish crossover, further supporting the potential for a downward move
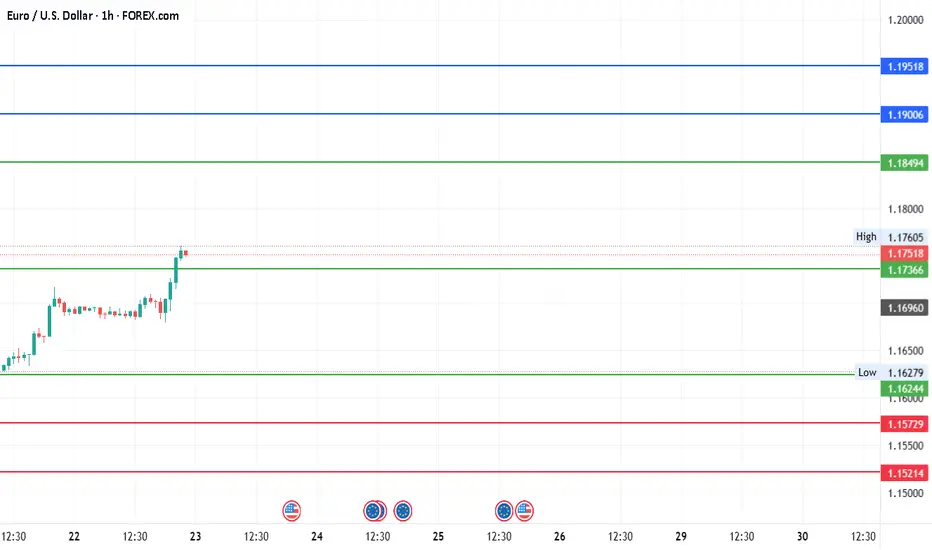
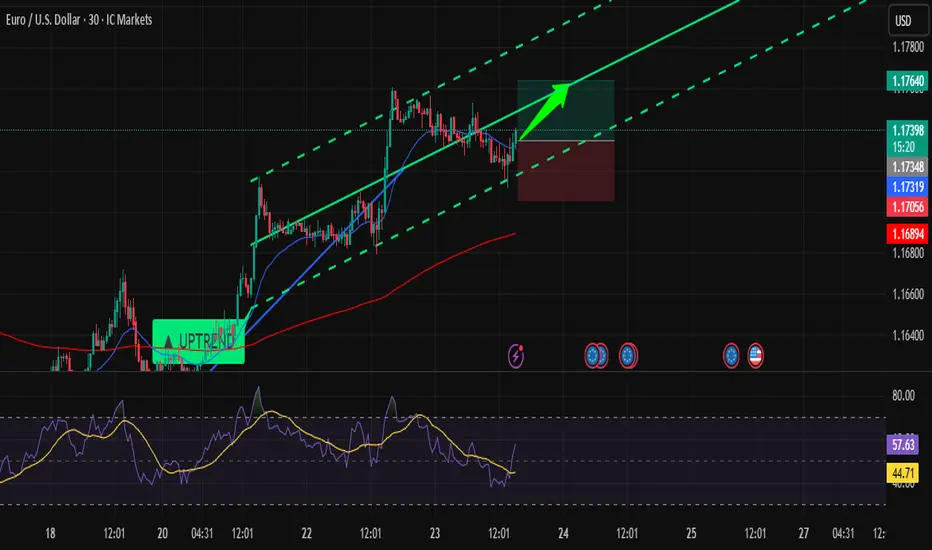
EUR/USD Set to Fly – Don’t Miss This Perfect Channel Breakout!Hi traders!, Analyzing EUR/USD on the 30-minute timeframe, we can observe that price is respecting the ascending channel and reacting to the dynamic trendline support (green dashed lines). A recent bounce suggests a potential bullish continuation within this structure.
🔹 Entry: 1.17399
🔹 Take Profit (TP): 1.17640
🔹 Stop Loss (SL): 1.17056
Price remains above the 200 EMA, confirming a bullish environment. The bounce aligns with the lower boundary of the channel and follows a short consolidation period, indicating buying pressure. The RSI also shows signs of recovery after approaching oversold levels, supporting the idea of upward momentum.
This long setup offers a favorable risk/reward ratio and aims to capture continuation toward upper channel resistance.
⚠️ DISCLAIMER: This is not financial advice. Trade at your own risk and always use proper risk management.
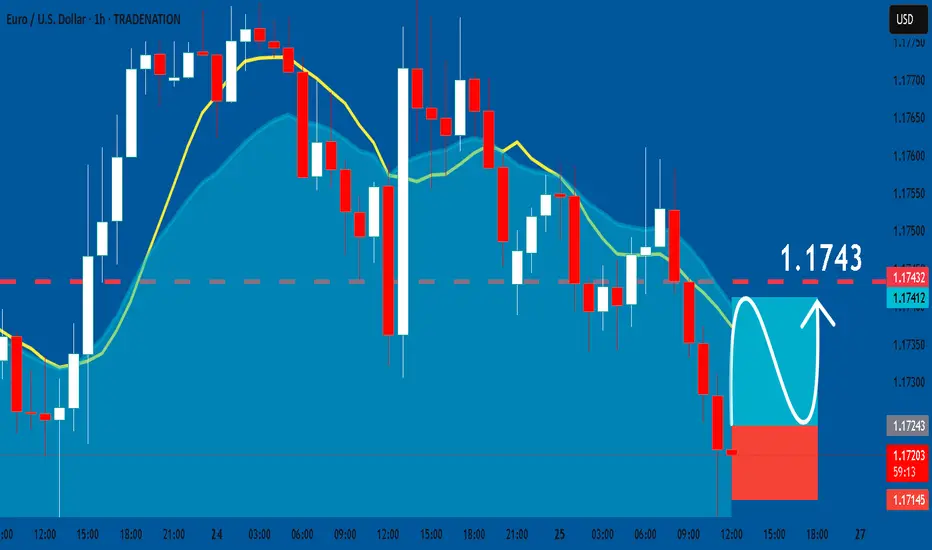
EURUSD: Long Signal with Entry/SL/TP
EURUSD
- Classic bullish pattern
- Our team expects retracement
SUGGESTED TRADE:
Swing Trade
Buy EURUSD
Entry - 1.1724
Stop - 1.1714
Take - 1.1743
Our Risk - 1%
Start protection of your profits from lower levels
Disclosure: I am part of Trade Nation's Influencer program and receive a monthly fee for using their TradingView charts in my analysis.
❤️ Please, support our work with like & comment! ❤️
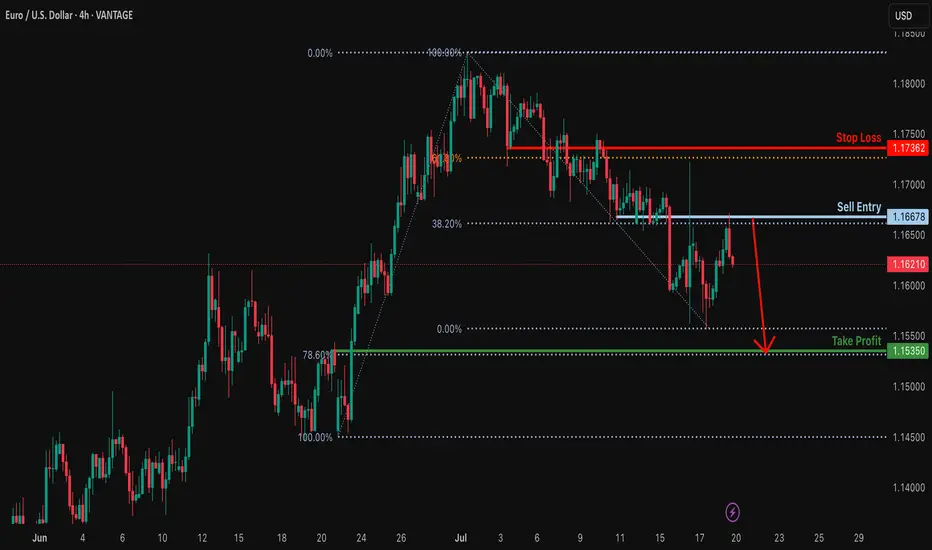
Bearish drop?EUR/USD has rejected off the resistance level which is a pullback resistance that lines up with the 38.2% Fibonacci retracement and could drop from this level to our tale profit.
Entry: 1.1667
Why we like it:
There is a pullback resistance that aligns with the 38.2% Fibonacci retracement.
Stop loss: 1.1736
Why we like it:
There is an overlap resistance that aligns with the 61.8% Fibonacci retracement.
Take profit: 1.1535
Why we like it:
There is a pullback support that lines up with the 78.6% Fibonacci retracement.
Enjoying your TradingView experience? Review us!
Please be advised that the information presented on TradingView is provided to Vantage (‘Vantage Global Limited’, ‘we’) by a third-party provider (‘Everest Fortune Group’). Please be reminded that you are solely responsible for the trading decisions on your account. There is a very high degree of risk involved in trading. Any information and/or content is intended entirely for research, educational and informational purposes only and does not constitute investment or consultation advice or investment strategy. The information is not tailored to the investment needs of any specific person and therefore does not involve a consideration of any of the investment objectives, financial situation or needs of any viewer that may receive it. Kindly also note that past performance is not a reliable indicator of future results. Actual results may differ materially from those anticipated in forward-looking or past performance statements. We assume no liability as to the accuracy or completeness of any of the information and/or content provided herein and the Company cannot be held responsible for any omission, mistake nor for any loss or damage including without limitation to any loss of profit which may arise from reliance on any information supplied by Everest Fortune Group.
EURUSD SHORT. DXY UP. Possible scenario for short term for EURUSD, Short on place for possible target 1.1540 and we might have a bounce from there ,a whole week green for DXY before any downfall
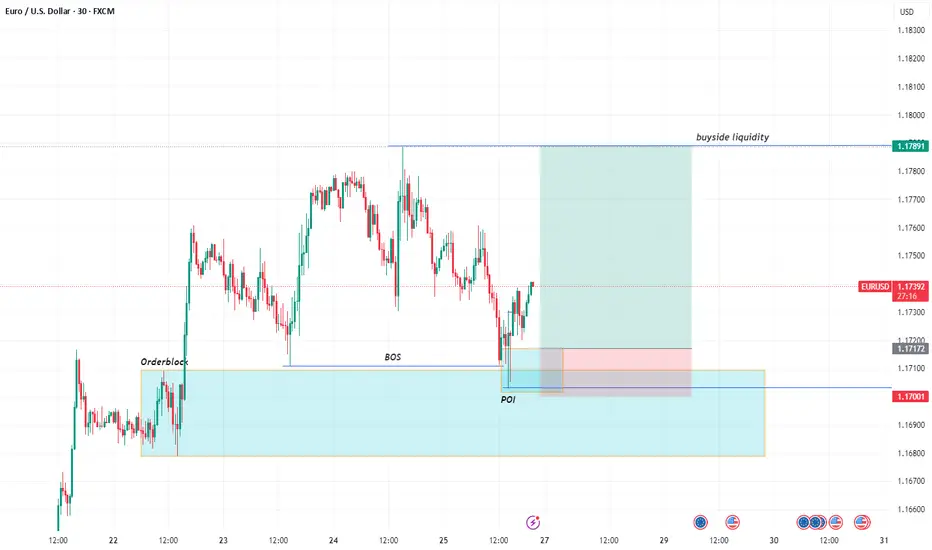
EURUSD BUYTapped into an orderblock on the 4hr time frame, so i scaled down to the 30mins to look for a buy entry
Entry : 1.17172
TP : 1.17891
SL : 1.17001
EURUSD Intraweek tradeI know, it's Thursday, but i still think that this can be a good intraweek trade. I expect the price to perform a correction here, till the support area at 1.17. If my analysis is correct i expect the price to be there later today or tomorrow morning

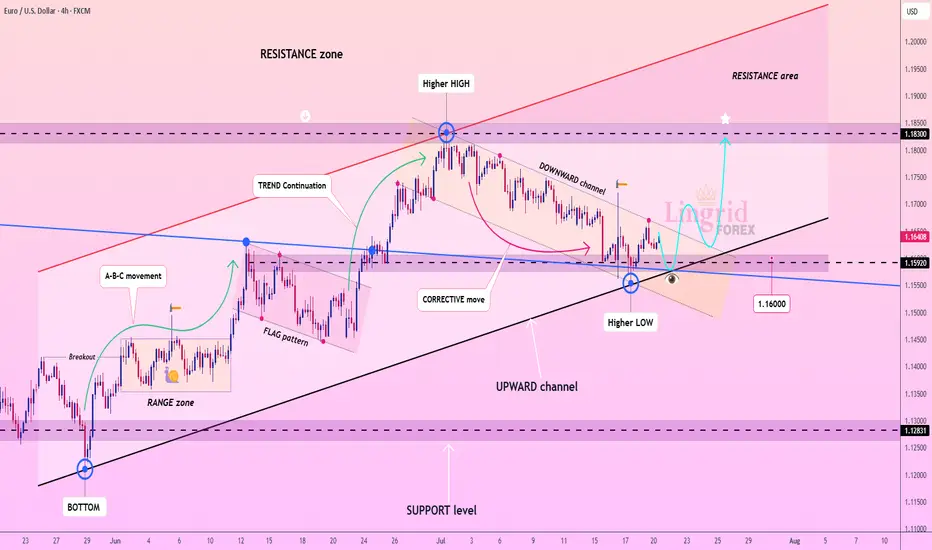
Lingrid | EURUSD Potential Surge Following Channel BreakoutFX:EURUSD is consolidating after bouncing from a key confluence of support around 1.16000 and forming a higher low within the upward channel. The recent corrective pullback through a downward channel now appears complete, with bullish structure resuming. Price is likely to advance toward the 1.18300 resistance as long as the 1.15900 zone holds. Momentum favors a continuation of the A-B-C and trend continuation sequences already established.
📉 Key Levels
Buy trigger: Break above 1.16500
Buy zone: 1.16000–1.16250
Target: 1.18300
Invalidation: Close below 1.14500
💡 Risks
Failure to break the corrective channel resistance
Bearish divergence on lower timeframes
Broader USD strength reversal
If this idea resonates with you or you have your own opinion, traders, hit the comments. I’m excited to read your thoughts!