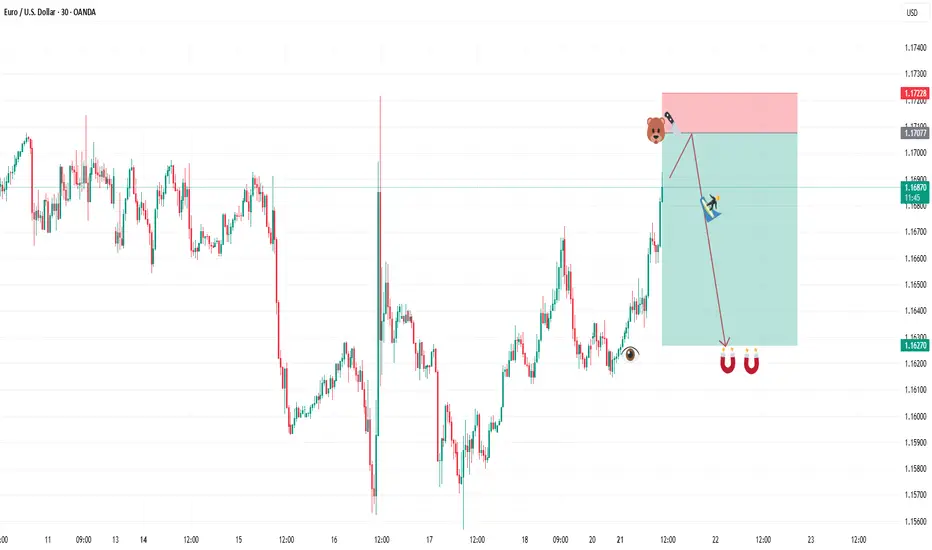
SELL EURUSDAfter todays buys hitting our target we are shifting to a sell play. Our entry is at 1.16878 and second entry at 1.17077. Our stop loss is at 1.17228 and target is at 1.16270. Use proper risk management and best of luck. Algounlocked
USDEUR trade ideas
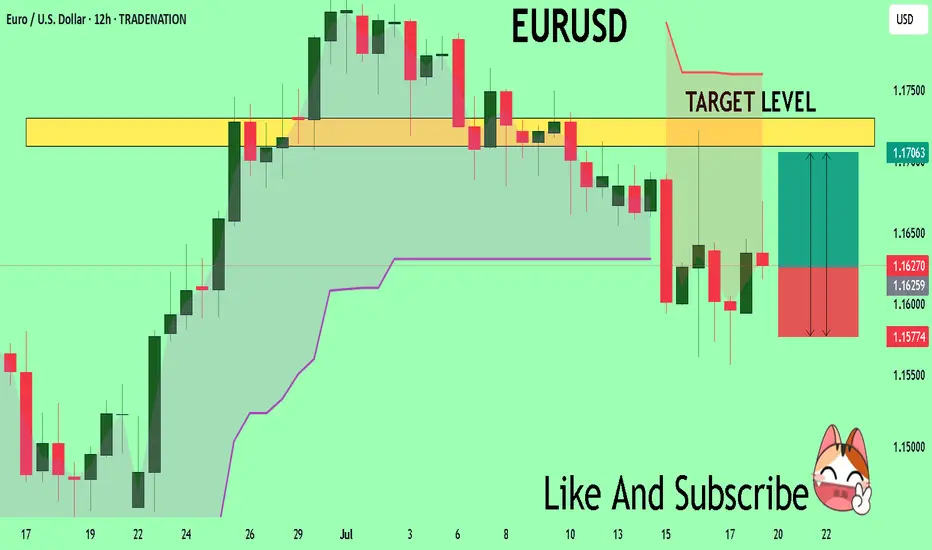
EURUSD Massive Long! BUY!
My dear friends,
Please, find my technical outlook for EURUSD below:
The price is coiling around a solid key level - 1.1627
Bias - Bullish
Technical Indicators: Pivot Points Low anticipates a potential price reversal.
Super trend shows a clear buy, giving a perfect indicators' convergence.
Goal - 1.1710
Safe Stop Loss - 1.1577
About Used Indicators:
The pivot point itself is simply the average of the high, low and closing prices from the previous trading day.
Disclosure: I am part of Trade Nation's Influencer program and receive a monthly fee for using their TradingView charts in my analysis.
———————————
WISH YOU ALL LUCK
EURUSDHello traders,
I've been closely monitoring the **EURUSD** pair for a while, and it’s now offering an ideal entry opportunity. It has presented several great setups for swing trading, and I’d like to share one of them with you today.
🔍 **Trade Details**
✔️ **Timeframe**: H4/D
✔️ **Risk-to-Reward Ratio**: 1:4.22
✔️ **Trade Direction**: Buy
✔️ **Entry Price**: 1.17281
✔️ **Take Profit**: 1.18997
✔️ **Stop Loss**: 1.16874
🔔 **Disclaimer**: This is not financial advice. I’m simply sharing a trade I’ve taken based on my personal trading system, strictly for educational and illustrative purposes.
📌 Interested in a systematic, data-driven trading approach?
💡 Follow the page and turn on notifications to stay updated on future trade setups and advanced market insights.
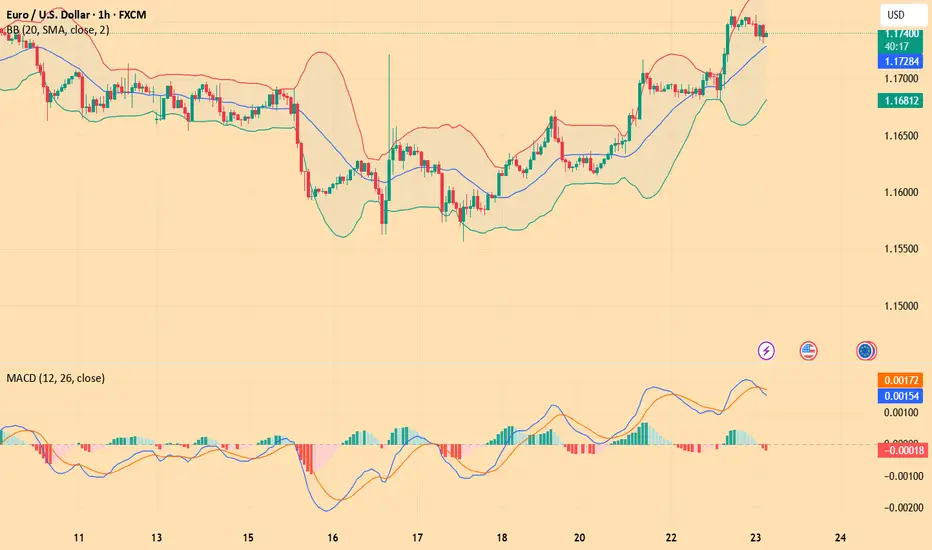
EURUSD(20250723) Today's AnalysisMarket news:
White House officials plan to visit the Federal Reserve headquarters on Thursday local time.
Technical analysis:
Today's buying and selling boundaries:
1.1730
Support and resistance levels:
1.1811
1.1781
1.1761
1.1699
1.1679
1.1649
Trading strategy:
If the price breaks through 1.1761, consider buying, the first target price is 1.1781
If the price breaks through 1.1730, consider selling, the first target price is 1.1699
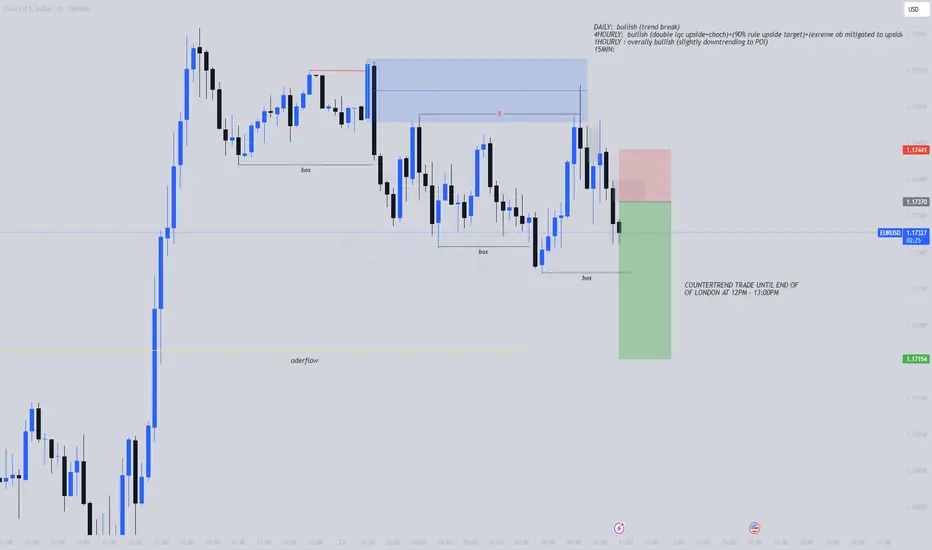
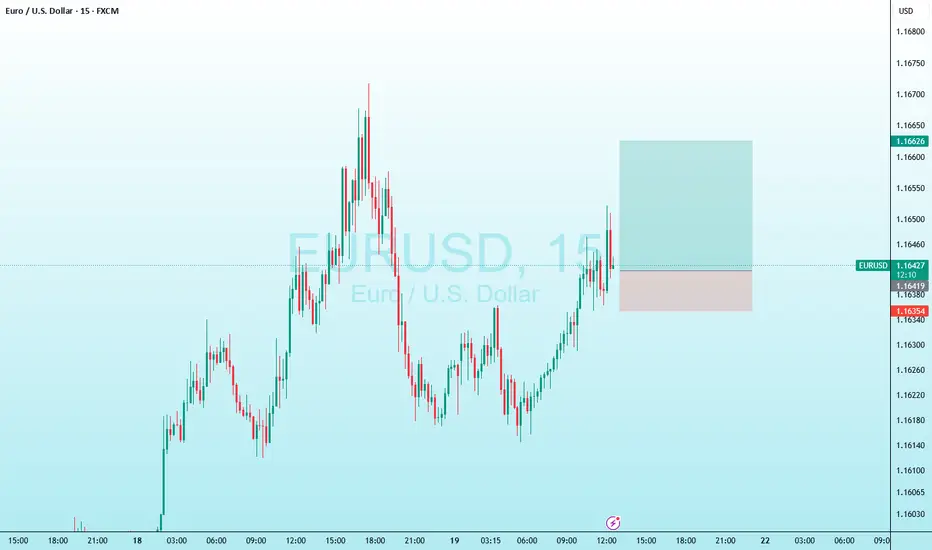
EURUSD Forecast – Smart Money Setup 21st July 2025Here’s the detailed breakdown of my current EURUSD setup based on internal/external liquidity and order block reaction:
🔹 Bias: Bullish (after deeper retracement)
🧠 Breakdown:
Liquidity Sweep ✅
A clear liquidity sweep took place below recent equal lows.
This sweep triggered a bullish displacement, confirming demand.
Market Structure Shift (MSS) 🔁
A valid MSS followed the sweep, confirming short-term reversal in structure.
4H Internal Liquidity 🫧
Price tapped into internal liquidity, setting the stage for a deeper retracement before continuation.
15 Min Order Block (OB) 🧱
Price is currently trading within a 15-minute OB zone, which aligns with minor resistance before a deeper retrace.
🔻 Anticipated Retracement:
Expecting a short-term rejection from the current OB zone.
Price may retrace into the 4H OB zone near 1.1590–1.1610, aligning with an upcoming 4H liquidity pool.
This zone also aligns with previous mitigation and accumulation areas.
🟢 Final Target:
If the 4H OB holds, I'm anticipating a bullish continuation targeting the external 4H liquidity near 1.1730+.
📌 Summary:
Waiting for retracement into demand zone → looking to long from 1.1590–1.1610 area → targeting 1.1730+.
✍️ Execution Plan:
Set alerts near 1.1610
Look for LTF CHoCH or BOS confirmation in demand
Enter with tight stop loss below 4H OB
Target external liquidity

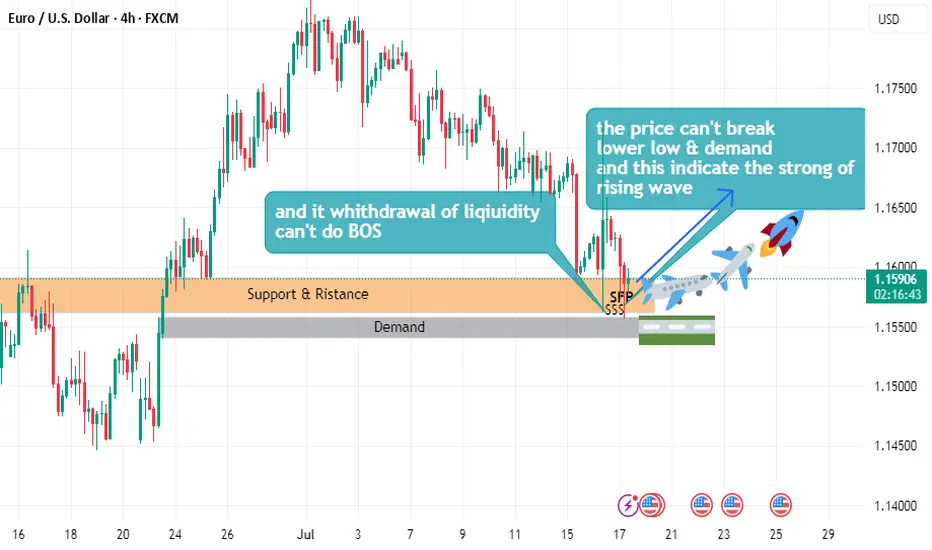
EURUSD buy plane Setuphello
the price can't break lower low
and can't demand
and this indicate the strong of uptrend wave
and it withdrawal of liquidity
and can't do beak of structure
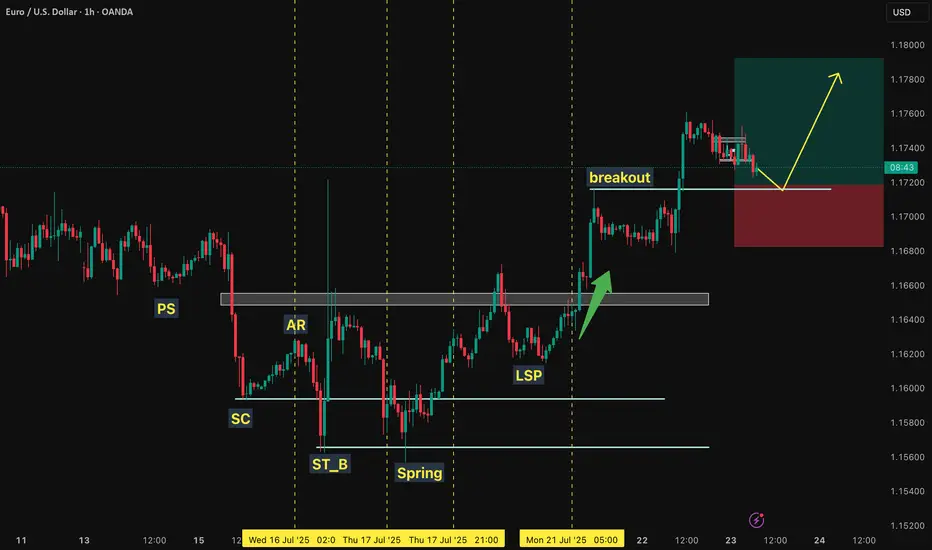
EURUSDI am thinking that a Wycoff pattern during a strong uptrend has formed up. I'll put a buy limit order here on 1H time frame and let it run and see what happens.
Eurusd Bullish StructureEurusd sjowing bullih channel lets try buy now @ 1.17346 with 200 pips target please follow money management use proper risk management always trade smarter not like a gambler stay grouped stay safe happy trading

Buy idea!Hello everyone, as I told you on Last idea on EURUSD, price will go up and will make a new Higher High. it is a good time to go long with 9 R/R ratio.
EURUSD 2nd Sell EntryEntry: 1.16403
Stop Loss (R): 1.16720
Take Profit (4R): 1.15135
*Disclaimer: I will not accept liability for any loss or damage, including without limitation to any loss of profit, which may arise directly or indirectly from use of or reliance on such information.
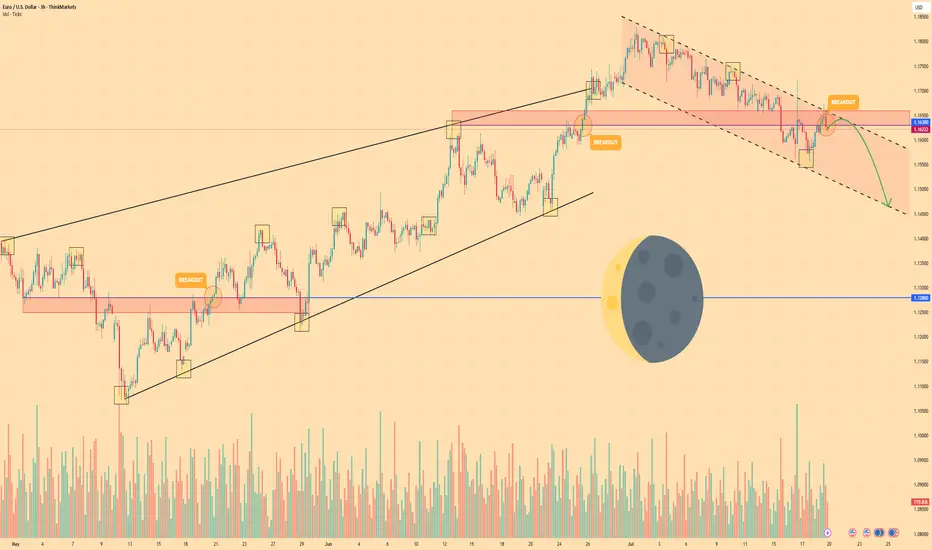
EURUSD Analysis : Liquidity Sweep – EURUSD Targets TO Reversal🧠 Institutional Context & Big Picture
EURUSD has been in a tightly controlled descending channel for several weeks—a classic sign of a market being engineered for liquidity collection. Rather than a naturally trending bearish market, this price action reflects stealth accumulation and market maker manipulation.
The channel structure was used to:
Establish a visible bearish trend (to trap sellers)
Trigger emotional bias for continued shorting
Build up stop orders below swing lows
This phase was about building energy, not continuation.
🔍 Detailed Breakdown of the Chart Elements
📌 1. Descending Channel – Controlled Manipulation
The pair moved within a well-defined bearish channel for multiple weeks.
Each touch respected the top and bottom perfectly—not random, but institutional structure.
It fostered retail confidence in the downtrend while market makers prepared for a reversal.
💥 2. Liquidity Sweep & Trap (Low Breaked & Liquidity Grabbed)
Price spiked below the previous low, clearly sweeping liquidity on July 21.
This is the "engineered breakdown", meant to trigger breakout sellers and stop out early longs.
Immediately after the sweep, the price violently reversed—clear evidence of a liquidity trap.
This is classic MMC logic: induce, trap, reverse.
🟩 3. QFL Base Formed – Bullish Engine Ignited
At the point of reversal, the chart shows the formation of a QFL (Qualified Liquidation Failure) zone.
This QFL base is the core of smart money accumulation—price broke below a base, then quickly reclaimed it.
It's not just support—it’s the true origin of the reversal and an optimal entry point.
📈 4. Breakout from the Channel – Structure Shift Confirmed
Price broke out of the descending channel with strong momentum, confirming:
Structure shift from lower lows → higher highs
Momentum shift in favor of bulls
Entry confirmation for MMC-based long setups
This breakout invalidates the bearish trend and signals a fresh leg up, likely toward unmitigated supply zones.
🟨 5. Current Price Action – Healthy Bullish Consolidation
After the breakout, price is consolidating just above the broken channel, forming a mini-flag or base.
This indicates:
Smart money is accumulating more
No significant selling pressure
Likely continuation toward next supply
🎯 6. Next Targets – Reversal Zones
Minor Resistance: ~1.1800
Major Resistance: ~1.1850 – 1.1880
Next Reversal Zone: 1.1900–1.1950
This zone is highlighted as a potential sell-off area where institutions may offload positions or create new traps.
Watch for signs of exhaustion or redistribution here.
📌 Trade Plan Based on MMC Structure
✅ Bullish Scenario (Currently Active)
Entry Area: Ideally at QFL base or breakout retest (~1.1700–1.1720 zone)
Confirmation: Bullish price action (engulfing, flag break, or liquidity wick)
Targets:
🎯 TP1: 1.1800
🎯 TP2: 1.1850
🎯 TP3: 1.1950 (Reversal Supply Zone)
❌ Invalidation:
A break below the QFL base (~1.1670) with bearish volume would invalidate the bullish MMC structure.
🧠 Smart Money Insight & Logic Recap
This entire move reflects a classic Market Maker Strategy:
Build a trend (descending channel) to shape trader bias
Trigger liquidity events (false breakdown)
Accumulate at the lows via QFL logic
Shift structure (channel breakout)
Target unfilled institutional supply (1.1850–1.1950)
This isn’t random—it’s engineered movement. Your job as a trader is to identify footprints, not follow the crowd.

EURUSD buyer stepping inBase on today price action, we could see buyer is dominating the market.
My plan:-
wait at 1.1655 for any buy opportunity.
calculate your own risk & reward.
Good Luck
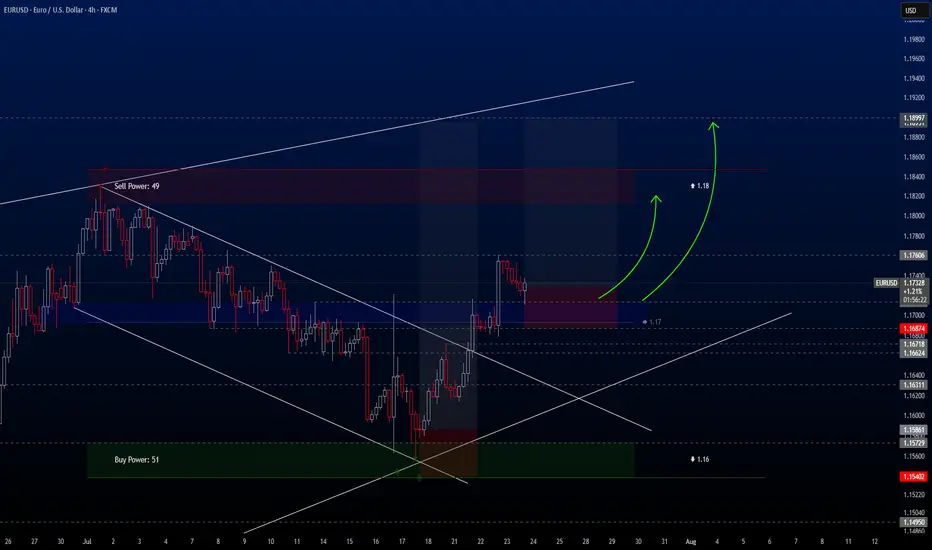
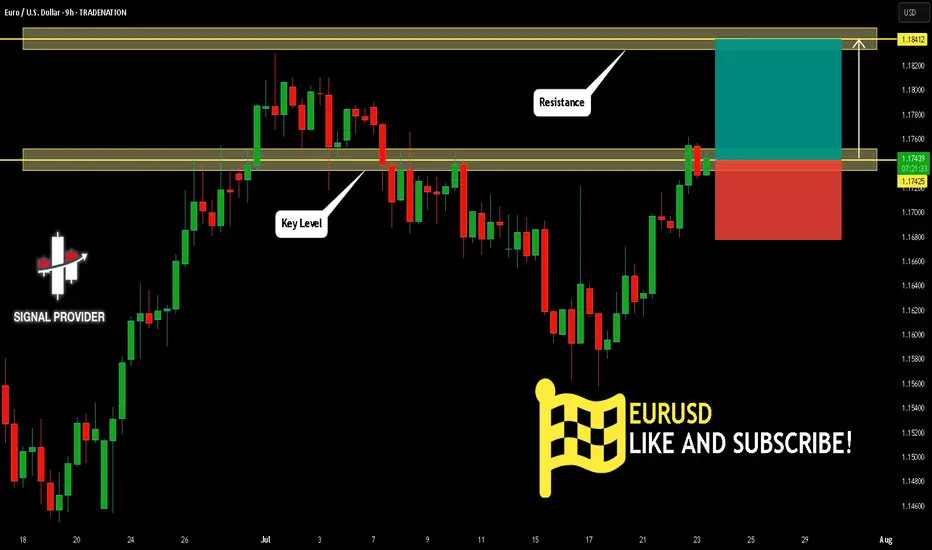
EURUSD Will Move Higher! Long!
Here is our detailed technical review for EURUSD.
Time Frame: 9h
Current Trend: Bullish
Sentiment: Oversold (based on 7-period RSI)
Forecast: Bullish
The market is testing a major horizontal structure 1.174.
Taking into consideration the structure & trend analysis, I believe that the market will reach 1.184 level soon.
P.S
Overbought describes a period of time where there has been a significant and consistent upward move in price over a period of time without much pullback.
Disclosure: I am part of Trade Nation's Influencer program and receive a monthly fee for using their TradingView charts in my analysis.
Like and subscribe and comment my ideas if you enjoy them!
EURUSD Q3 | D23 | W30 | Y25📊EURUSD Q3 | D23 | W30 | Y25
Daily Forecast🔍📅
Here’s a short diagnosis of the current chart setup 🧠📈
Higher time frame order blocks have been identified — these are our patient points of interest 🎯🧭.
It’s crucial to wait for a confirmed break of structure 🧱✅ before forming a directional bias.
This keeps us disciplined and aligned with what price action is truly telling us.
📈 Risk Management Protocols
🔑 Core principles:
Max 1% risk per trade
Only execute at pre-identified levels
Use alerts, not emotion
Stick to your RR plan — minimum 1:2
🧠 You’re not paid for how many trades you take, you’re paid for how well you manage risk.
🧠 Weekly FRGNT Insight
"Trade what the market gives, not what your ego wants."
Stay mechanical. Stay focused. Let the probabilities work.
FRGNT
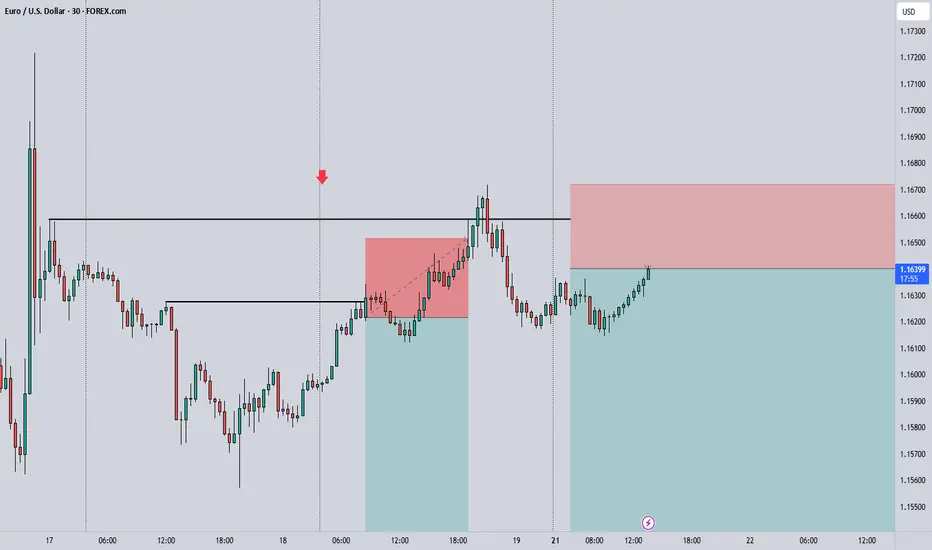
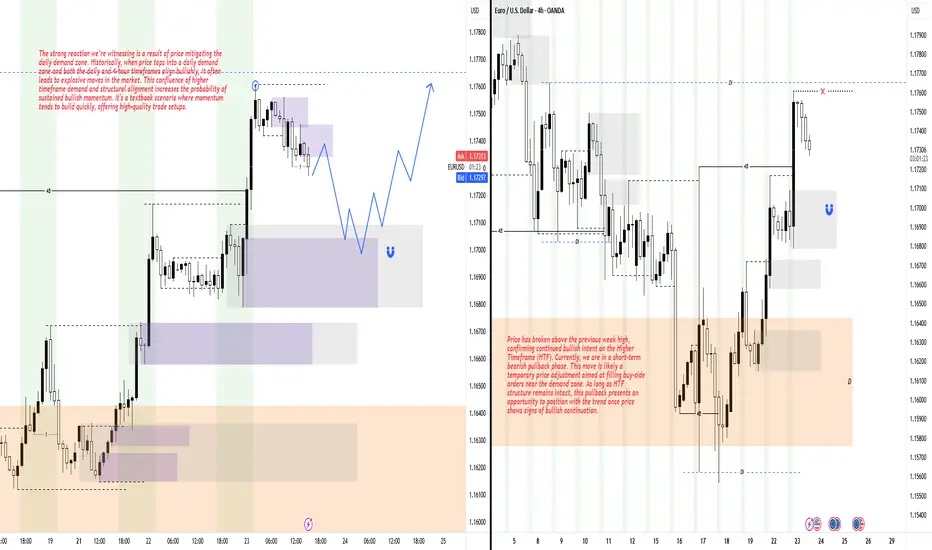
Short-Term Pullback Within a Bullish Higher Timeframe StructureHey Traders, hope you're all doing well! 👋
Price has recently broken above the previous weak high, showing strong bullish momentum. At the moment, we're seeing a short-term bearish pullback — a common market behavior aimed at filling buy orders near the demand zone.
Despite this minor retracement, the Higher Timeframe (HTF) remains firmly bullish. As long as that structure holds, this pullback could present a solid opportunity to rejoin the trend. Wait for bullish confirmation before executing any entries to stay aligned with the prevailing market direction.
EURUSD on the riseYesterday, EURUSD broke through the 1,1720 resistance level with strong momentum.
This confirms the uptrend and opens up opportunities for buying.
The ECB is set to announce interest rates tomorrow, which could trigger increased market volatility.
Keep an eye out for higher lows and signs of the uptrend continuing.
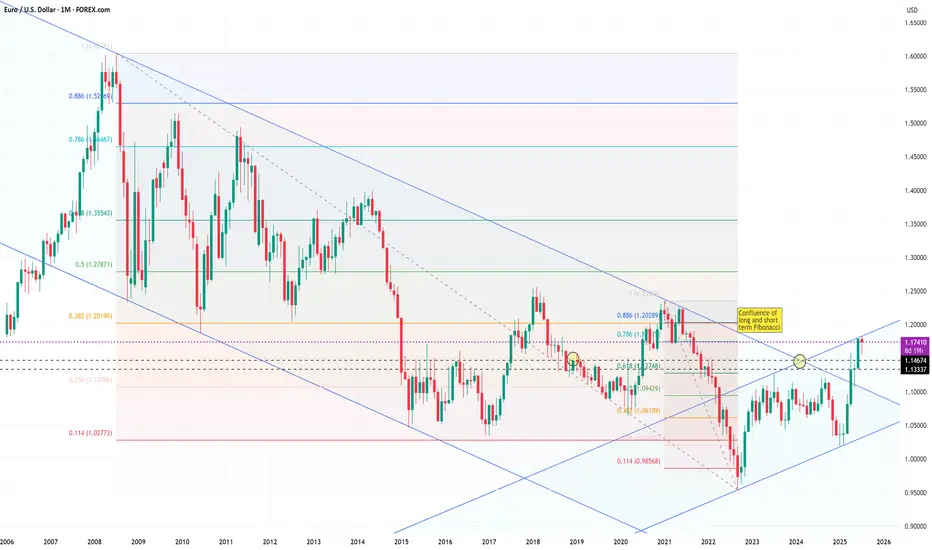
EURO - Price can continue to decline in falling channelHi guys, this is my overview for EURUSD, feel free to check it and write your feedback in comments👊
For a long time, the price was moving within a large ascending wedge, showing a gradual upward trend.
However, buyers failed to maintain momentum, and the price made a decisive breakout below the wedge's support line.
Following the breakout, the instrument established a new structure, a local falling channel, and has been trading within its boundaries since.
Currently, the price is in a corrective upward move, approaching the key resistance area of $1.1630 - $1.1660.
This zone is significant as it aligns with a previous support level and the upper boundary of the current falling channel.
I expect that the price will face rejection from this resistance area and will then continue its decline towards the channel's support line, targeting the $1.1465 level.
If this post is useful to you, you can support me with like/boost and advice in comments❤️
Disclaimer: As part of ThinkMarkets’ Influencer Program, I am sponsored to share and publish their charts in my analysis.
EUR/USD neutral: Proceed with cautionHello traders
My short was short lived and not too damaging.
This powerful EUR/USD bounce is not unusual but perhaps a little bit of a head scratcher.
No economic data of note.
Maybe some positioning before the ECB rate decision?
I don't know what time this morning Senator Mike Lee(R) of Utah decided it was a good idea to repost a clearly fake resignation letter from Chairman Jerome Powell on X, so perhaps that was a factor.
Once again, Scott Bessent calmed the markets by stating that he does not see any reason for Chair Powell to resign.
The technical picture is clear. The pair has broken and closed above a long term downtrend line/channel but is at the upper boundary of the short term channel.
I have noticed several ideas and minds looking for a decline to 1.1450. The intersection of the up and downtrend lines identifies that as a possible level to go long.
However, I take it one day at a time and I am generally hesitant to make long term predictions, so use your own best judgment.
The current economic environment is rife with uncertainty, so keep the risk small. To diversify,
I have been looking for potential growth stocks to dip my toes back into the stock market.
JOBY or ACHR anyone?
Best of luck
eurusd long positionin my opinion this is a good trade with a good r/r
hope hit the tp
consider this is my trade not your trade and i just like to share my trades with world
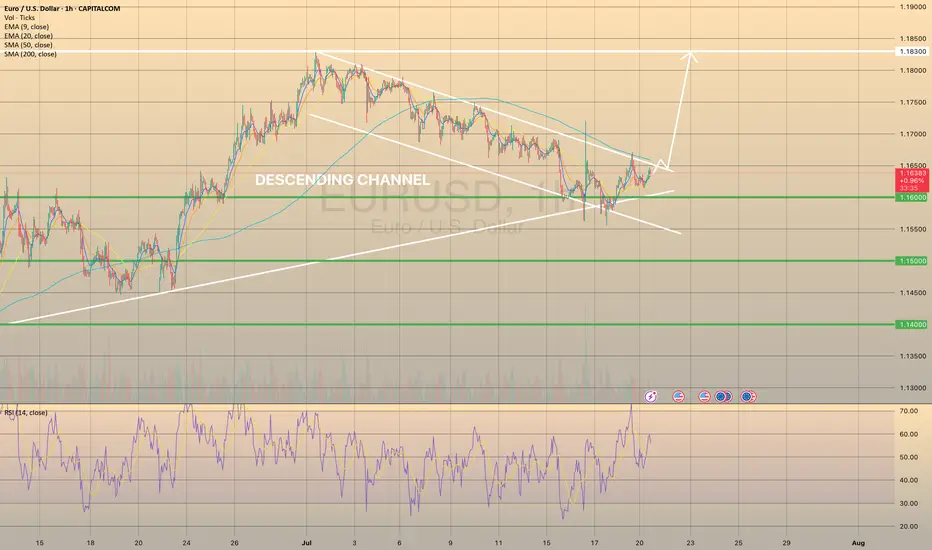
EURUSD FOUND SUPPORT, READY TO BREAK THE CHANNELEURUSD FOUND SUPPORT, READY TO BREAK THE CHANNEL🔥
EURUSD has been trading within the descending channel since the beginning of the descending channel. Recently the price reached the major trendline, graph started to show the bullish divergence on the RSI .
What is a bullish divergence?
A technical analysis pattern where the price makes lower lows, but a momentum indicator (e.g., RSI, MACD) forms higher lows, signaling weakening bearish momentum and a potential trend reversal upward.
So, another hike in this pair is expected. Possible direction: spike towards the SMA200, minor pullback and a further development of the bullish impulse.
2025.07.22 LONG EURUSDThis is a long trade on EURUSD utilizing smart money concepts.
There are multiple areas of liquidity pooling above, and now that trendline liquidity has been broken, trade management parameters are in place.
Orders have been transmitted, and this is a swing trade potentially lasting 4-8 weeks.
happy trading all
-kevin
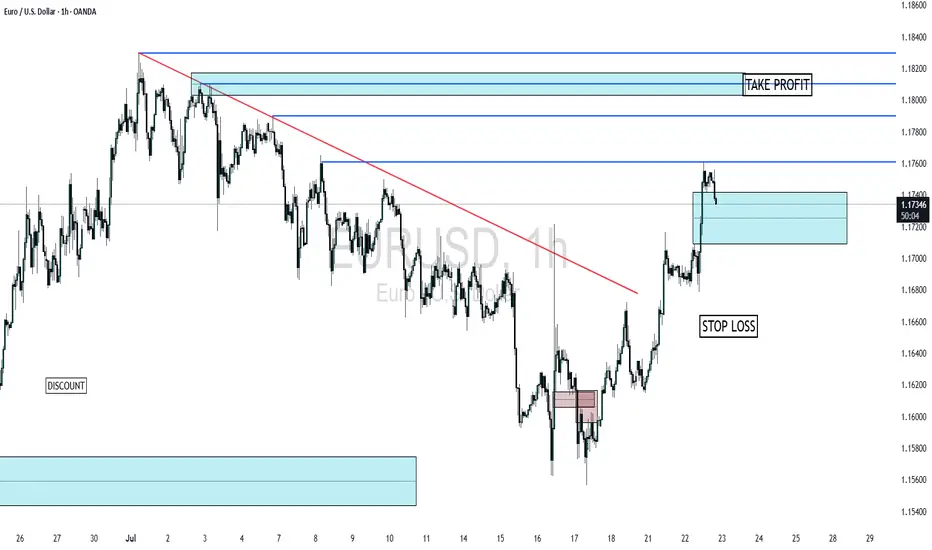
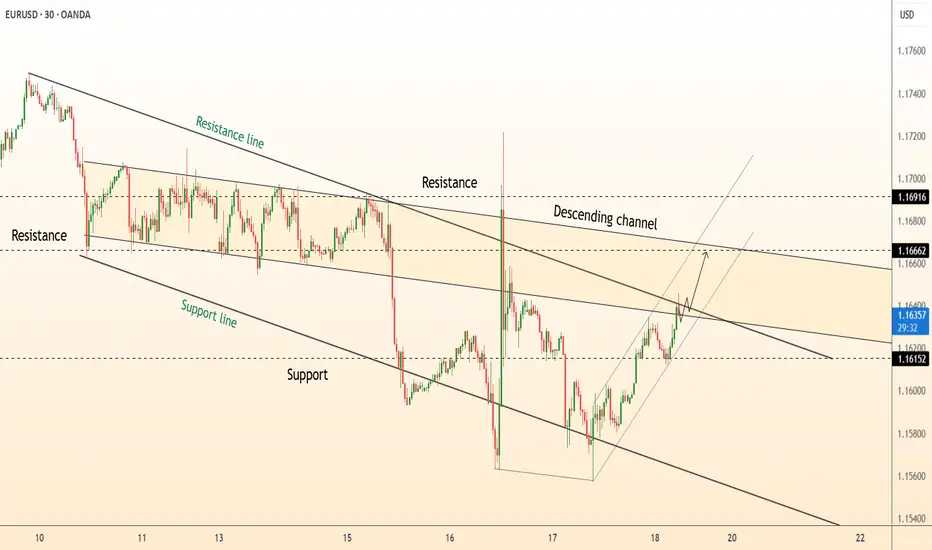
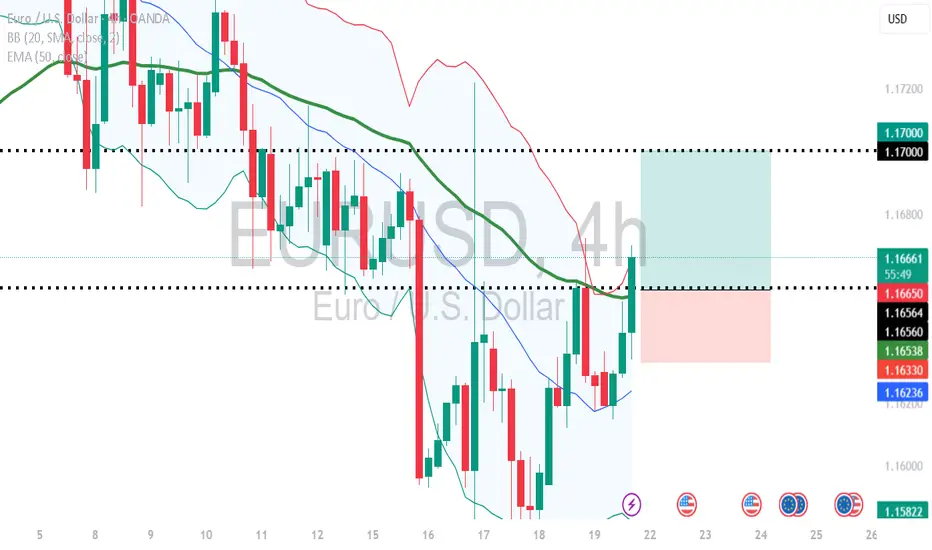
DeGRAM | EURUSD reached the resistance line📊 Technical Analysis
● EUR/USD has reclaimed the inner resistance of the 8-day descending channel after a V-shaped rebound from the lower rail; candles are now riding a fresh micro up-sloper.
● A 30 min close above 1.1666 (channel roof / prior pivot) confirms trend reversal and projects the measured move to the higher congestion band at 1.1690-1.1700.
💡 Fundamental Analysis
● Yesterday’s dip in US 2-yr yields after weaker Philly-Fed new-orders and higher jobless claims softens dollar demand, while ECB minutes signalled no rush to ease further, supporting the euro.
✨ Summary
Long 1.1630-1.1650; break of 1.1666 targets 1.1690 → 1.1700. Invalidate on an H1 close below 1.1585.
-------------------
Share your opinion in the comments and support the idea with a like. Thanks for your support!