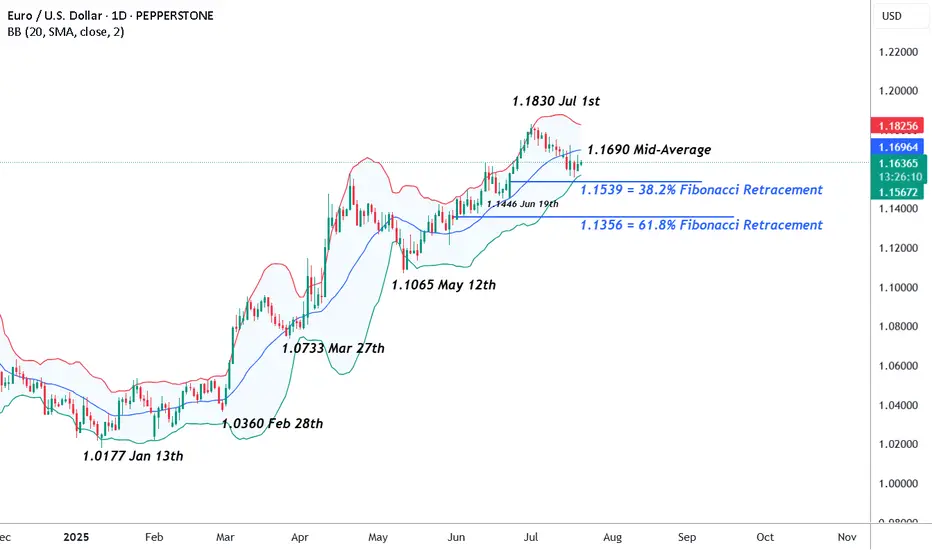
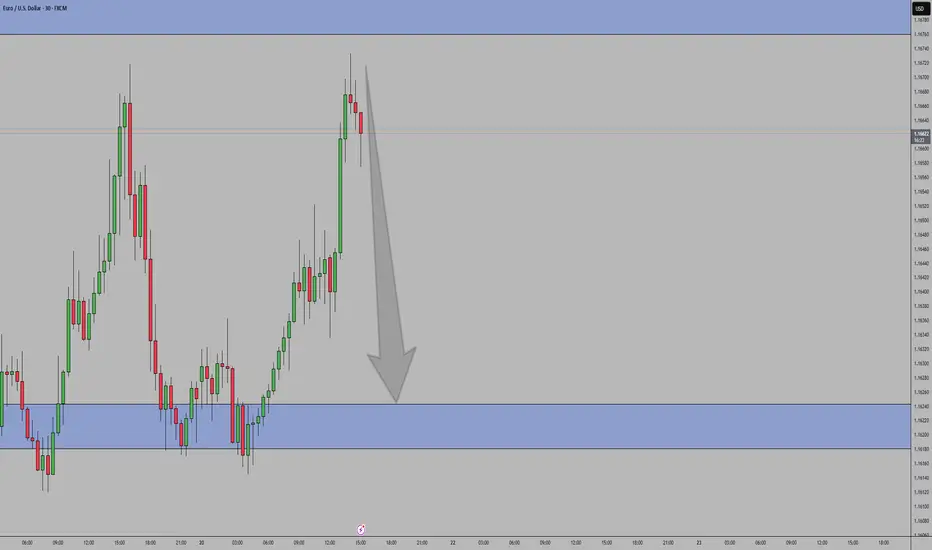
EURUSD – Preparing For Potential Volatility AheadThe week ahead has all the elements to be a volatile one for EURUSD traders to navigate. First, the unwind of long positions that has been on-going throughout July, since prices hit a 4 year high at 1.1830 on July 1st may have potentially found a short-term base after rebounding last week from printing a low of 1.1556 on Thursday. More on this in the technical section below.
Secondly, Bloomberg reported over the weekend that negotiations to agree a trade deal between the US and EU are proving to be more challenging than initially hoped. This leaves room for market moving headlines on this topic, or social media posts from President Trump that could influence the direction of FX markets, especially if it shifts trader expectations towards preparing for the prospect of a trade war between these two global economic heavyweights.
Then on Thursday, consideration needs to be given to the ECB interest rate decision (1315 BST) and then the press conference led by ECB President Lagarde, which starts at 1345 BST. After eight consecutive rate cuts at their previous meetings, the European Central Bank are expected to take a pause to assess incoming inflation and growth data, so this outcome would probably not be a surprise. However, the comments of Madame Lagarde in the press conference could increase EURUSD volatility given that there is some uncertainty surrounding whether a further rate cut is possible either in September, or later in the year.
Technical Update: Limited Price Correction or Reversal?
We all know well, even if an asset is trading within a positive uptrend, periods of price weakness can materialise, before fresh buying support develops. This can lead to renewed price strength that manages to break and close above a previous high, leading to an extension of a pattern of higher price highs and higher price lows.
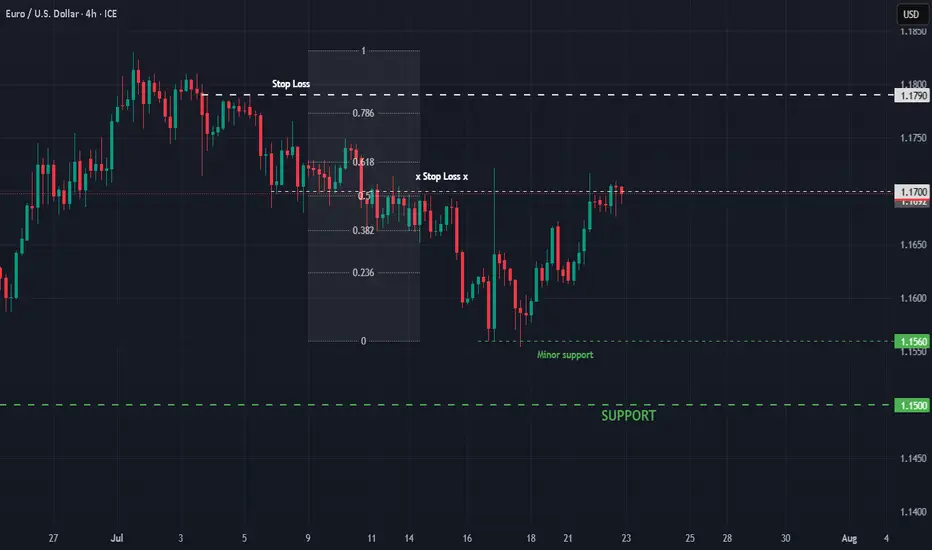
Having been capped by the July 1st high at 1.1830, EURUSD has seen a price correction develop. Traders may be trying to decide if this is a limited move lower before fresh price strength is seen, or if it could be a price reversal, which may result in risks of a more extended phase of price weakness.
Much will depend on the outcome of the risk events outlined above, as well as future market sentiment and price trends, however it is possible to assess what may be the important support and resistance levels that traders could focus on to help gauge the next direction of price activity
Potential Support Levels:
After a period of price strength, it can be useful to calculate Fibonacci retracements on the latest up move to identify areas of potential support. As the chart below shows, for EURUSD, the latest phase of price strength seen from 1.1065 the May 12th low up to 1.1830, the July 1st high can be used for this purpose.
The 38% retracement of this advance stands at 1.1539 and after having remained intact during last week’s sell off, traders may now be watching how this support level performs on a closing basis.
Breaks below 1.1539, while not a guarantee of further price declines, may then lead to a deeper phase of weakness towards 1.1446, the June 19th low, even 1.1356, which is equal to the lower 61.8% retracement level.
Potential Resistance Levels:
If the 38% retracement support at 1.1539 holds any future price weakness in the week ahead, a positive trending condition may still be in place, opening the possibility of EURUSD moving back to higher levels again.
Any potential upside move could bring 1.1690 into play as an important resistance. This is the current level of the Bollinger mid-average, with closing breaks above this needed to open retests of 1.1830 July 1st highs, maybe further if this is in turn broken.
The material provided here has not been prepared accordance with legal requirements designed to promote the independence of investment research and as such is considered to be a marketing communication. Whilst it is not subject to any prohibition on dealing ahead of the dissemination of investment research, we will not seek to take any advantage before providing it to our clients.
Pepperstone doesn’t represent that the material provided here is accurate, current or complete, and therefore shouldn’t be relied upon as such. The information, whether from a third party or not, isn’t to be considered as a recommendation; or an offer to buy or sell; or the solicitation of an offer to buy or sell any security, financial product or instrument; or to participate in any particular trading strategy. It does not take into account readers’ financial situation or investment objectives. We advise any readers of this content to seek their own advice. Without the approval of Pepperstone, reproduction or redistribution of this information isn’t permitted.
USDEUR trade ideas
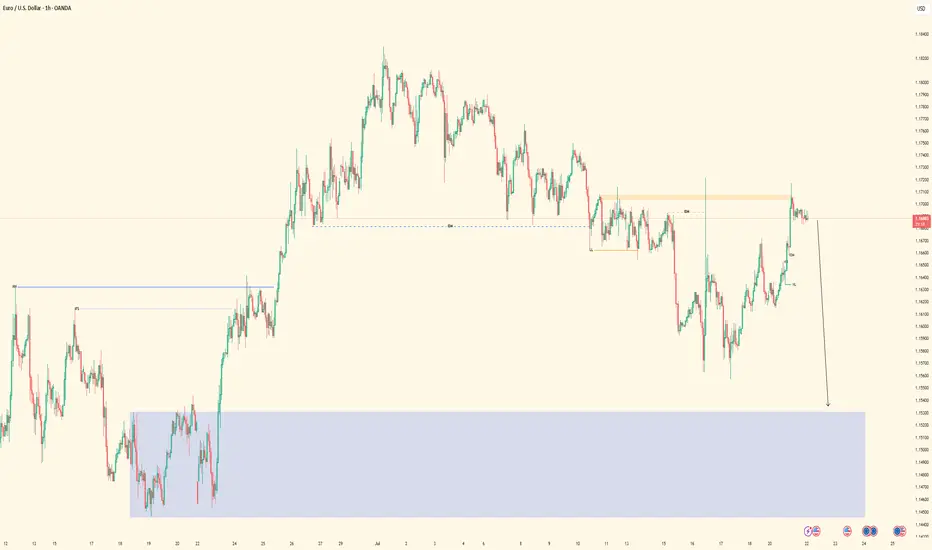
EURUSD: Mid-Term Analysis💶 EURUSD Analysis
The blue boxes under liquidity look good.
📍 The Plan
If price moves into these blue boxes:
✅ Watch for footprint absorption (buyers stepping in)
✅ Look for CDV support or bullish divergence
✅ Wait for a structure reclaim to confirm entry
⚡ Why This Matters
No chasing. No guessing.
These zones are where I’m interested if the market wants to give an opportunity.
🎯 Action Point
If signals align, I will consider a risk-managed long.
If not, I am fine waiting.
Patience and clarity. The right price, or no trade.
EURUSD buyThe eurusd looks set for upward move , its in a huge uptrend on the daily chart so this pullback down looks perfect for a return to the highs, now back to the 2 hr chart and we can see we have clearly bounced off a dynamic support zone not once but twice and formed a double bottom then for the first time since July 4th we have broken up throughout the 50 day moving average breaking the structure and returning back , I can now see a move upwards from here.
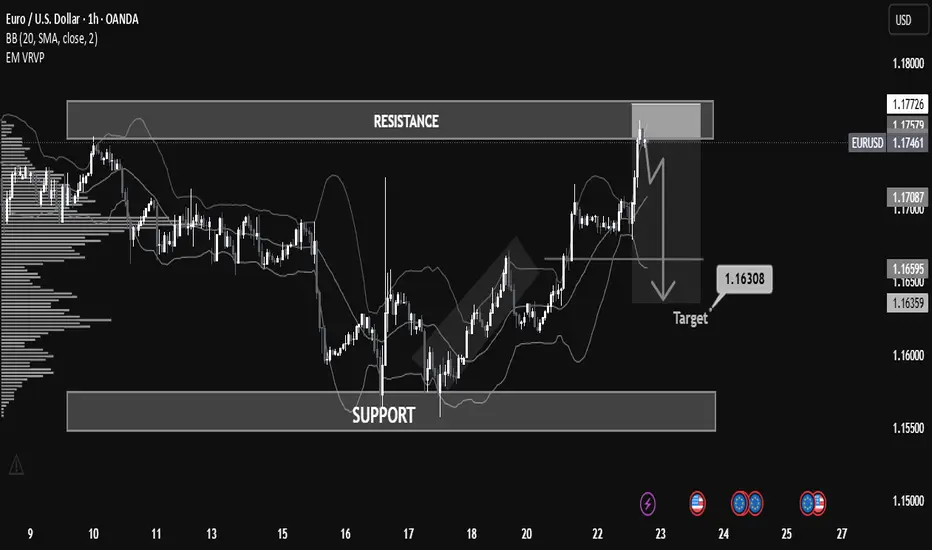
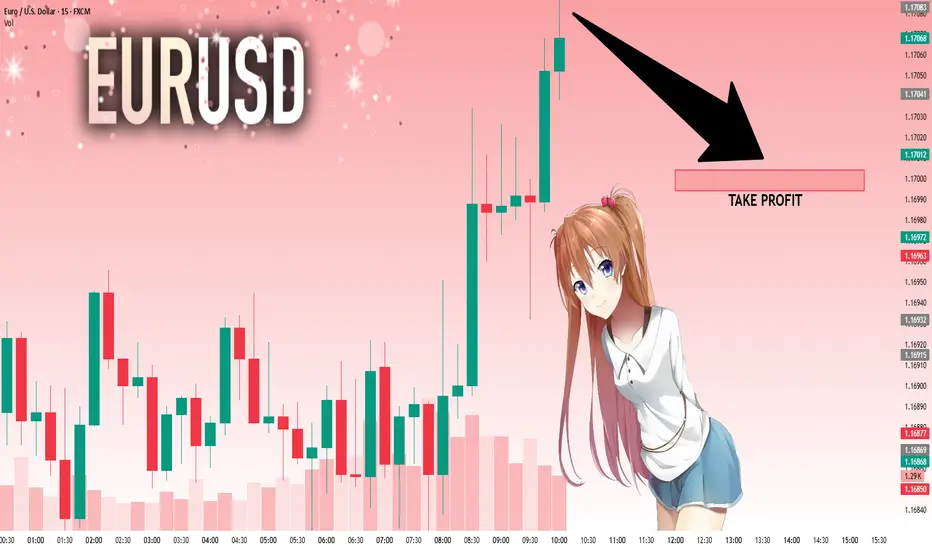
Why EUR/USD Dropped: A Step-by-Step Breakdown for Learners📉 Overview:
The EUR/USD has recently approached a key resistance zone near 1.17726, showing signs of a potential rejection after a bullish rally. The price is currently hovering around 1.17468, forming a short-term bearish setup that could lead to a retracement or reversal.
⸻
⚙ Key Technical Zones:
• 🔼 Resistance: 1.17500 – 1.17726
Price was strongly rejected after testing this area. This level has historically acted as a supply zone.
• 🔽 Support: 1.15500 – 1.16000
This is a historically significant demand zone, where price previously consolidated and reversed.
• 🎯 Target Zone: 1.16308
Marked as a potential take-profit level based on prior price structure and volume profile imbalance.
⸻
🧠 Indicators & Tools:
• Bollinger Bands: Price touched the upper band in overbought conditions, suggesting a possible mean reversion.
• Volume Profile (VRVP): Indicates declining volume near resistance, pointing to weak buyer momentum.
• Price Action: Bearish engulfing candle and strong rejection wick at resistance, confirming selling pressure.
⸻
🧭 Market Bias:
📌 Short-Term Bearish
A short opportunity is forming based on the rejection from resistance and overextension of price.
⸻
🧩 Possible Scenario:
1. Breakdown below 1.17061 (mid-level support) could trigger acceleration to the downside.
2. 1.16500 and 1.16308 are ideal short targets before reevaluation for continuation or bounce.
⸻
🛑 Risk Management Tips:
• Consider SL above 1.17800 (previous high).
• Monitor for confirmation before entry (e.g., bearish candle close below 1.17000).
• Adjust size and risk-reward ratio appropriately.
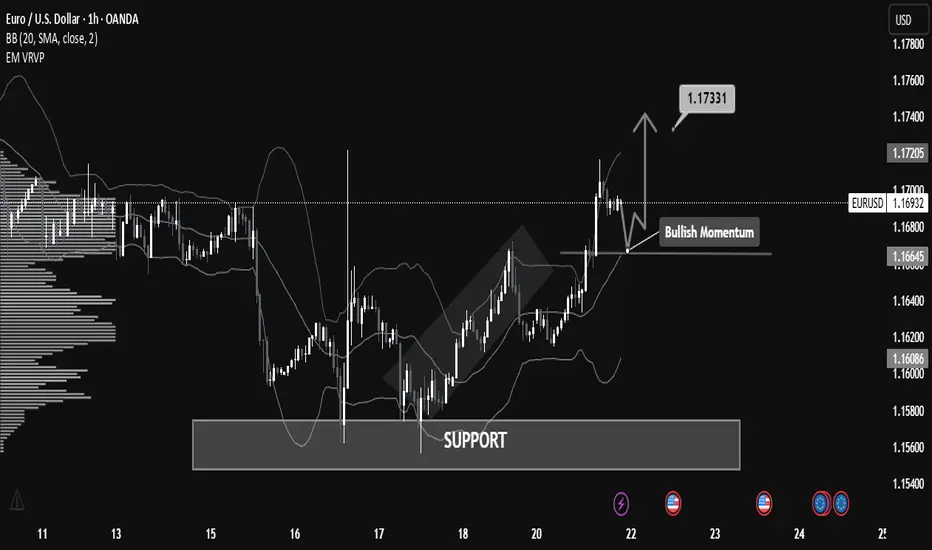
"EUR/USD Technical Blueprint: Bullish Continuation EUR/USD Technical Blueprint: Bullish Continuation Patterns and Strategic Price Zones Explained
🔹 Market Structure & Trend
The chart shows a clear shift from a ranging phase into a bullish breakout:
Price previously consolidated in a broad horizontal channel, with a strong demand zone (support) established between 1.16000 – 1.16600.
Following a deep liquidity grab on July 17-18, the price bounced sharply from support, creating higher highs and higher lows – a classic bullish structure.
Current momentum shows bullish continuation, as the price broke above local resistance around 1.16645 and is now forming a potential bull flag or bullish pennant pattern.
🟢 Bullish Momentum Confirmation
Price is currently retesting the broken resistance (now acting as support at 1.16645).
If the support holds and bullish momentum continues, the measured move target projects a price move toward 1.17331, the next significant resistance level.
This is also supported by increased volume activity in the breakout zone, as seen on the VPVR.
📊 Key Technical Levels
Level Type Description
1.16000 Major Support Historical demand zone + liquidity grab
1.16645 Support Zone Previous resistance, now retest area
1.16926 Current Price Bullish consolidation forming
1.17331 Resistance Bullish target based on breakout projection
1.17700+ Extension Potential continuation level if momentum persists
🧠 Volume & Volatility Insight
Bollinger Bands are expanding post-breakout, indicating increasing volatility and a potential trend continuation.
VPVR shows a high-volume node around 1.166, confirming it as a strong demand zone.
🔎 Outlook & Strategy
✅ Bullish Bias
As long as the price remains above 1.16645, buying dips could be a favorable strategy.
A break above 1.17000 with strong volume could open a path toward 1.1733 and higher.
❌ Invalidation Level
A strong close below 1.16600 would invalidate the bullish setup and could return price to the lower support around 1.16000.
📌 Conclusion
EUR/USD is displaying strong bullish momentum after breaking a key resistance level and forming a solid support base. A breakout above 1.17000 may lead to a continuation toward 1.17331 and potentially higher. This setup favors bullish positioning with tight risk management.
Watch out for EURUSDEURUSD continues to move sideways above the support zone.
This week, the key event is the ECB’s interest rate decision.
Keep an eye on whether there's enough momentum for a breakout above 1,1720.
If it gets rejected again, we might see a deeper correction.
EURUSD LongEURUSD 15-Minute Technical Analysis
EURUSD has broken through a key intraday structure level with strong bullish momentum, indicating continued institutional interest on the buy side. The market is now approaching a higher-timeframe supply region while leaving behind a well-defined demand zone that could serve as a launchpad for further upside.
🔍 Market Structure & Momentum:
Break of Structure (BOS) was confirmed after the recent surge above the previous high, validating the current bullish trend.
Price has rallied aggressively from the IDM low at 1.16908, sweeping short-term liquidity and suggesting smart money involvement.
We are now trading inside a minor supply zone and approaching a broader liquidity cluster between 1.17550 – 1.17800.
🟩 Key Demand Zone
Level: 1.16980 – 1.17100
This zone marks a significant accumulation area where the market built up momentum before the breakout. It's also in line with the IDM (Internal Drawdown Marker), serving as a technical retracement level.
A retracement into this demand zone would align with a classic bullish continuation pattern, offering a potential re-entry area for long positions.
The imbalance left behind further supports this zone’s potential to hold.
🟥 Overhead Supply Zones (Resistance Clusters):
First Zone: 1.17550 – 1.17700
Second Zone (Stronger): 1.17750 – 1.17900
These zones represent unmitigated supply levels from previous sell-offs and may act as profit-taking or short-term reversal points for intraday traders. These areas are where we expect higher levels of volatility and potential bearish reaction before continuation or reversal.
📈 Expectations & Trade Setup:
Anticipation of a retracement into the 1.16980–1.17100 demand zone for price to establish a higher low before pushing toward unfilled liquidity above 1.17550.
If demand holds, a bullish continuation could aim for 1.17750–1.17900, where confluence with past supply suggests caution.
Should price fail to hold the demand, bearish momentum could pull price back toward the lower demand block at 1.16500 (aligned with the 0.5 fib level of the prior impulse).


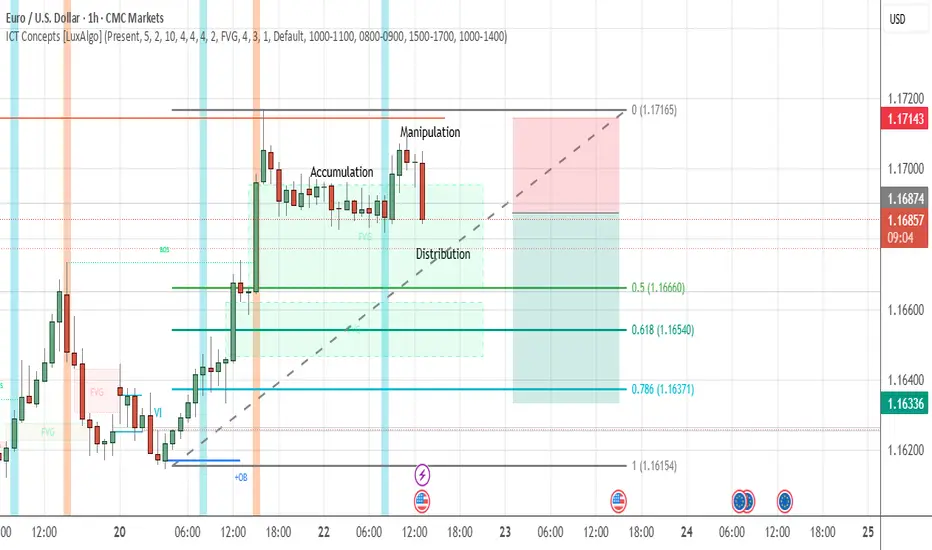
Short terme bearish eurusdafter an accumulation in the london session. At NW opening, there were a manipulation to take a buy side liquidity, atfer that we expect EUR/USD to be at short time bearish to 1.16660.
So : TP = 1.16660 , SL = 1.1709
EURUSD : Not yetBut I think it will be coming soon.
The battle between buyer and seller has been ongoing for more than 30 hours now.
If I SELL too soon (without confirmation), then it is risky, as we have seen that the price still creeps upwards. Wait for Buyer exhaustion.
We will know the winner soon. I will definitely let you know when it happens. Let's make $$$$$
Good luck.
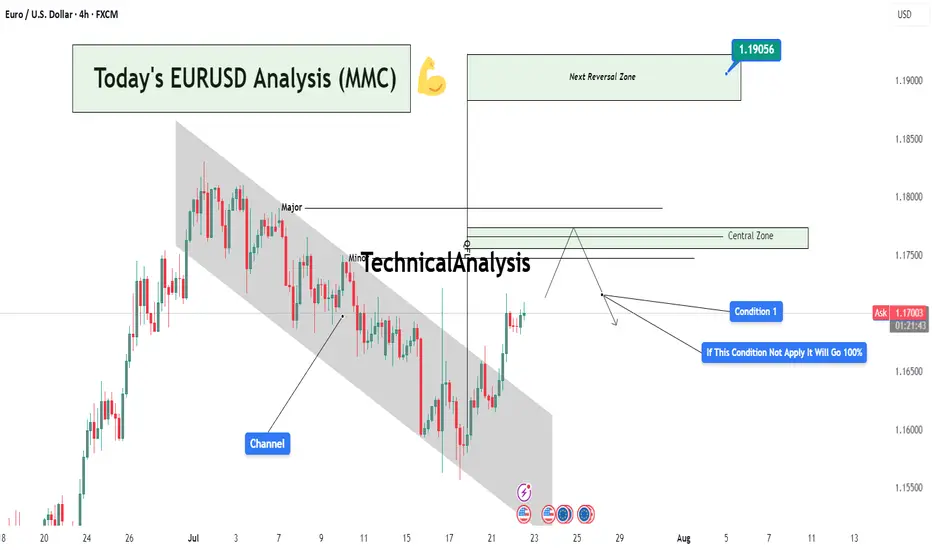
Today's EURUSD Analysis : Channel Break : EURUSD Eyes 1.19056Chart Overview:
The EURUSD pair has broken out of a well-defined descending channel, indicating a potential shift in momentum. Price has now approached a critical Central Zone that acts as a probable reaction or reversal area. This zone lies between minor and major supply levels.
🔍 Key Technical Highlights:
Descending Channel:
Price was previously trapped in a bearish channel. This channel was respected with multiple touches on both upper and lower bounds, showing controlled bearish structure.
Breakout & Momentum Shift:
The recent bullish breakout above the channel suggests buyers are gaining control. A strong candle has closed outside the structure, confirming the breakout.
Major & Minor Zones:
Two levels are marked just above the breakout:
Minor Resistance: First possible supply zone where price may pause.
Major Resistance: A stronger historical level and the top of the Central Zone.
Central Zone Reaction Area (CZRA):
This is the MMC's focus area — price is expected to react here. Either we see a rejection that could confirm a reversal setup, or price slices through, opening the door to the Next Reversal Zone around 1.19056.
📌 Strategic Condition (MMC Logic):
Condition 1:
If price respects the Central Zone and shows bearish signs (e.g., wick rejections, engulfing candles, divergence), we expect a strong pullback or reversal toward previous demand levels.
If Condition 1 Fails:
The annotation clearly states: “If this condition not apply, it will go 100%.”
Meaning: If price breaks and holds above the Central Zone, it confirms bullish strength, targeting 1.19056 — the Next Reversal Zone (NRZ).
📊 Trader's Mindset (MMC Application):
This setup is a classic MMC structure trap-break scenario:
The channel traps sellers,
The breakout invites buyers,
And the Central Zone becomes the battlefield.
Wait for confirmation, not assumption. Whether it's rejection or breakout, risk management and reaction-based trading are key.
EURUSDEURUSD needs one more push up as correction before a drop.
Disclosure: We are part of Trade Nation's Influencer program and receive a monthly fee for using their TradingView charts in our analysis.

EURUSD: Bears Are Winning! Short!
My dear friends,
Today we will analyse EURUSD together☺️
The market is at an inflection zone and price has now reached an area around 1.17083 where previous reversals or breakouts have occurred.And a price reaction that we are seeing on multiple timeframes here could signal the next move down so we can enter on confirmation, and target the next key level of 1.17004..Stop-loss is recommended beyond the inflection zone.
❤️Sending you lots of Love and Hugs❤️

EURUSD bullish breakout supported at 1.1640The EURUSD currency pair continues to exhibit a bullish price action bias, supported by a sustained rising trend. Recent intraday movement reflects a sideways consolidation breakout, suggesting potential continuation of the broader uptrend.
Key Technical Level: 1.1640
This level marks the prior consolidation range and now acts as pivotal support. A corrective pullback toward 1.1640 followed by a bullish rejection would reinforce the bullish trend, targeting the next resistance levels at:
1.1830 – Near-term resistance
1.1900 – Minor swing high
1.1940 – Longer-term bullish objective
On the other hand, a decisive daily close below 1.1640 would invalidate the bullish setup, shifting the outlook to bearish in the short term. This could trigger a deeper retracement toward:
1.1590 – Initial support
1.1530 – Key downside target
Conclusion:
As long as 1.1640 holds as support, the technical outlook remains bullish, favoring long positions on dips. A confirmed break below this level would signal a shift in sentiment and open the door to a corrective pullback phase.
This communication is for informational purposes only and should not be viewed as any form of recommendation as to a particular course of action or as investment advice. It is not intended as an offer or solicitation for the purchase or sale of any financial instrument or as an official confirmation of any transaction. Opinions, estimates and assumptions expressed herein are made as of the date of this communication and are subject to change without notice. This communication has been prepared based upon information, including market prices, data and other information, believed to be reliable; however, Trade Nation does not warrant its completeness or accuracy. All market prices and market data contained in or attached to this communication are indicative and subject to change without notice.
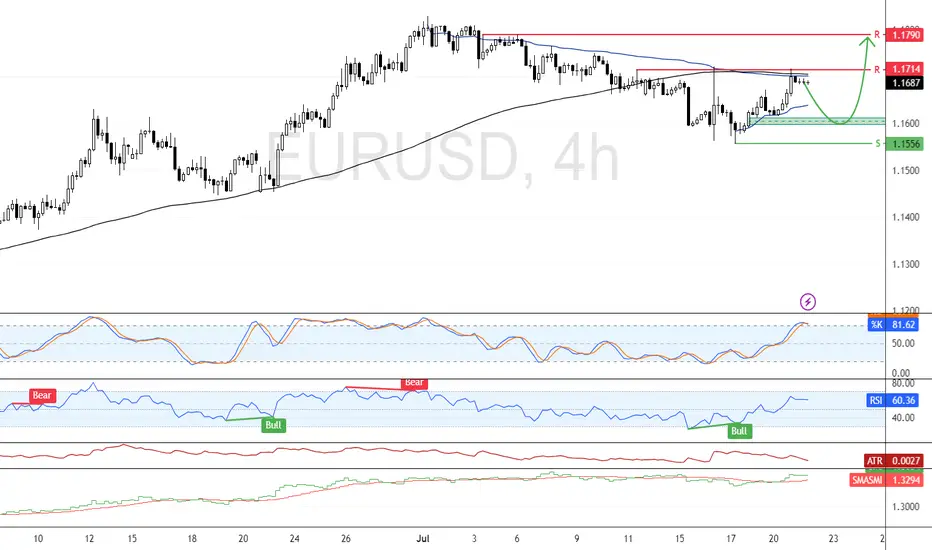
EUR/USD Eyes $1.179 If Resistance BreaksFenzoFx—EUR/USD is testing the 100-day moving average as resistance, a supply zone backed by VWAP at $1.171. The Stochastic Oscillator depicts 81.0 in the description, meaning the Euro is overpriced in the short term.
Therefore, we expect the pair to test the $1.160 demand zone before the uptrend resumes. Furthermore, the bullish outlook remains valid above $1.155, and a break above resistance at $1.171 can trigger the uptrend, targeting $1.179.
EUR-USDKeep an eye on it for buying, be careful if it is on the support level of demand, it has a long
EURUSDEUR/USD may show short-term bullish moves, but with the DXY (U.S. Dollar Index) showing strength and a bullish COT bias, the broader outlook for EUR/USD remains bearish. USD strength typically puts downward pressure on EUR/USD.
#012: LONG Investment Opportunity on EUR/USD
In this scenario, I placed a passive long order on EUR/USD at a key zone that has shown signs of accumulation and institutional defense in recent days.
The price showed bearish manipulation followed by a sharp rebound with a V-shaped pattern, often indicative of stop-loss hunting. In these phases, a direct entry is less effective than a passive strategy aimed at intercepting a possible technical pullback in the zone where abnormal volumes and algorithmic defenses have manifested.
The order was designed to be activated only if the market were to temporarily return to the previously absorbed zone, thus avoiding chasing the price after a directional candlestick.
The stop-loss placement was carefully chosen to avoid both typical retail hunting zones and areas visible to algorithms. It is positioned to ensure operational invisibility, but also consistency with the logic of institutional defense: if reached, the trade will be automatically invalidated.
The target is aligned with the superior technical structure and the normal range of movement that develops when this dynamic is respected.
This operation is designed to be left to operate completely autonomously, without the need for adjustments or active management. Either in or out. The sole objective is to align with institutional flows, with controlled risk and a favorable management structure.
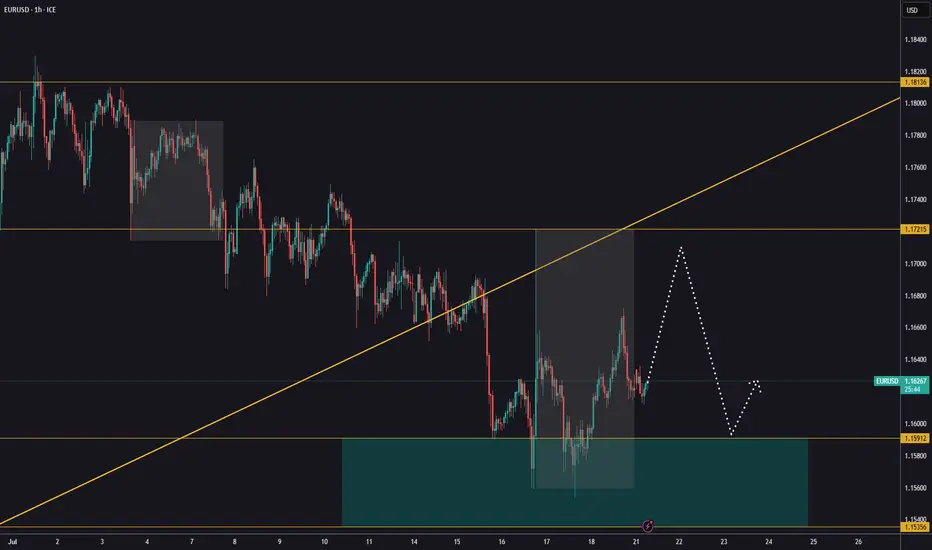
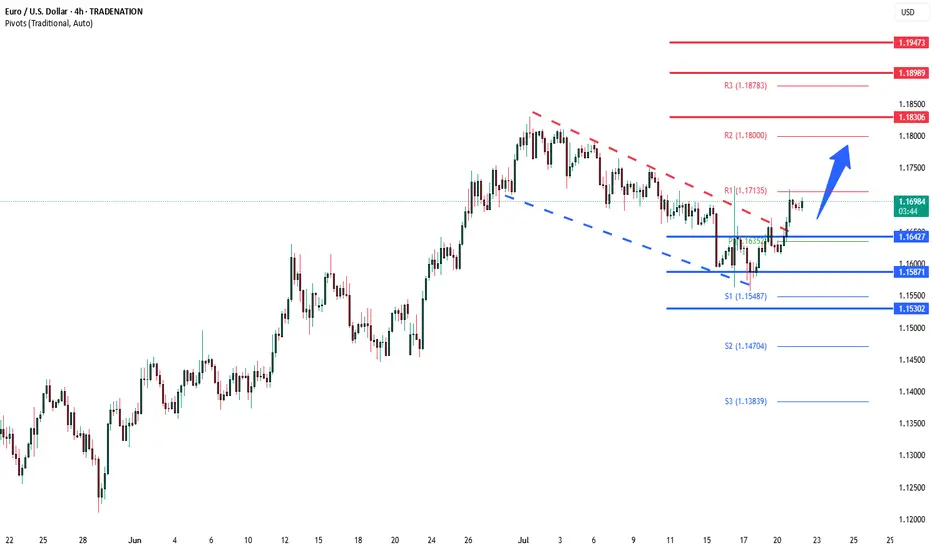
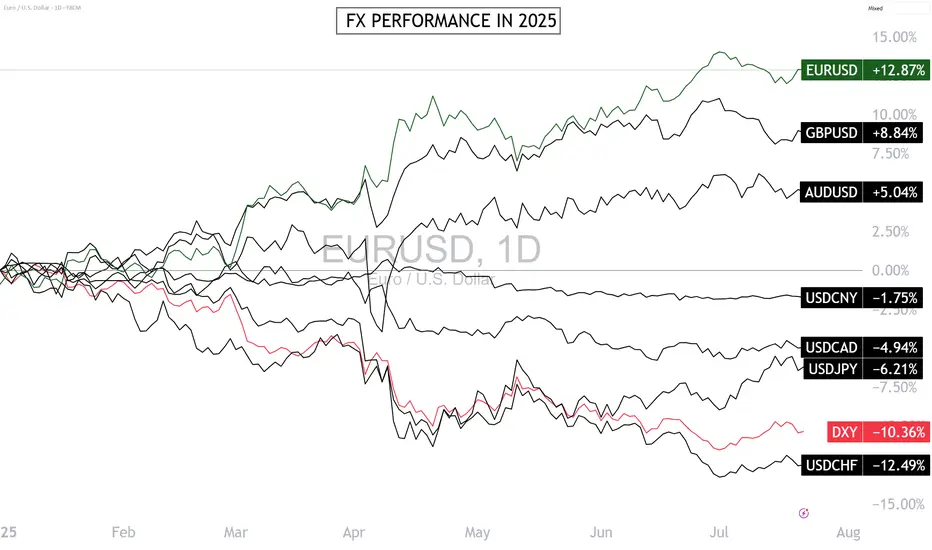
Can the Euro-Dollar Maintain Its Leadership in the FX Market?The Euro-Dollar is the best-performing major FX pair in 2025, and a short-term consolidation phase has begun below $1.18. This strength of the euro-dollar is surprising given the divergence in monetary policies. Can the euro-dollar go higher this year? How can this strength be explained fundamentally? In this week of ECB monetary policy decision (Thursday, July 24), let’s take a technical and fundamental look at the euro-dollar, which is stalling after reaching the technical resistance at $1.18.
1) Euro-Dollar’s Leadership in 2025 Defies the Logic of Monetary Policy Divergence
2025 is proving surprising in the FX market: the euro-dollar (EUR/USD) is the top-performing pair, with a gain of over 12% since the beginning of the year. This outperformance is puzzling if we rely on classic monetary fundamentals. The divergence between the Federal Reserve (Fed) and the European Central Bank (ECB) should favor the dollar.
The Fed maintains a prolonged monetary status quo with high rates due to persistent inflation and labor market tensions. In contrast, the ECB continued its rate-cutting cycle, reflecting a weaker European economy and better-contained inflation. Theoretically, this monetary asymmetry should have strengthened the dollar — yet the euro leads. This paradox is explained by a combination of fundamental factors.
2) Unexpected Fundamentals Are Driving the Euro-Dollar’s Strength in 2025
The euro-dollar’s bullish trend this year ignores the interest rate differential between the Fed and the ECB, both current and projected for the end of 2025.
Here’s a summary of the bullish fundamentals that allowed the euro-dollar to overlook monetary divergence:
• Trump administration’s fiscal policy raises concerns over U.S. debt sustainability (see long-term bond yields)
• Trade war initiated by the Trump administration creates economic slowdown risks for U.S. companies heavily reliant on international trade
• U.S. administration’s political will to improve currency competitiveness for exporters
• European stocks catching up to U.S. stocks in valuation
• Emerging markets’ will to diversify their public debt issuance
• Euro catching up as a global reserve currency as diversification away from the U.S. dollar
• Germany’s structural shift in fiscal and debt policy with massive investments in defense and industry
• EU stimulus spending and the ECB’s perceived monetary policy coherence
3) Is $1.18 the Final High for the Euro-Dollar in 2025? Probably Not.
The euro-dollar has been consolidating since early July after hitting $1.18. Is this the peak for the year? The answer is no — unless EUR/USD breaks below the $1.13/$1.15 support and unless institutional net positions reverse from their upward trend (see yellow line in CFTC COT data).
DISCLAIMER:
This content is intended for individuals who are familiar with financial markets and instruments and is for information purposes only. The presented idea (including market commentary, market data and observations) is not a work product of any research department of Swissquote or its affiliates. This material is intended to highlight market action and does not constitute investment, legal or tax advice. If you are a retail investor or lack experience in trading complex financial products, it is advisable to seek professional advice from licensed advisor before making any financial decisions.
This content is not intended to manipulate the market or encourage any specific financial behavior.
Swissquote makes no representation or warranty as to the quality, completeness, accuracy, comprehensiveness or non-infringement of such content. The views expressed are those of the consultant and are provided for educational purposes only. Any information provided relating to a product or market should not be construed as recommending an investment strategy or transaction. Past performance is not a guarantee of future results.
Swissquote and its employees and representatives shall in no event be held liable for any damages or losses arising directly or indirectly from decisions made on the basis of this content.
The use of any third-party brands or trademarks is for information only and does not imply endorsement by Swissquote, or that the trademark owner has authorised Swissquote to promote its products or services.
Swissquote is the marketing brand for the activities of Swissquote Bank Ltd (Switzerland) regulated by FINMA, Swissquote Capital Markets Limited regulated by CySEC (Cyprus), Swissquote Bank Europe SA (Luxembourg) regulated by the CSSF, Swissquote Ltd (UK) regulated by the FCA, Swissquote Financial Services (Malta) Ltd regulated by the Malta Financial Services Authority, Swissquote MEA Ltd. (UAE) regulated by the Dubai Financial Services Authority, Swissquote Pte Ltd (Singapore) regulated by the Monetary Authority of Singapore, Swissquote Asia Limited (Hong Kong) licensed by the Hong Kong Securities and Futures Commission (SFC) and Swissquote South Africa (Pty) Ltd supervised by the FSCA.
Products and services of Swissquote are only intended for those permitted to receive them under local law.
All investments carry a degree of risk. The risk of loss in trading or holding financial instruments can be substantial. The value of financial instruments, including but not limited to stocks, bonds, cryptocurrencies, and other assets, can fluctuate both upwards and downwards. There is a significant risk of financial loss when buying, selling, holding, staking, or investing in these instruments. SQBE makes no recommendations regarding any specific investment, transaction, or the use of any particular investment strategy.
CFDs are complex instruments and come with a high risk of losing money rapidly due to leverage. The vast majority of retail client accounts suffer capital losses when trading in CFDs. You should consider whether you understand how CFDs work and whether you can afford to take the high risk of losing your money.
Digital Assets are unregulated in most countries and consumer protection rules may not apply. As highly volatile speculative investments, Digital Assets are not suitable for investors without a high-risk tolerance. Make sure you understand each Digital Asset before you trade.
Cryptocurrencies are not considered legal tender in some jurisdictions and are subject to regulatory uncertainties.
The use of Internet-based systems can involve high risks, including, but not limited to, fraud, cyber-attacks, network and communication failures, as well as identity theft and phishing attacks related to crypto-assets.
EURUSD - Sell Setup in ProgressPair: EURUSD
Bias: Bearish
HTF Overview: Structure leaning bearish — price respecting recent lower highs with room to fall into deeper 4H demand.
Current Zone: Price just mitigated the 30M sell-side OB, showing early signs of reaction.
LTF Confirmation: Still in observation mode — waiting for 5M or 1M confirmation to trigger short entries with confidence.
Entry Zone: Focused on refined LTF shift beneath the 30M OB — ideal setup includes inducement or liquidity run before executing.
Targets: First target is intraday low — ultimate target is the strong 4H demand zone below.
Mindset Note: Let the market bring the entry to you — don’t jump ahead of confirmation. Smart patience wins.
Bless Trading!