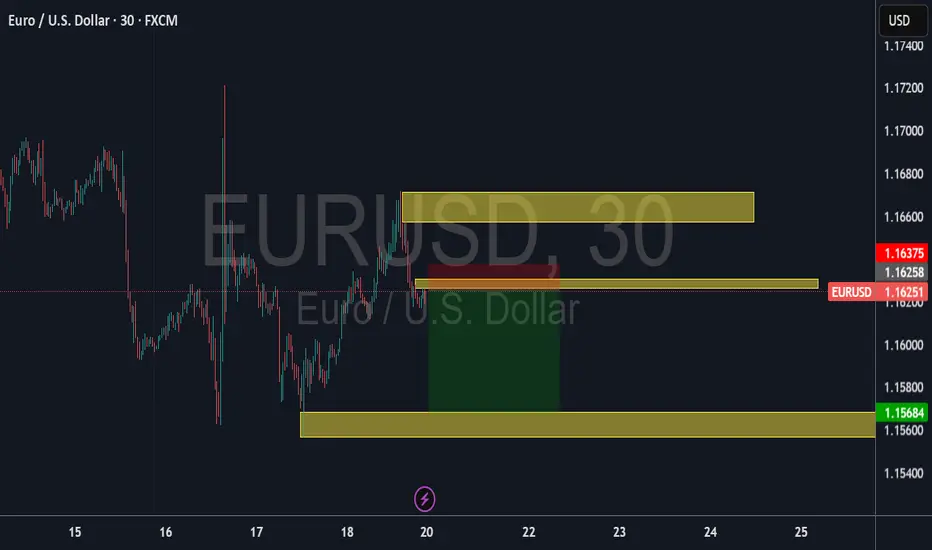
Am selling........Currency Pair: Euro / U.S. Dollar (EUR/USD)
Timeframe: 30-minute intervals (H1)
Data Source: FXCM
Price Data:
Open: 1.16265
High: 1.16275
Low: 1.16189
Close: 1.16251
Change: -0.00014 (-0.01%)
Price Levels:
The chart displays price levels ranging from 1.17400 (highest) to 1.15400 (lowest), with the current price near 1.16251.
Notable levels include 1.16258 (near the close) and 1.15684 (support level).
Time Axis:
The horizontal axis shows time intervals, likely for July 20, 2025, with labels at 15, 16, 17, 18, 20, 22, 23, 24, and 25 (possibly representing hours in UTC).
Chart Type:
The chart appears to be a candlestick or line chart, though the specific type isn't visible in the provided data.
Observations:
The EUR/USD pair showed minimal movement during this period, with a slight decline of -0.01%.
The price traded in a tight range between 1.16189 (low) and 1.16275 (high).
The close (1.16251) was slightly below the open (1.16265), indicating minor bearish pressure.
USDEUR trade ideas
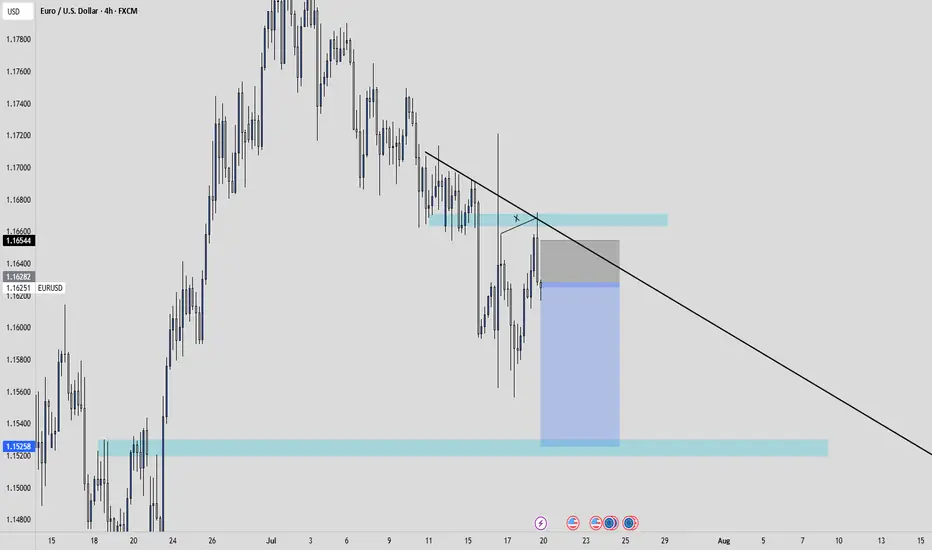
EURUSD SHORTS IDEA
Key take away poins : FX:EURUSD
Fundamental :
The Euro has been weaker because of USA's tariff on the EU. Which caused an increased demand for USD, as the tariffs supports US economical growth, which boost the short term currency strength.
Technical :
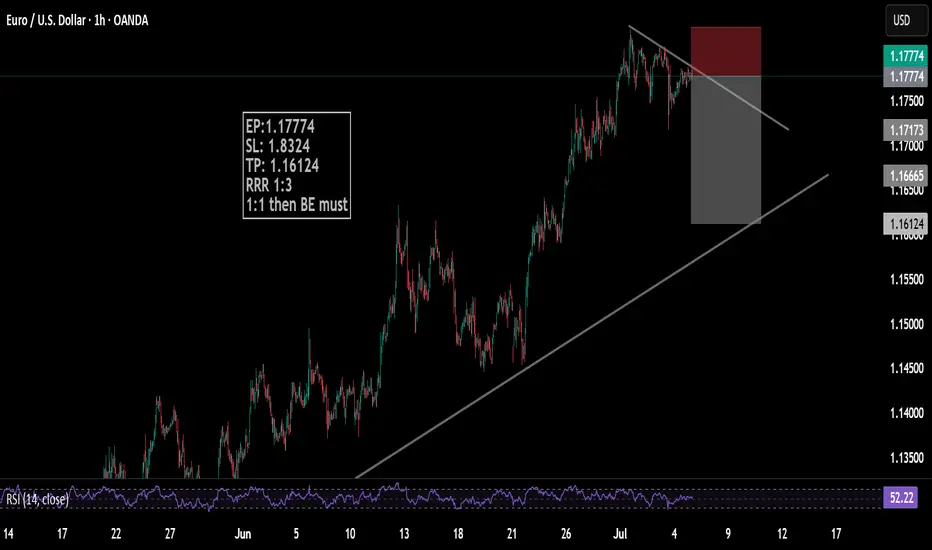
EURUSD has made a break and retest of a previous SnR area.
We printed a H4 engulfing after we swept liquidity.
We have a strong LQ grab
Price retested a really POWERFUL trendline.
I will look to enter directly at the engulfing for some sell opportunities.
TMAS20X, entertainement purpose only. Not financial advice.
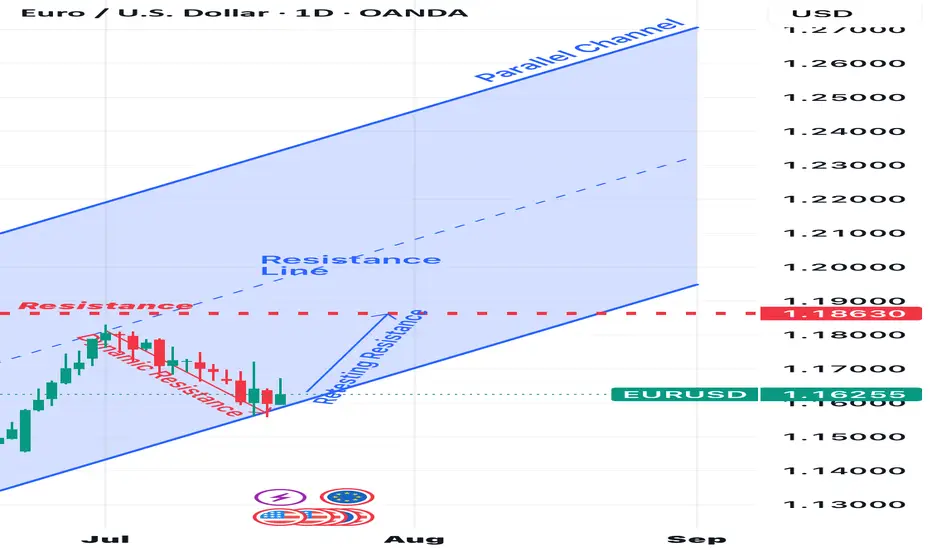
BULLISH RUN ON EURUSD…When placing a parallel channel on the Daily timeframe on EU, it failed to breach through halfway of the channel. This means there’s not enough bullish momentum and therefore expecting a bearish signals at 1.18630
Eurusd sellStrong sell expected
Monthly and weekly overbought pair
Daily time frame buy trend break confirmation
Ready for the bearish correction
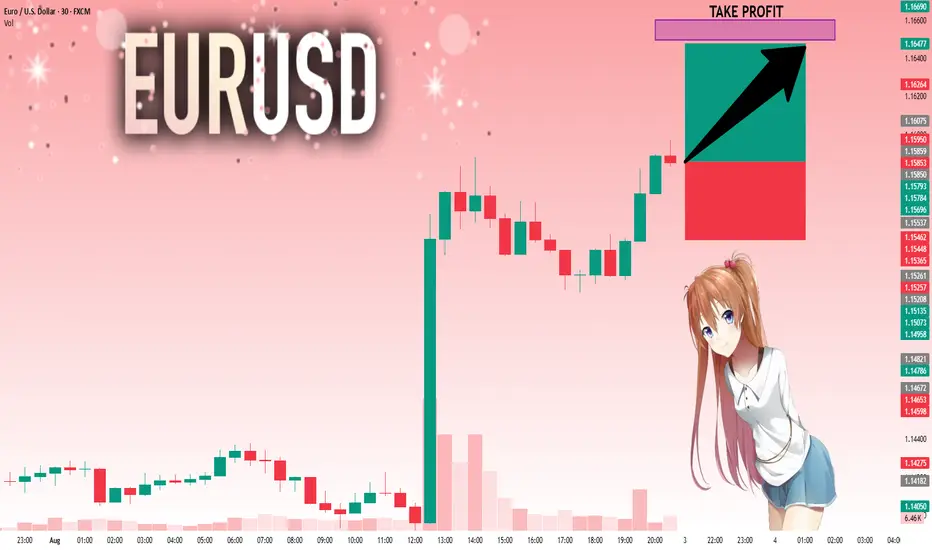
EURUSD - BUY - Doesn't need any more confirmations..EURUSD - Bumping short term. Get your entries. Doesn't need any more confirmations..

EURUSD Analysis week 30🌐Fundamental Analysis
The USD rose after June retail sales beat expectations and initial jobless claims fell to 221,000. However, the USD's gains were limited as US stocks rebounded late in the session.
On Friday morning, US stock index futures rose 0.2%, indicating that risk sentiment remains dominant. If this trend continues, EUR/USD could hold support.
The next focus is on the Consumer Sentiment and Inflation Expectations Index data from the University of Michigan. If the data is positive, the USD could regain support and put pressure on EUR/USD.
🕯Technical Analysis
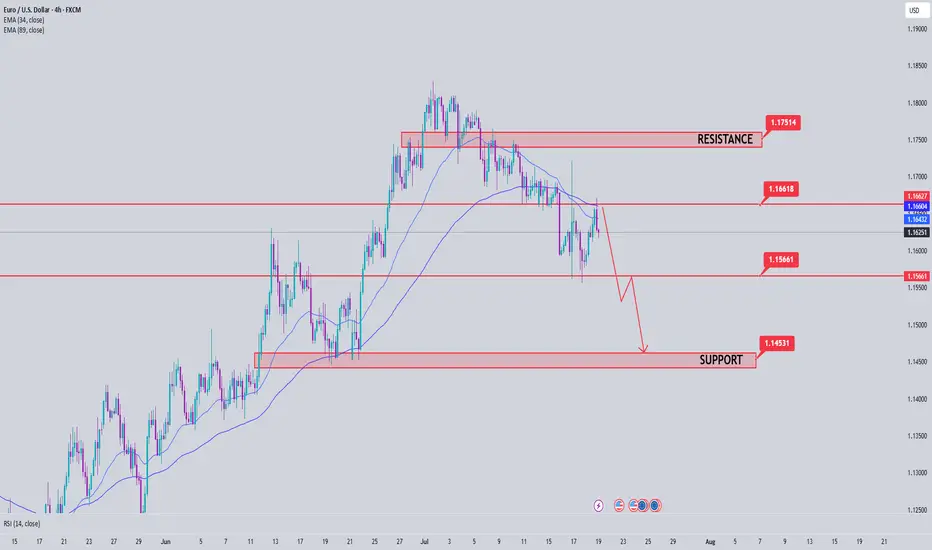
EURUSD is in a corrective downtrend towards the 1.145 support. If this support zone is broken, the EURUSD trend will turn to a Downtrend. Currently, the main trading strategy will be to look for SELL points. After price reacted at EMA and trendline and headed to temporary bottom 1.156 and hit important support soon.
📈📉Trading Signals
SELL EURUSD 1.17500-1.17700 Stoploss 1.18000
BUY EURUSD 1.14500-1.14300 Stoploss 1.14000
EURUSD Is Weaker vs USD. Look For Sells!Welcome back to the Weekly Forex Forecast for the week of July 21-25th.
In this video, we will analyze the following FX market:
EURUSD
Expecting the USD to continue to push higher, which would further drag the EURO down. Look to take advantage of this dynamic and wait for sell setups!
Enjoy!
May profits be upon you.
Leave any questions or comments in the comment section.
I appreciate any feedback from my viewers!
Like and/or subscribe if you want more accurate analysis.
Thank you so much!
Disclaimer:
I do not provide personal investment advice and I am not a qualified licensed investment advisor.
All information found here, including any ideas, opinions, views, predictions, forecasts, commentaries, suggestions, expressed or implied herein, are for informational, entertainment or educational purposes only and should not be construed as personal investment advice. While the information provided is believed to be accurate, it may include errors or inaccuracies.
I will not and cannot be held liable for any actions you take as a result of anything you read here.
Conduct your own due diligence, or consult a licensed financial advisor or broker before making any and all investment decisions. Any investments, trades, speculations, or decisions made on the basis of any information found on this channel, expressed or implied herein, are committed at your own risk, financial or otherwise.

EU could go up againHi traders,
Last week EU continued the slowly down movement to the next bullish Daily FVG. Price rejected from there and swept the low of the rejection. After that it slowly went up again.
Next week we could see price go higher for the start of the next (impulsive or corrective) wave up.
Let's see what the market does and react.
Trade idea: Wait for the finish of a correction down and a change in orderflow to bullish on a lower time frame to trade longs.
If you want to learn more about trading with FVG's, liquidity sweeps and Wave analysis, then make sure to follow me.
This shared post is only my point of view on what could be the next move in this pair based on my technical analysis.
Don't be emotional, just trade your plan!
Eduwave
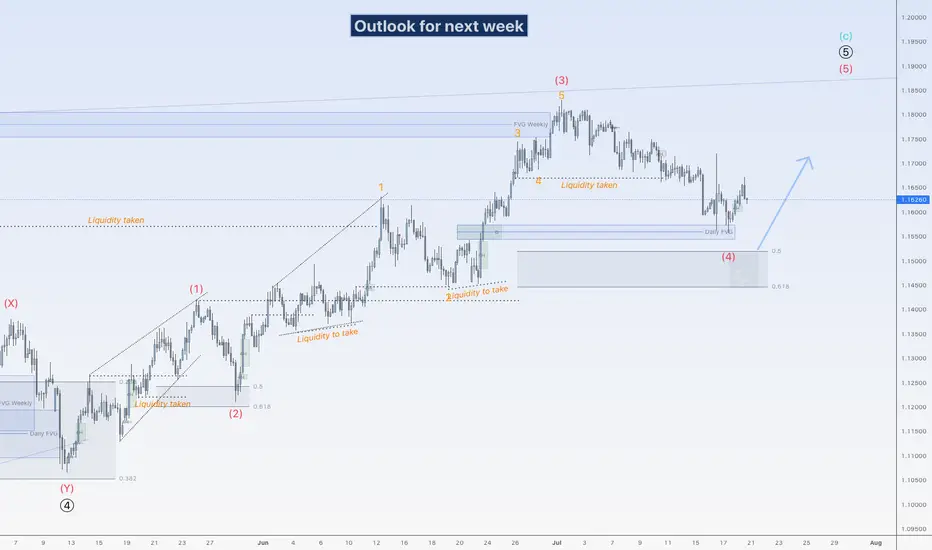
The outlook for EUR/USD in the upcoming weekIn the past week, EUR was in a downtrend on the lower cycles, while showing a corrective move on the higher ones.
Following Friday’s news, we saw a strong bullish candle. Unfortunately, the market closed shortly after, so we couldn't confirm whether it was the beginning of a solid trend or just a reaction to the news.
As a result, in the coming week, we need to be more cautious and patient when looking for setups. Since the recent candles were news-driven, it's important to wait for a clear confirmation before acting.
In the chart, three possible scenarios have been outlined — be prepared for any of them.
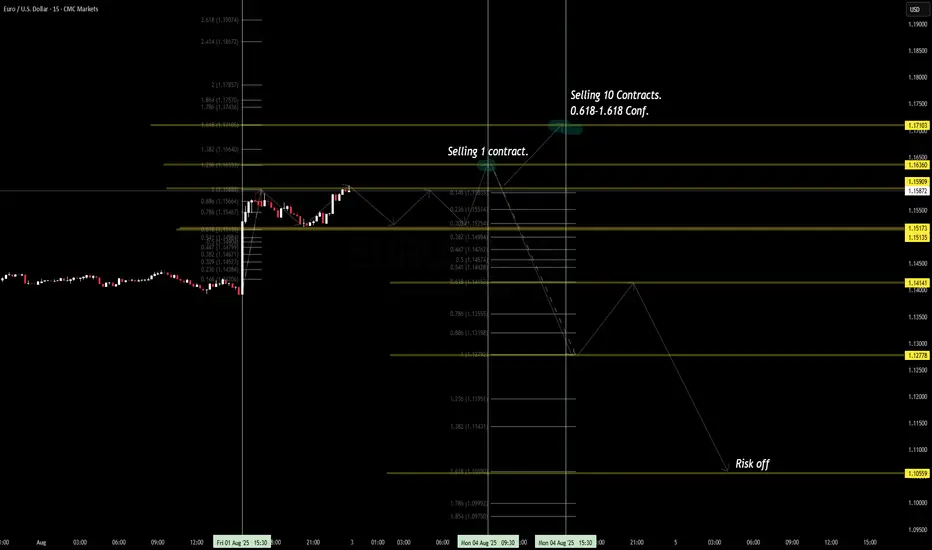
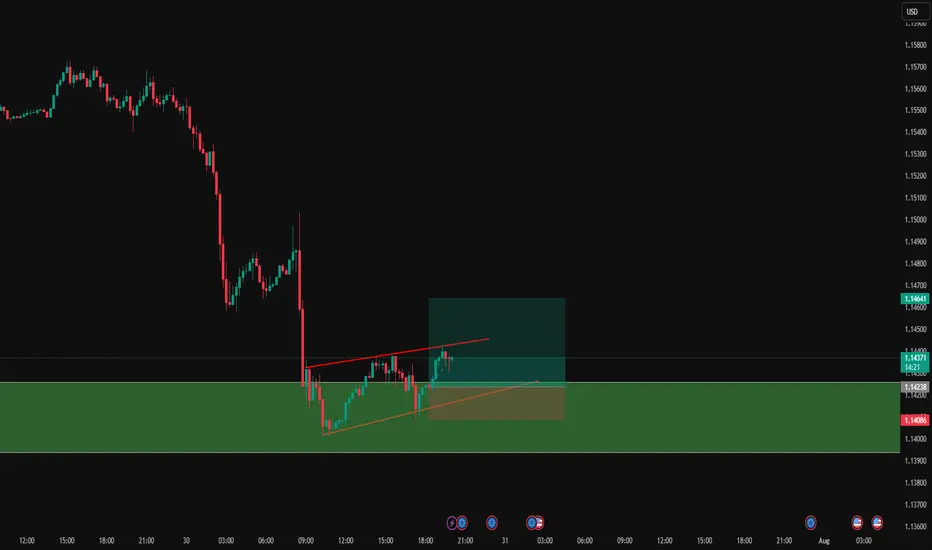
6F EUR/USD Trade Plan (15-Minute Chart)Structure & Fibonacci Setup
Swing low at 1.14994 (Aug 1 15:30) → swing high at 1.15935 (Aug 4 09:30).
Draw 0–100% retracement; project extensions beyond 100% for targets (Murphy, 1999).
Entries
First Scale-In:
Sell 1 contract at the 14.6% retracement (~1.15835).
Full Position:
Sell 10 contracts at the Fib 61.8–161.8% extension confluence (~1.17103).
Profit-Taking Levels
TP 1: Fib 78.6% extension at 1.14141
TP 2: Fib 100% extension at 1.12778
TP 3: Fib 161.8% extension (“risk-off” zone) at 1.10559 (Smith, 2023)
Risk Management
Stop-Loss: Above the 200% extension (~1.17857), just beyond the recent swing high (CME Group, 2025).
Position Sizing: Scale in to control risk; initial 1-lot entry limits drawdown if confluence fails.
Rationale
Anticipate Monday risk-off flows to strengthen USD and push EUR/USD lower.
Multi-leg entries align with high-probability Fib confluence zones and macro USD bias (Murphy, 1999; Smith, 2023).
References
CME Group. (2025). Euro FX Futures contract specifications. Retrieved from www.cmegroup.com
Murphy, J. J. (1999). Technical analysis of the financial markets: A comprehensive guide to trading methods and applications. New York Institute of Finance.
Smith, A. (2023). Risk-off and currency correlations. Journal of FX Markets, 5(2), 45–60.
Macro View on EUR/USDMonetary Policy Divergence
The Federal Reserve maintained its target federal funds rate at 4.25 – 4.50 percent, citing a resilient labour market and persistent inflationary pressures (Federal Reserve, 2025).
By contrast, the European Central Bank’s deposit facility rate stands at 2.00 percent, reflecting its earlier tightening cycle and more cautious approach to rate cuts (Federal Reserve Bank of St. Louis, 2025).
Inflation Differential
U.S. headline CPI rose 2.7 percent year-on-year in June 2025, with core CPI at 2.9 percent (U.S. Bureau of Labor Statistics, 2025).
Euro-area inflation was 2.0 percent in June, broadly in line with the ECB’s target (Eurostat, 2025).
Yield Spread
The 10-year U.S. Treasury yield hovered around 4.38 percent, versus roughly 2.4 percent on the bund, underpinning dollar strength (Federal Reserve Bank of St. Louis, 2025).
Growth Outlook
The U.S. economy continues to outperform, supported by robust consumption and a tight labour market.
Advanced-economy growth is projected at 1.4 percent in 2025, with the euro-area likely trailing, given headwinds from energy costs and subdued investment (International Monetary Fund, 2025).
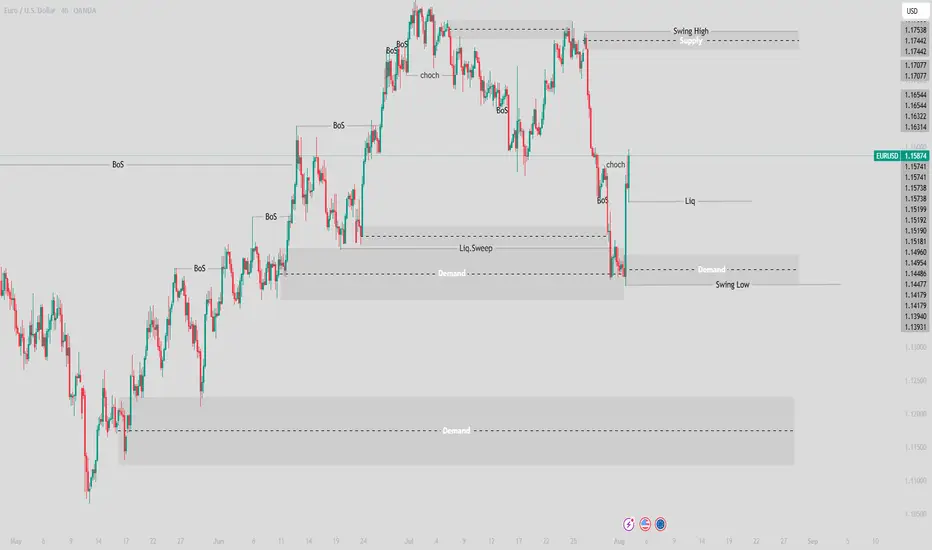
Technical Structure
Downtrend in Place: Recent price action shows a break of the 20-day MA and loss of structure below 1.1700.
Supply Zone near 1.1750–1.1800 offers resistance.
Demand Zones at 1.1100–1.1200 and 1.0750–1.0850 coincide with long-term trendline support (see chart).
Outlook & Scenarios
Near-Term Bearish: Continued USD strength and fading risk appetite may drive EUR/USD toward the 1.1100 demand zone.
Medium-Term Range: If ECB signals a dovish pivot and U.S. data disappoints, expect a bounce into 1.1200–1.1400.
Key Pivot: A sustained break below 1.0750 would open targets toward 1.0200, the “discount” zone from late 2024.
References
European Central Bank. (2025, August 1). ECB deposit facility rate for euro area (ECBDFR) . FRED, Federal Reserve Bank of St. Louis.
Eurostat. (2025, June). Inflation in the euro area . ec.europa.eu
Federal Reserve. (2025, July 30). Federal Reserve issues FOMC statement. www.federalreserve.gov
Federal Reserve Bank of St. Louis. (2025, July 30). Market yield on U.S. Treasury securities at 10-year constant maturity . FRED.
International Monetary Fund. (2025, July). World Economic Outlook Update: July 2025. www.imf.org
U.S. Bureau of Labor Statistics. (2025, July). Consumer Price Index Summary – June 2025. www.bls.gov

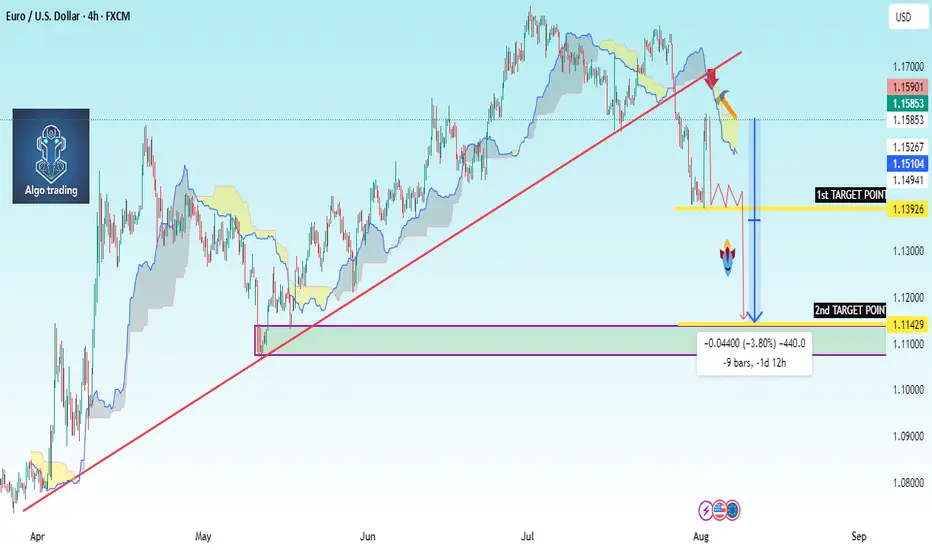
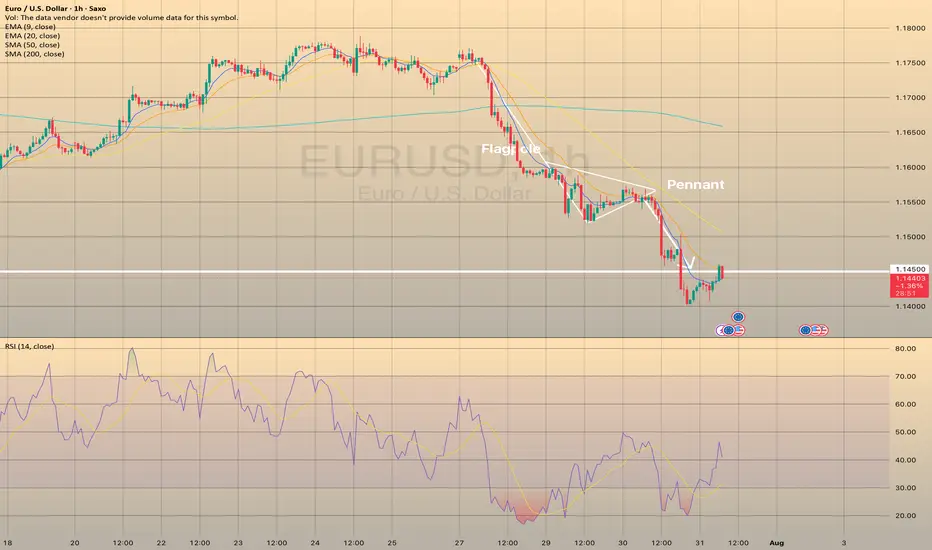
EUR/USD Chart Summary (Bearish Setup):Trendline Break: A long-term bullish trendline has been broken.
Price below Ichimoku Cloud: Indicates bearish momentum.
Bearish Retest: Price pulled back to retest the broken trendline and is now forming a bearish continuation pattern.
Double Target Zones Identified:
1st Target Point: ~1.1329
2nd Target Point: ~1.1144
---
🟠 Suggested Trade Setup:
🔹 Entry (Sell):
Around 1.1585 (where price is hovering now; or on a small pullback).
🔻 Take Profit (TP):
🎯 TP1: 1.1329 (short-term target)
🎯 TP2: 1.1144 (main target if bearish momentum continues)
🛑 Stop Loss (SL):
Place above the recent swing high or cloud resistance — around 1.1670
---
📊 Risk-Reward:
TP1 = ~250 pips
TP2 = ~440 pips
SL = ~85 pips
This gives you a favorable risk-reward (1:3+ to TP
EURUSD: Strong Bullish Sentiment! Long!
My dear friends,
Today we will analyse EURUSD together☺️
The price is near a wide key level
and the pair is approaching a significant decision level of 1.15859 Therefore, a strong bullish reaction here could determine the next move up.We will watch for a confirmation candle, and then target the next key level of 1.16494.Recommend Stop-loss is beyond the current level.
❤️Sending you lots of Love and Hugs❤️
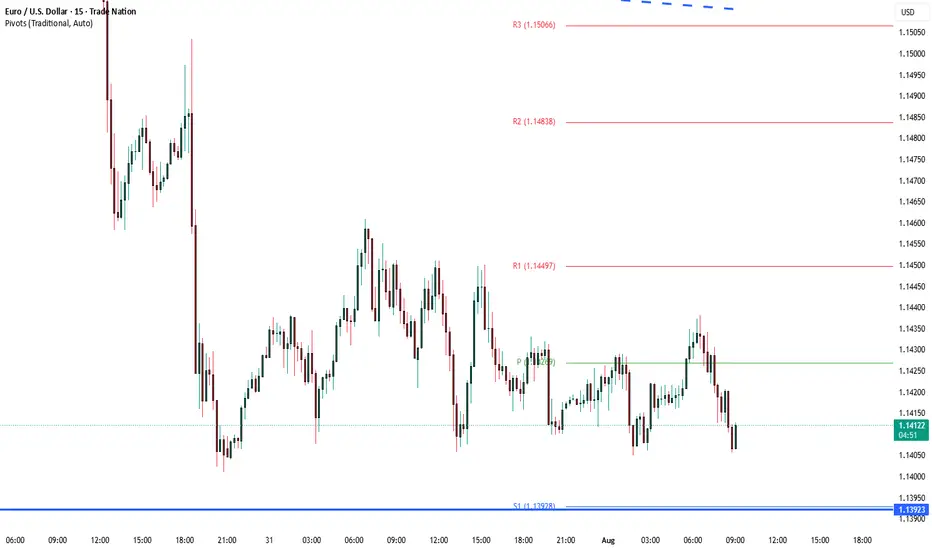
EURUSD The Week AheadKey Support and Resistance Levels
Resistance Level 1: 1.1716
Resistance Level 2: 1.1817
Resistance Level 3: 1.1885
Support Level 1: 1.1466
Support Level 2: 1.1390
Support Level 3: 1.1338
This communication is for informational purposes only and should not be viewed as any form of recommendation as to a particular course of action or as investment advice. It is not intended as an offer or solicitation for the purchase or sale of any financial instrument or as an official confirmation of any transaction. Opinions, estimates and assumptions expressed herein are made as of the date of this communication and are subject to change without notice. This communication has been prepared based upon information, including market prices, data and other information, believed to be reliable; however, Trade Nation does not warrant its completeness or accuracy. All market prices and market data contained in or attached to this communication are indicative and subject to change without notice.

The Day AheadWeekly Summary – Key Data & Earnings (Week Ending August 2, 2025):
Economic Data:
US Jobs Report: Job growth slowed slightly; unemployment ticked up. Supports Fed holding rates steady.
US Manufacturing (ISM): Sector still shrinking, showing weakness.
US Car Sales & Construction: Car sales rose; construction spending up, led by infrastructure.
China Manufacturing: Still contracting due to weak demand.
Japan Jobs Data: Job market remains tight and stable.
Italy: Manufacturing down, car sales slightly up, budget and retail sales steady.
Eurozone Inflation: Inflation slowed, increasing chances of ECB rate cuts.
Canada Manufacturing: Slipped into contraction.
Earnings Highlights:
Exxon & Chevron: Mixed—refining strong, but oil prices hurt results.
Linde: Solid growth from healthcare and clean energy demand.
Nintendo: Strong game and digital sales boosted profits.
AXA: Insurance strong, but investment income dipped.
Regeneron: Beat forecasts, thanks to strong drug sales.
Ares: Private credit demand lifted earnings.
Engie: Renewables helped balance weaker thermal output.
Daimler Truck: Demand steady, but profit margins hit by costs.
LyondellBasell: Missed targets due to weak chemicals demand.
Moderna: COVID sales down; focus now on future drug pipeline.
Takeaway:
The global economy is slowing, but US jobs and spending remain resilient. Companies reported mixed earnings. Central banks are likely to stay cautious, with possible rate cuts ahead if weakness continues.
This communication is for informational purposes only and should not be viewed as any form of recommendation as to a particular course of action or as investment advice. It is not intended as an offer or solicitation for the purchase or sale of any financial instrument or as an official confirmation of any transaction. Opinions, estimates and assumptions expressed herein are made as of the date of this communication and are subject to change without notice. This communication has been prepared based upon information, including market prices, data and other information, believed to be reliable; however, Trade Nation does not warrant its completeness or accuracy. All market prices and market data contained in or attached to this communication are indicative and subject to change without notice.
EU LONGCurrently monitoring EUR/USD for potential long opportunities. I’m looking for signs of bullish momentum supported by structure, liquidity sweeps, and alignment with DXY weakness. Waiting for a clean entry confirmation within a key demand or liquidity zone.

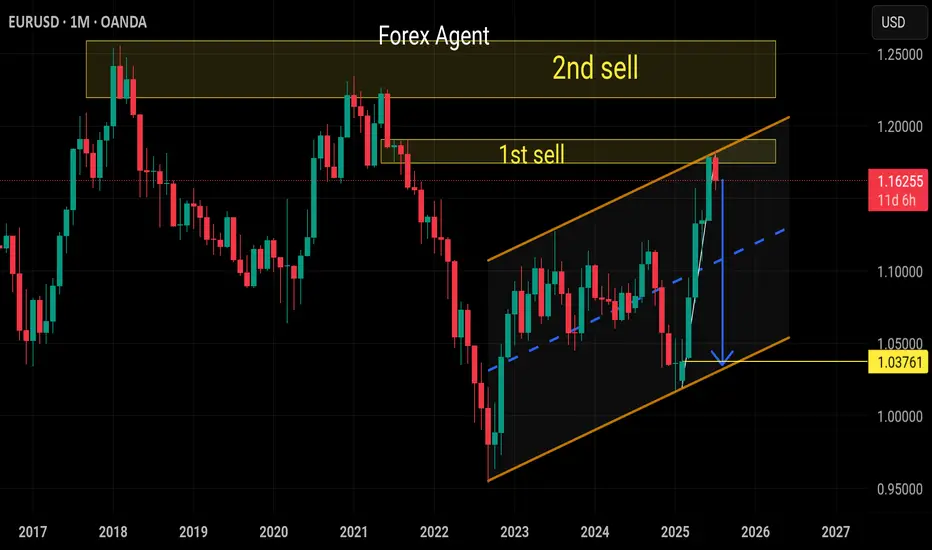
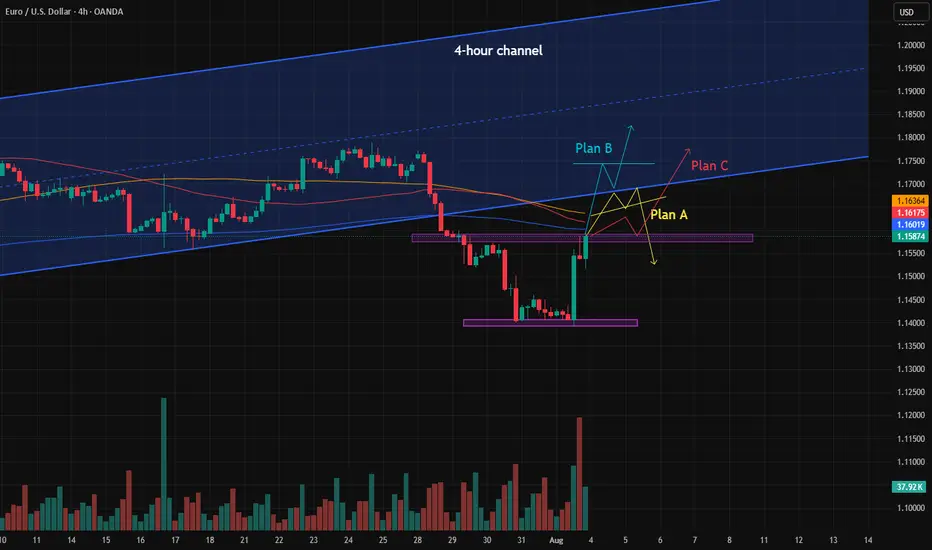
EURUSD 8H – 15% Yearly Channel Move, But Is This the Retest?EURUSD has been riding a clean parallel channel since early 2025, printing a steady +15.88% climb from the lower boundary to the upper resistance.
After mid-year rejection at the top of the range, we’re now testing the midline and eyeing the lower channel boundary. Structure still holds, but the next few candles may confirm if this is just a healthy retest or a bigger breakdown brewing.
Big macro structure. Simple levels. Watching for signs of momentum reclaim or deeper drift.

EURUSD REACHED THE TARGET.EURUSD REACHED THE TARGET.
EURUSD has reached the 1.14500 level and even broke it down. Currently the price consolidates slightly below this level. If the price forms a false breakout of 1.14500 level, this will mean the end of short-term decline in the pair. Stay cautious.
EURUSD Bullish ReversalI am currently in a bullish trade on EURUSD. We are on a weekly support after we have made a far heavy drop, I am expecting this pattern formation to be what triggers a bounce on this support level. I am targeting the most recent level.
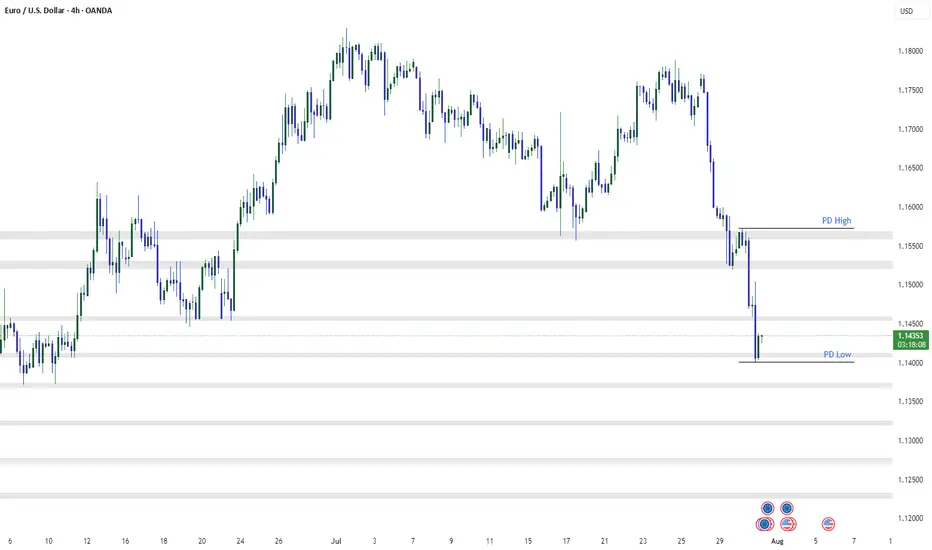
EURUSD 4H AnalysisAfter a strong bearish move, EURUSD has now tapped into the PD Low and shown a reaction. Structure remains bearish, but current price action near 1.1400 could lead to short-term retracement.
🔍 Key Levels:
PD High – 1.1560: Strong supply zone, key bearish continuation level
1.1500–1.1450: Broken support, may now act as resistance
PD Low – 1.1400: Demand zone, current price reacting from here
📌 Potential Scenarios:
Short-Term Bounce from PD Low:
Price reacting from 1.1400 demand.
Intraday retracement toward 1.1470–1.1500 possible.
Watch for bullish price action confirmation on lower timeframes.
Bearish Continuation if price retests 1.1500–1.1550:
Ideal area to look for fresh shorts.
Continuation move could target 1.1350 or lower.
🎯 Bias: Still bearish unless we break and hold above 1.1560 (PD High).
Patience is key. Let price test zone and wait for clear reaction before committing.
EURUSD Wave Analysis – 30 July 2025- EURUSD falling inside accelerated impulse wave c
- Likely fall to support level 1.1200
EURUSD currency pair recently broke the support trendline from February, coinciding with the 38.2% Fibonacci correction of the upward impulse 1 from May.
The breakout of these support levels accelerated the active impulse wave c, which then broke the support at 1.1460.
EURUSD currency pair can be expected to fall further to the next support level 1.1200 (former strong support from May).
