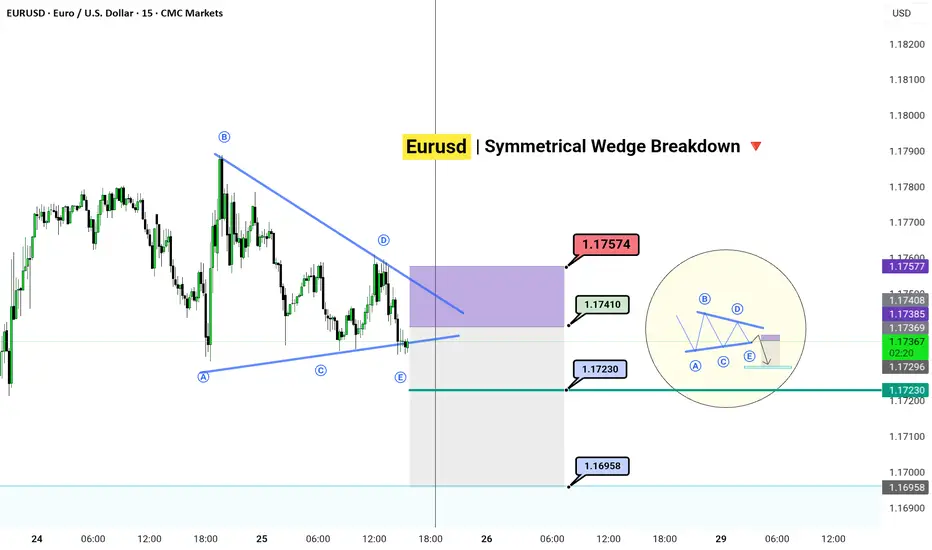
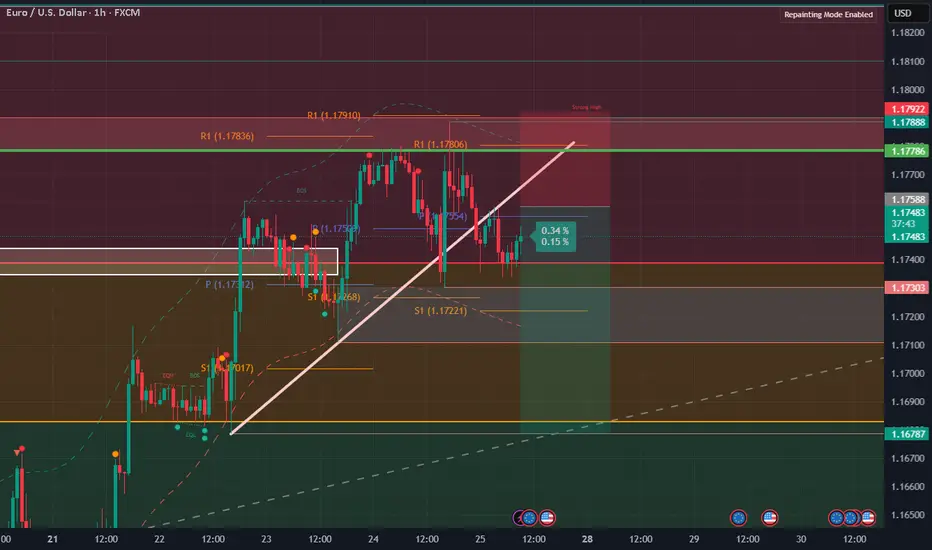
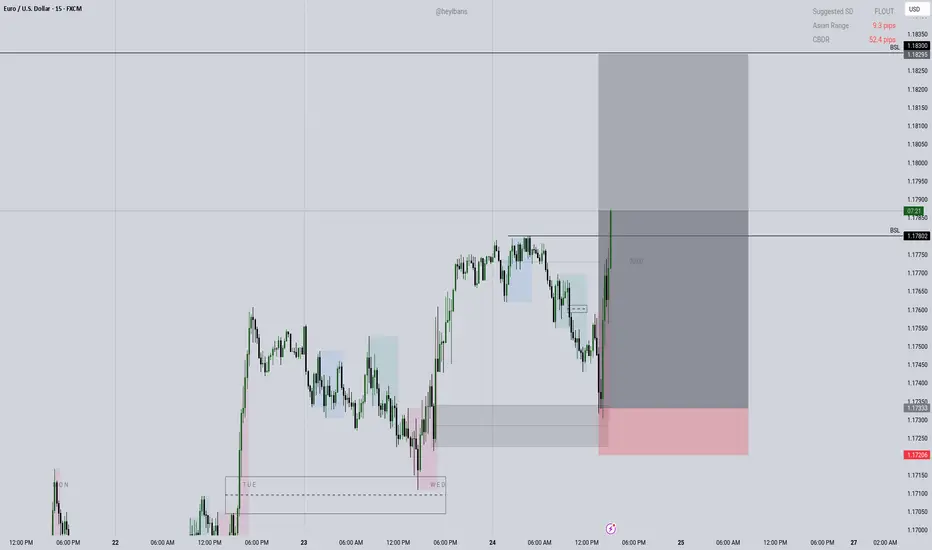
EURUSD | Symmetrical Wedge Breakdown
TF: 15m |
🎯 Setup Insight:
The market doesn’t move in straight lines — it coils.
What you're seeing is an ABCDE corrective wedge, playing out its final phase.
Wave E completed, and liquidity is built right above.
We expect a trap in the purple premium zone (1.1740–1.1757) — then a drop toward 1.1695.
---
🧠 Strategy:
Sell Zone: 1.17410 – 1.17574
Target: 1.16958
Invalidation Above: 1.17600
Wedge ✅
Liquidity ✅
Confluence ✅
Only one move left — the snap.
---
🗝️ Notes:
The market may spike into the OB zone to trap late buyers before the real move unfolds.
The mini-diagram on the right explains it all: "Trap them high, exit them low.✓
USDEUR trade ideas
EURUSD Is Bullish! Long!
Take a look at our analysis for EURUSD.
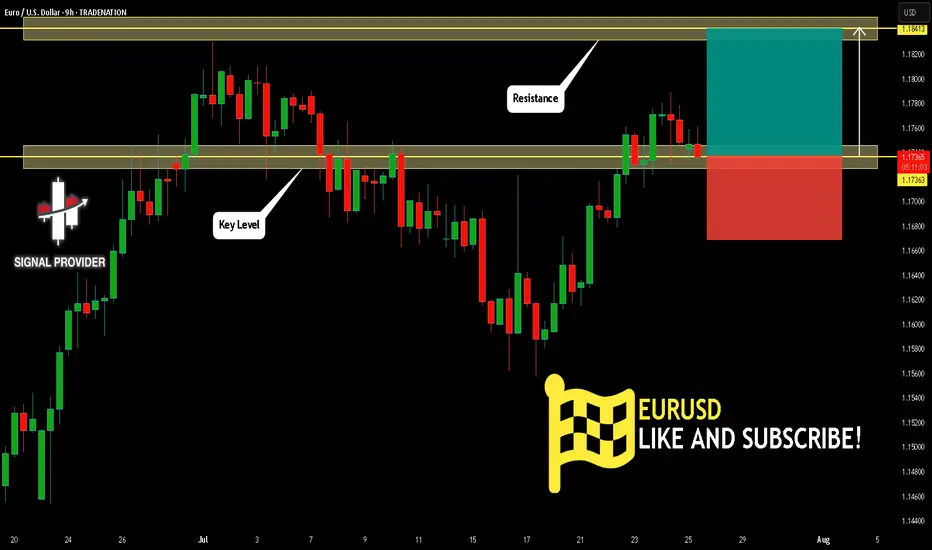
Time Frame: 9h
Current Trend: Bullish
Sentiment: Oversold (based on 7-period RSI)
Forecast: Bullish
The price is testing a key support 1.173.
Current market trend & oversold RSI makes me think that buyers will push the price. I will anticipate a bullish movement at least to 1.184 level.
P.S
Overbought describes a period of time where there has been a significant and consistent upward move in price over a period of time without much pullback.
Disclosure: I am part of Trade Nation's Influencer program and receive a monthly fee for using their TradingView charts in my analysis.
Like and subscribe and comment my ideas if you enjoy them!
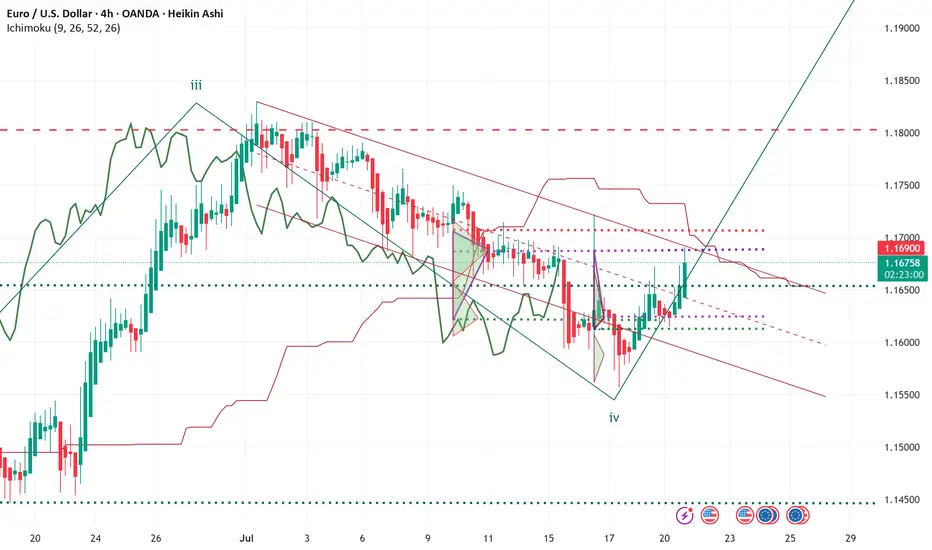
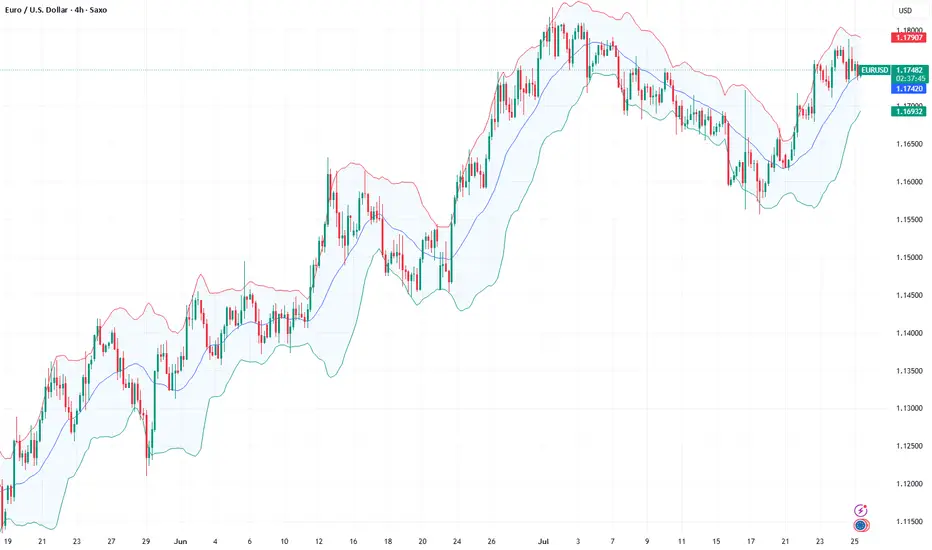
ELLIOTT WAVE EURUSD H4 update
EW Trade Set Up H4
subminuette W4 seems finished
monitor the breakout of the descending channel that appears to contain wave IV
The bullish movement that started on July 17th must assume a 5-wave pattern
key levels (area)
1.1705
1.1684 POC
1.1654
note :
the breakout upwards of the leading span B (red line) by the lagging span (green line) will confirm the start of a bullish movement in the subminuette wave v.
Failure to break above price levels 1.1684 and 1.1705 will result in a recalculation of the waves count
EURUSD HOLDS BULLISH MOMENTUMEURUSD HOLDS BULLISH MOMENTUM📈
24 July I wrote about bearish divergence in EURUSD. Now we see that this resulted into decline towards sma200 on 30-m chart. Currently the price is rebounding from this moving average.
What is the sma200?
The sma200 is a technical indicator that calculates the average closing price of a forex pair or crypto over the past 200 trading periods. It’s used to identify long-term trends, smooth out short-term price fluctuations, and determine potential support or resistance levels.
There is high possibility that the price will continue its way towards local resistance of 1.18300.
Eurusd ShortFX:EURUSD
Yesterday there was a false breakdown of the level after which we saw a return to the range and a breakdown of the trend line, today I expect the removal of Asian hai and a trip for liquidity
Fundamental Market Analysis for July 25, 2025 EURUSDThe euro remains under pressure as the bond yield gap is once again widening in favor of the dollar following comments from Fed Chair Powell about the need to “keep policy tight for longer” to counteract the inflationary effects of new US tariffs. Additional support for the dollar came from the increase in June retail sales and a decline in jobless claims, which confirms the resilience of the US economy and pushes expectations for the first rate cut toward the year-end.
From the European side, euro support is undermined by signs of slowing activity: the GfK consumer confidence index in Germany remains below its historical average, and preliminary July eurozone PMIs, despite some improvement, still indicate an uneven recovery of the real sector. Further pressure comes from ongoing uncertainty around EU–US trade talks; Washington is still discussing the possibility of 15% tariffs, which threatens the bloc’s export prospects and fuels demand for the safe-haven dollar.
With monetary policy divergence and tariff escalation risks persisting, the pair is likely to continue correcting toward 1.17. Investors are awaiting tomorrow’s US PCE data, which could reinforce expectations of the Fed maintaining a “hawkish” stance and cement the downward trend.
Trade recommendation: SELL 1.17350, SL 1.17550, TP 1.16350

EURUSD I Bullish Bounce Off Based on the H4 chart analysis, the price is falling toward our buy entry level at 1.1699, a pullback support that aligns with the 38.2% Fib retracement.
Our take profit is set at 1.1745, a pullback resistance.
The stop loss is placed at 1.1638, below the 61.8% Fib retracement.
High Risk Investment Warning
Trading Forex/CFDs on margin carries a high level of risk and may not be suitable for all investors. Leverage can work against you.
Stratos Markets Limited (tradu.com ):
CFDs are complex instruments and come with a high risk of losing money rapidly due to leverage. 63% of retail investor accounts lose money when trading CFDs with this provider. You should consider whether you understand how CFDs work and whether you can afford to take the high risk of losing your money.
Stratos Europe Ltd (tradu.com ):
CFDs are complex instruments and come with a high risk of losing money rapidly due to leverage. 63% of retail investor accounts lose money when trading CFDs with this provider. You should consider whether you understand how CFDs work and whether you can afford to take the high risk of losing your money.
Stratos Global LLC (tradu.com ):
Losses can exceed deposits.
Please be advised that the information presented on TradingView is provided to Tradu (‘Company’, ‘we’) by a third-party provider (‘TFA Global Pte Ltd’). Please be reminded that you are solely responsible for the trading decisions on your account. There is a very high degree of risk involved in trading. Any information and/or content is intended entirely for research, educational and informational purposes only and does not constitute investment or consultation advice or investment strategy. The information is not tailored to the investment needs of any specific person and therefore does not involve a consideration of any of the investment objectives, financial situation or needs of any viewer that may receive it. Kindly also note that past performance is not a reliable indicator of future results. Actual results may differ materially from those anticipated in forward-looking or past performance statements. We assume no liability as to the accuracy or completeness of any of the information and/or content provided herein and the Company cannot be held responsible for any omission, mistake nor for any loss or damage including without limitation to any loss of profit which may arise from reliance on any information supplied by TFA Global Pte Ltd.
The speaker(s) is neither an employee, agent nor representative of Tradu and is therefore acting independently. The opinions given are their own, constitute general market commentary, and do not constitute the opinion or advice of Tradu or any form of personal or investment advice. Tradu neither endorses nor guarantees offerings of third-party speakers, nor is Tradu responsible for the content, veracity or opinions of third-party speakers, presenters or participants.

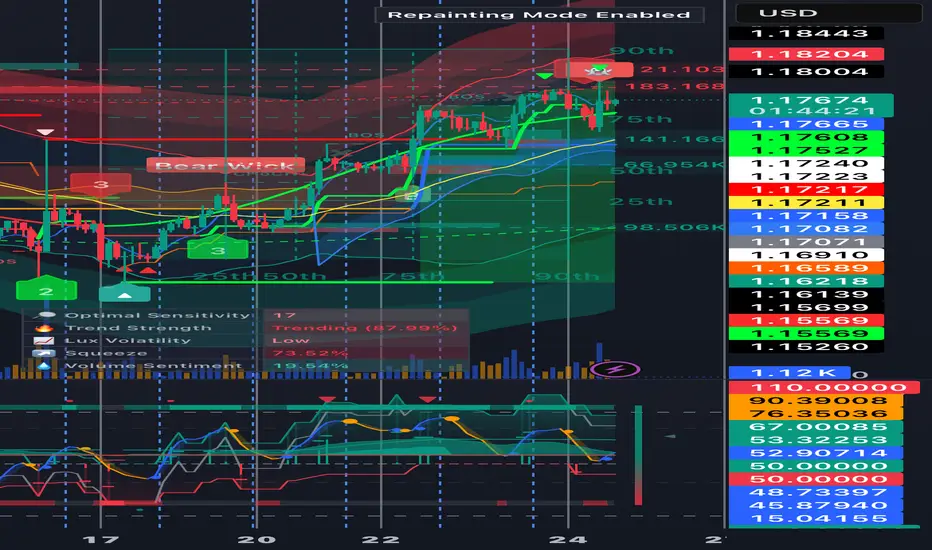
EURUSD Identified a more pronounced risk aversion bias Identified a more pronounced risk aversion bias in the current market after integrating news opinion, social media keyword distribution and institutional trading behavior. Recent economic data has deviated from expectations, raising concerns about global economic growth. Relevant currency pairs gradually lost the initiative in the market, and the price trend showed signs of weak oscillation or downward break.
From the viewpoint of sentiment index, investors generally turned to be cautious, and the attraction of safe-haven assets such as the dollar, yen, Swiss franc, etc. rose. This risk aversion is also confirmed on the flow side of the equation - the system recognizes that some funds have withdrawn from risky currency pairs and flowed to more liquid assets.
Combines these dynamic information to judge that the bearish trend may continue in the short term, and recommends that investors maintain a defensive mindset and lay out their strategies in a predominantly short direction.
Eurusd Tomorrow's forecastThe correction process is expected to continue tomorrow.
The yellow zone, as usual, is the separator.
I wish you success.

EUR/USDThe EUR/USD Is proving to show a weekly bearish reversal, but as you know within the weekly swing are smaller fractals that make the occasional (2H - 4H) hedge impulses. I have entered from the (1H - 2H) chart to the down side with a take profit of 1.01310 knowing that due to USA regulation I will not be able to hedge I will add lot size at the peak of every (4H) pull back
Eurusd long 6k profit live execution EUR/USD stays defensive below 1.1800 ahead of ECB decision
EUR/USD remains in a bullish consolidation mode below 1.1800 in European trading on Thursday. Traders refrain from placing fresh bets ahead of the European Central Bank policy announcements and the US preliminary PMI data. Mixed PMI data from Germany and the Eurozone failed to trigger a noticeable reaction.

EURUSD LIVE TRADE 65PIPS 5K PROFITEUR/USD stays defensive below 1.1800 ahead of ECB decision
EUR/USD remains in a bullish consolidation mode below 1.1800 in European trading on Thursday. Traders refrain from placing fresh bets ahead of the European Central Bank policy announcements and the US preliminary PMI data. Mixed PMI data from Germany and the Eurozone failed to trigger a noticeable reaction.

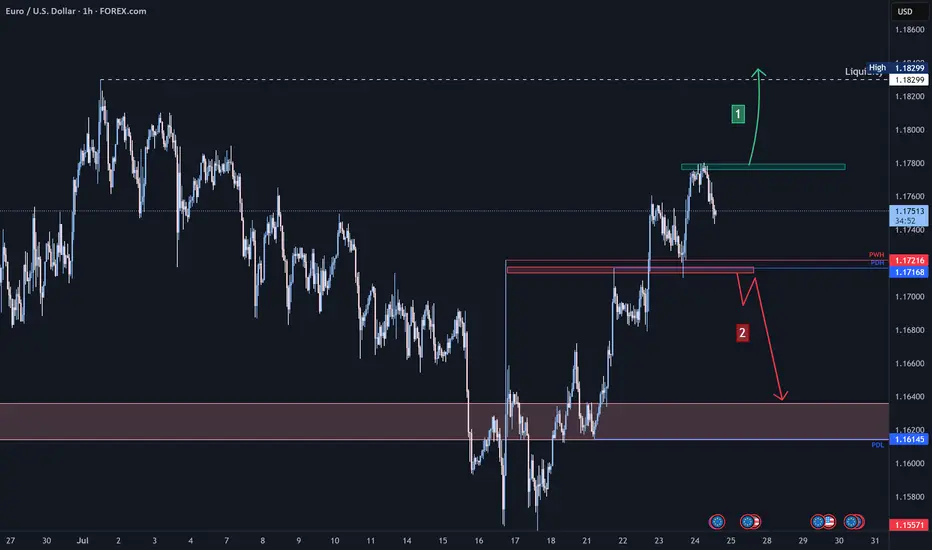
EUR/USD Analysis:🔹 Performance Overview:
The short-term trend is bullish, and price is likely to continue rising toward a key liquidity zone at 1.1829 USD.
1️⃣ Holding above 1.1780 could push the price toward testing the 1.1829 level.
2️⃣ However, a break below the 1.1715 support and stability beneath it may lead to a retest of 1.1680, followed by 1.1640.
⚠️ Disclaimer:
This analysis is not financial advice. It is recommended to monitor the markets and carefully analyze the data before making any investment decisions.
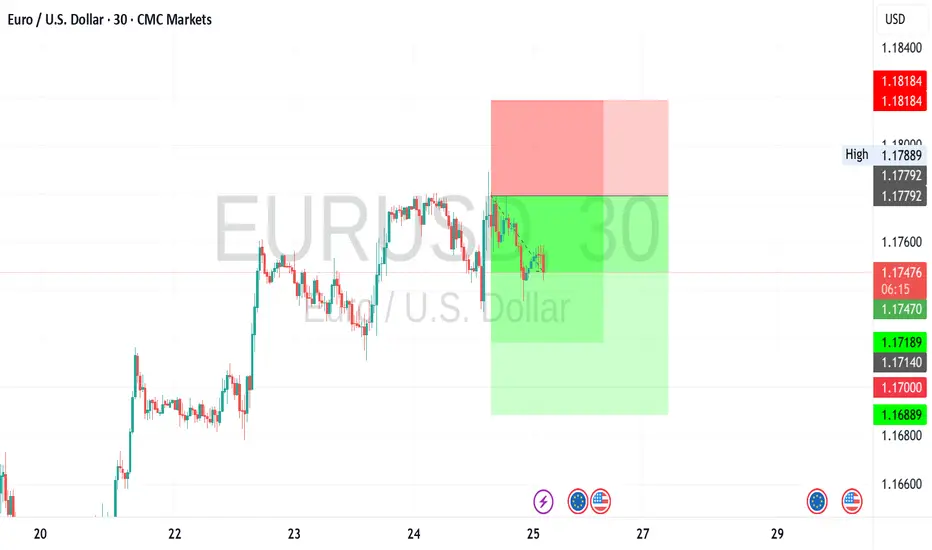
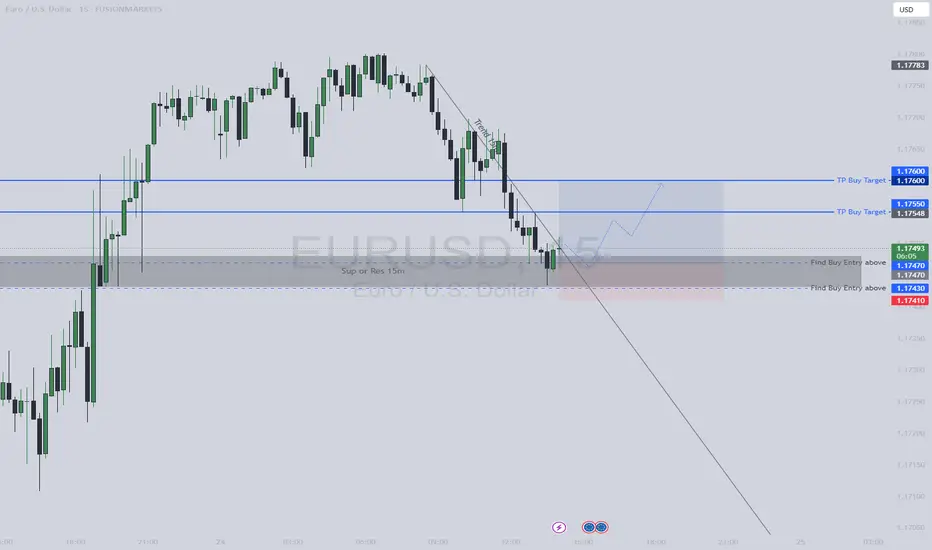
Buy Entry EURUSD🎯 Suggested Trade Setup — Bullish Bias Scalping Opportunity
✅ Buy Entry (Aggressive Intra-Day Play)
📍 Entry Zone: Between 1.17430 and 1.17470 (just above SSL and EQL zones)
🎯 Target: 1.17550 (Day High / minor resistance), with potential extension to 1.17600
🛡️ Stop Loss: Below 1.17410 or the lowest OB (~10-15 pips risk)
🔁 Risk-to-Reward Ratio: Aim for at least 1:2 to 1:3
💡 Why this works: You're buying near liquidity pools with minimal downside. If the breaker block holds and momentum picks up, this could be a swift move.
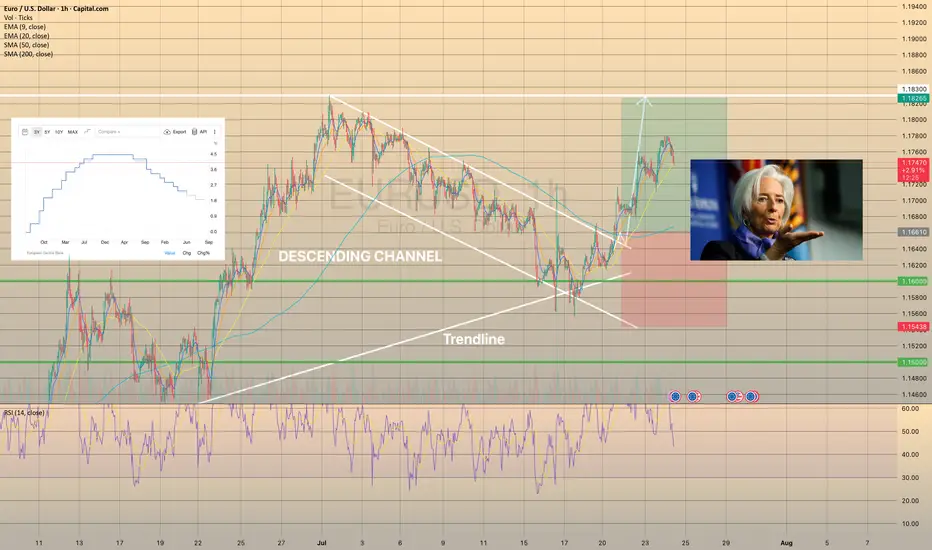
ECB Interest Rate Decision: What to Expect and How Could React📊 ECB Interest Rate Decision: What to Expect and How EURUSD Could React
This week’s spotlight is on the European Central Bank (ECB) Interest Rate Decision — a key market driver that could shape the near-term direction of the euro and broader European markets. Here's what to expect. 👇
🔔 Key Event to Watch
📅 ECB Interest Rate Decision
🕐 Date: July 24
⏰ Time: 12:15 p.m. UTC
📉 Forecast: Hold at 2.15%
📌 Economic Context
The European Central Bank is expected to hold interest rates steady on Thursday, likely marking the end of its current easing cycle after eight consecutive cuts that brought borrowing costs to their lowest levels since November 2022.
🔒 Main refinancing rate: 2.15%
💰 Deposit facility rate: 2.00%
Policymakers are likely to adopt a wait-and-see approach as they monitor the impact of persistent trade uncertaintyand potential U.S. tariffs on economic growth and inflation.
Adding to the cautious stance, inflation finally reached the ECB’s 2% target in June, and is now forecast to dip belowthat level later this year. This drop is expected to be sustained over the next 18 months, driven by:
A strong euro 💶
Falling energy prices 🛢️
Cheaper imports from China 🇨🇳
Markets are currently pricing in just one more rate cut by December, with around a 50% probability of that happening in September, before a possible tightening cycle resumes in late 2026.
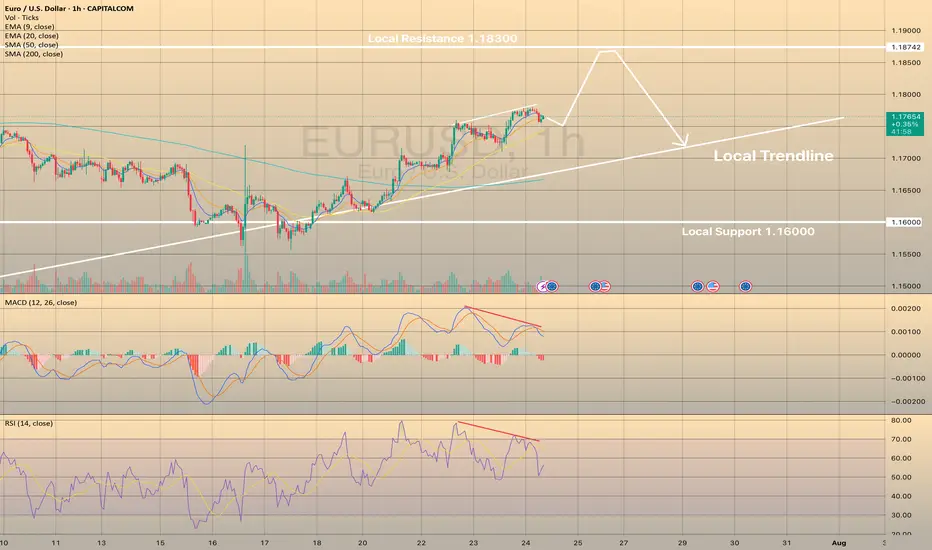
📈 EURUSD Technical Outlook
EURUSD has been trading within a descending channel since early July. However, it recently rebounded from trendline support, backed by bullish RSI divergence. The pair is approaching a breakout above the 1-hour SMA200, signaling a potential continuation of the uptrend. 🔼
A minor pullback is possible before a stronger move
Bullish momentum may continue if resistance is cleared
🎯 Target range: 1.18250 – 1.18300
🧩 Summary
The ECB is likely to keep rates unchanged at 2.15%, adopting a cautious tone amid easing inflation and global trade risks. This outcome could support the euro, particularly if U.S. rate expectations soften.
With technical indicators aligning with fundamental stability, EURUSD may be setting up for a bullish continuationin the coming sessions. 📊💶
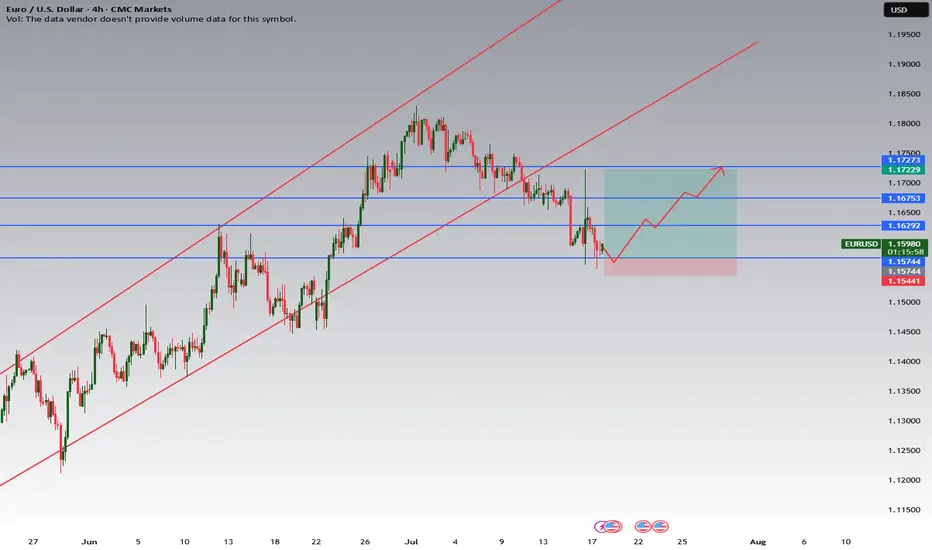
EURUSD – Watch for Bullish Reaction Near 1.15744Description:
EURUSD is approaching a major support zone at 1.15744, as shown on the 4H chart. This level lines up with prior structure and could act as a springboard for a bullish move if buyers step in.
Trade Plan:
Do NOT enter immediately at 1.15744.
Wait for clear bullish confirmation at or just above 1.15744 (examples: bullish engulfing, strong pin bar, multiple rejections, or your trusted indicator).
If confirmation is seen, consider a long trade targeting the next resistance levels at 1.16292, 1.16753, and 1.17229.
Place your stop-loss slightly below the swing low (around 1.15441 or according to your risk).
Why Wait for Confirmation?
1.15744 is an area to monitor, not a trigger!
Price may slice through the level or fake out before reversing—waiting for confirmation increases your edge and reduces risk.
Levels to Watch:
Support (monitor for entry): 1.15744
Stop Loss: Below 1.15441
Targets: 1.16292, 1.16753, 1.17229
Extra Tips:
Ignore the entry level if price shows no bullish reaction or momentum.
Watch for news/events that could create volatility and invalidate this setup.
Summary:
Wait for the market to show its hand at 1.15744. Only enter on solid bullish evidence!
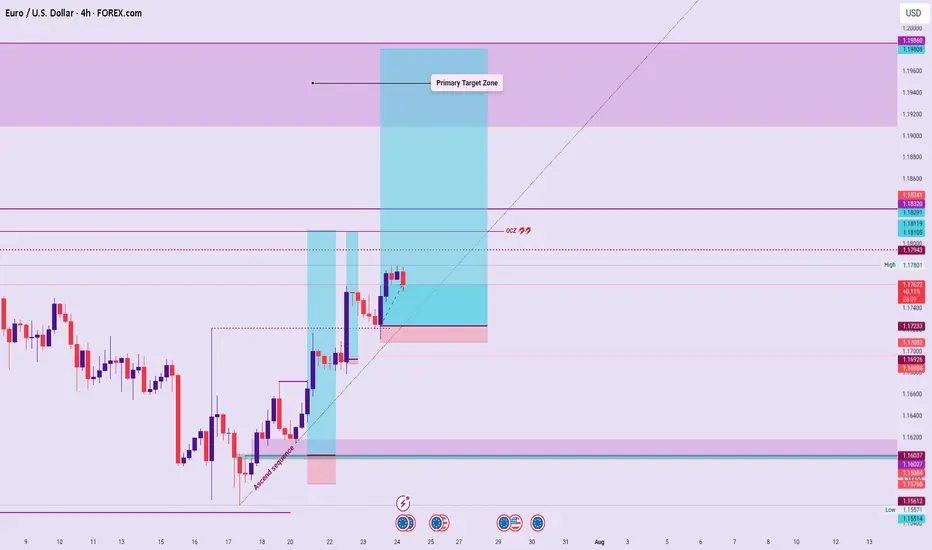
EURUSD – Trade Continuation Outlook: Technical BiasSequence Expectation:
If the current Ascend Sequence structure holds, I anticipate price extending toward or above the target zone, aligned with the directional flow.
Liquidity Magnet:
The OCZ remains a strong attraction point for buy-side flows, given its repeated gravitational pull on price.
Invalidation Criteria:
A structural breach of the Sequence Line would invalidate the bullish outlook, exposing price to the mid-range of the Ascend Sequence or potentially deeper pullbacks below.
Caution Note:
Upcoming U.S. data releases may inject volatility, likely acting as a directional driver.
Wait for clear confirmations before engaging. Trade setups must align with structure and show decisive intent.
Summary Tactical Lean:
Bullish bias stands as long as the Sequence remains intact. OCZ remains in sight. Trade cautiously, adapt to new data flow, and validate every trigger.
🔒 Disclaimer:
This content is for educational and strategic insights only. It is not financial advice. Always confirm with your personal trading plan and manage risk appropriately.
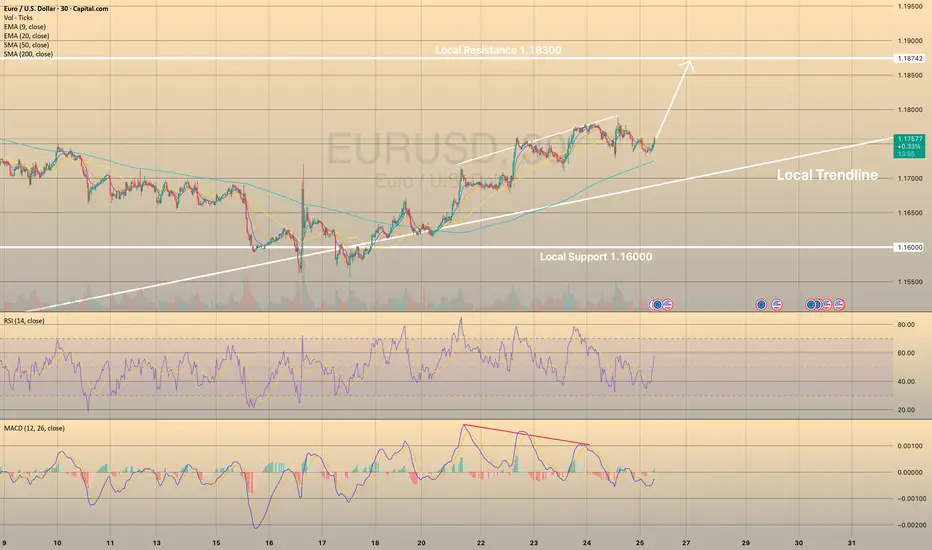
EURUSD IS ON ITS WAY TO LOCAL HIGHSEURUSD IS ON ITS WAY TO LOCAL HIGHS
EURUSD successfully rebounded from local support of 1.16000 and since then continues to rise towards local resistance of 1.18300. Recently the price has started to show the bearish divergence on RSI and Macd indicators. MACD went into the red zone.
What is the bearish divergence?
Bearish divergence is a technical analysis pattern where the price makes higher highs in an uptrend, but a momentum indicator (e.g., RSI, MACD) forms lower highs, signaling weakening bullish momentum and a potential downward reversal. To trade, identify the divergence in a clear uptrend with the indicator showing lower highs (e.g., RSI above 70). Sell or short when the price confirms a reversal (e.g., breaks below a support level or trendline) with increased volume. Set a stop-loss above the recent high. Target the next support level.
Generally speaking, it doesn't necessarily mean that EURUSD will drop immediately, the price may even grow a bit. However, it highlights some short opportunities.
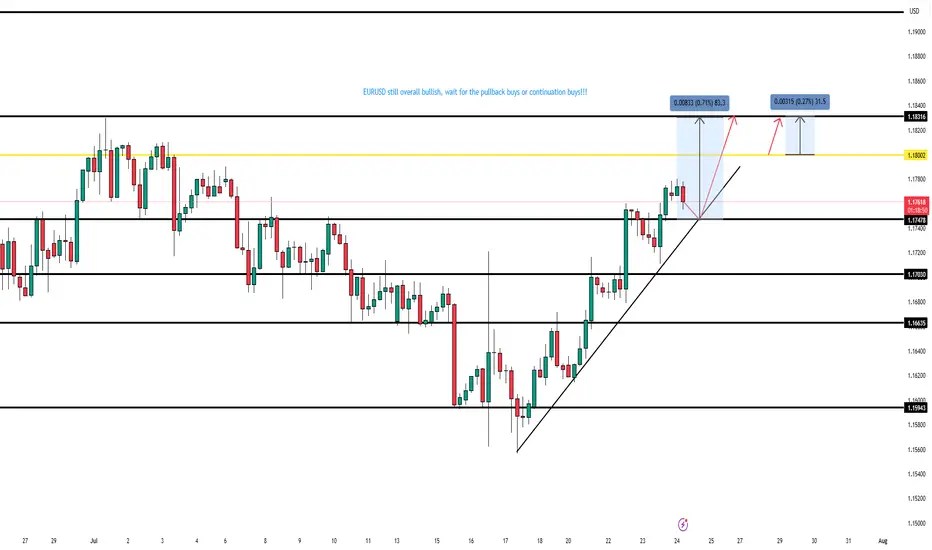
$EURUSD – Thursday, July 24th OutlookYesterday: Retest of 1.17478 gave +20 pips.
Today: Watching for another retest entry.
Targets:
• TP1: 1.18002 (+80 pips)
• TP2: 1.18316 (+30 pips)
Bias remains bullish; entries focused on clean retests.
EURUSD LONG AND EDUCATIONAL BREAKDOWN ECB INTRESTRATE RELEASE The European Central Bank is expected to hold key rates for the first time in over a year on Thursday.
The Eurozone inflation rate has hit the ECB’s 2% target as the US-EU trade deal uncertainty lingers.
The EUR/USD pair could experience intense volatility following the ECB policy announcements.
The European Central Bank (ECB) is on track to leave its key interest rates unchanged after its July policy meeting, after having reduced rates at each of its last seven meetings. The decision will be announced on Thursday at 12:15 GMT.
The interest rate decision will be followed by ECB President Christine Lagarde’s press conference at 12:45 GMT.

EUR/USD 4-Hour Candlestick Chart (OANDA)4-hour candlestick pattern for the Euro/US Dollar (EUR/USD) currency pair on the OANDA platform, covering the period from mid-July to mid-August 2025. The current price is 1.17358, reflecting a 0.16% decrease (-0.00186). Key levels include a sell signal at 1.17350 and a buy signal at 1.17366, with a highlighted resistance zone around 1.18102 and support near 1.16957. The chart includes technical indicators and price movements over the specified timeframe.
