EURUSD: Bulls Will Push
Balance of buyers and sellers on the EURUSD pair, that is best felt when all the timeframes are analyzed properly is shifting in favor of the buyers, therefore is it only natural that we go long on the pair.
Disclosure: I am part of Trade Nation's Influencer program and receive a monthly fee for using their TradingView charts in my analysis.
❤️ Please, support our work with like & comment! ❤️
USDEUR trade ideas
EURUSDHello Traders! 👋
What are your thoughts on EURUSD?
EURUSD has broken support level and its ascending trendline, indicating a possible shift in short-term market structure and growing bearish pressure.
In the short term, we expect a pullback toward the broken support/trendline zone.
If price fails to reclaim this level, a continued move lower toward the next identified support zone is likely.
As long as price remains below the broken structure, the short-term outlook stays bearish.
Don’t forget to like and share your thoughts in the comments! ❤️
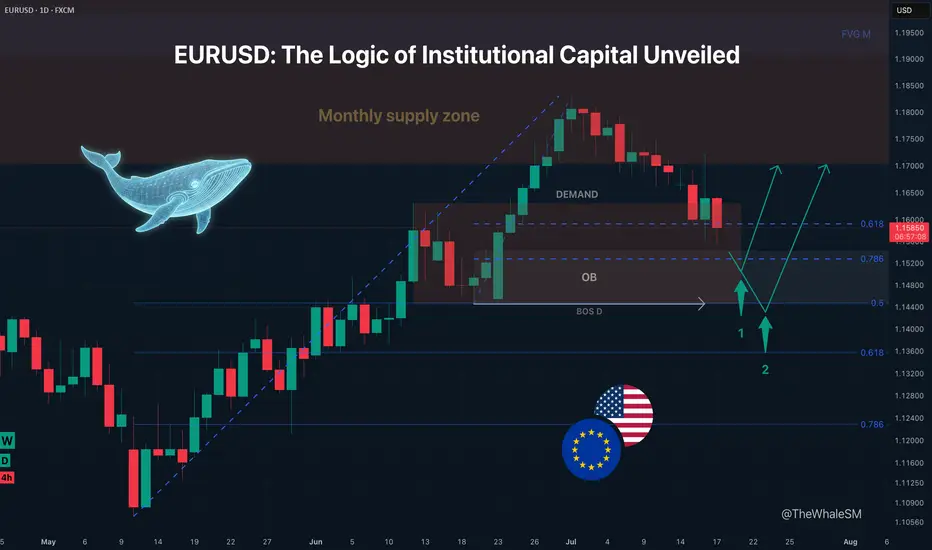
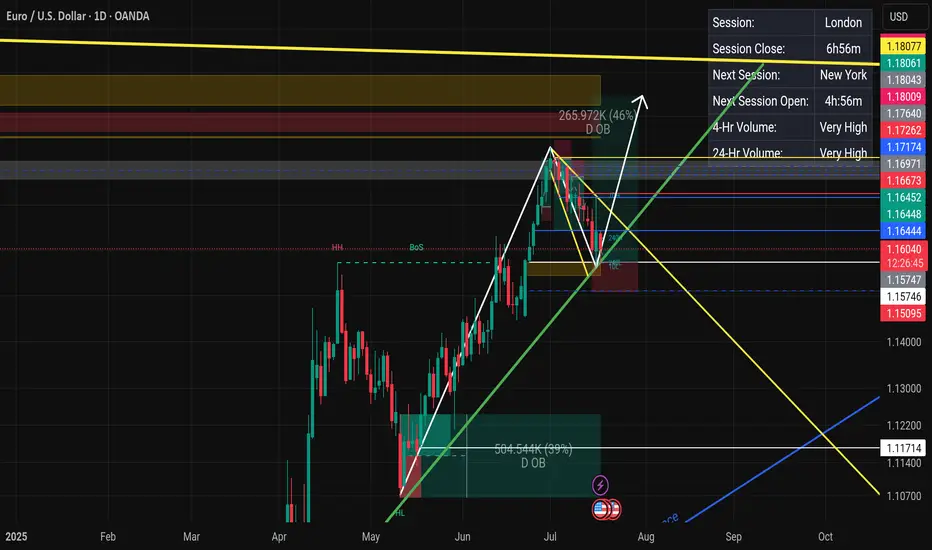
EURUSD: The Logic of Institutional Capital UnveiledThe trend is your friend... until it isn't. While EURUSD remains in a clear global uptrend, the short-term picture is far more deceptive. Before you jump into a long position, it's crucial to understand the bearish order flow that has taken control on the 4H chart.
This idea isn't about fighting the trend, but about having the patience to join it at the right, high-probability moment. Let's dive in.
The most liquid forex asset, EURUSD , continues its global uptrend as long as the price does not close decisively below the daily structure's BOS level at 1.14458. On its ascent, the pair met resistance from a monthly supply zone , from which it began a daily structure correction. This correction was paused by a demand zone and the 61.8% Fib level.
While this might seem like a sufficient support point to consider long positions, let's look at the context on the 4H structure to see why I believe the correction will go deeper.
The 4H structure shows a clear bearish order flow that began from the aforementioned monthly supply zone. We see this order flow manifest as the price consecutively rejects from order blocks #1 and #2 ( they have fulfilled their role and should no longer be considered — any manipulation zone becomes deactivated after its first mitigation ). It would have seemed logical for the price to then reject from OB #3 , where I was personally expecting a counter-trend short trade upon its mitigation, especially after the 4H structure had broken down (BOS 4H).
However, the price doesn't always behave as we expect ; it dropped to the demand zone, leaving behind a 4H FVG. This left OB #3 still technically valid. But the sharp squeeze on July 16th reached the 4H FVG, rebalancing it and thus invalidating OB #3 as a Point of Interest (POI) for large capital. This is because the price was already delivered close to it, and with a high probability, the "Whale" closed its losing hedged long positions there, having no reason to return the price. The sharp upward squeeze on July 16th also served to sweep liquidity from the high marked with an 'x'.
These two factors — the FVG mitigation and the liquidity sweep — confirmed the continuation of the bearish order flow and indicated that the price is likely to continue its corrective move towards the next support levels. Let's examine them in more detail.
~~~~~~~~~~~~~~~~~~~~~~~~~~~~~~~~~~~~~~~~~~~~~~~~~~~~~~~~~~~~~~~~~
Two Potential Long Scenarios
SCENARIO 1: Entry from the Daily Order Block
The first level for a potential reversal is the 78.6% Fibonacci retracement level from the daily structure, in conjunction with a daily order block .
► Setup Condition: Price must reach this level, mitigate the order block, and hold above the 78.6% Fib level. An entry will require LTF confirmation (a BOS or the beginning of LTF order flow).
► Invalidation: A break of the 78.6% level with the price closing below it.
Note: I consider the scenario of breaking this level quite probable due to the weakness of this daily order block — it did not sweep any liquidity when it was formed. Thus, it may itself act as liquidity, activating the second long scenario.
SCENARIO 2: Entry after a Deeper Liquidity Sweep
This scenario becomes valid if the first one fails.
► Setup Condition: A liquidity sweep below the daily structure's break level (BOS D) , which simultaneously corresponds to reaching the 50% Fib level from the weekly structure . This confluence strongly reinforces the setup if this level (at 1.14480) holds. Since this is a weekly level, it must not be broken by the bodies of daily candles closing below it.
► Invalidation: A daily candle close below this level. In that case, we can confidently assume that the uptrend is changing and start looking for short positions.
~~~~~~~~~~~~~~~~~~~~~~~~~~~~~~~~~~~~~~~~~~~~~~~~~~~~~~~~~~~~~~~~~
The principles and conditions for forming the manipulation zones I show in this trade idea are detailed in my educational publication, which was chosen by TradingView for the "Editor's Picks" category and received a huge amount of positive feedback from this wonderful, advanced TV community. To better understand the logic I've used here and the general principles of price movement in most markets from the perspective of institutional capital, I highly recommend checking out this guide if you haven't already. 👇
P.S. This is not a prediction of the exact price direction. It is a description of high-probability setups that become valid only if specific conditions are met when the price reaches the marked POI. If the conditions are not met, the setups are invalid. No setup has a 100% success rate, so if you decide to use this trade idea, always use a stop-loss and proper risk management. Trade smart.
~~~~~~~~~~~~~~~~~~~~~~~~~~~~~~~~~~~~~~~~~~~~~~~~~~~~~~~~~~~~~~~~~
If you found this analysis helpful, support it with a Boost! 🚀
Have a question or your own view on this idea? Share it in the comments. 💬
► Follow me on TradingView to get real-time updates on THIS idea (entry, targets & live trade management) and not to miss my next detailed breakdown.
~~~~~~~~~~~~~~~~~~~~~~~~~~~~~~~~~~~~~~~~~~~~~~~~~~~~~~~~~~~~~~~~~
EURUSD under pressure despite Powell being on his way outEURUSD remains under pressure as US jobless claims improve and Powell appears to be on his way out. Still, the impact has been limited, and the broader trend remains upward. With growing speculation around Powell’s replacement, the market may look to form a bottom.
This content is not directed to residents of the EU or UK. Any opinions, news, research, analyses, prices or other information contained on this website is provided as general market commentary and does not constitute investment advice. ThinkMarkets will not accept liability for any loss or damage including, without limitation, to any loss of profit which may arise directly or indirectly from use of or reliance on such information.

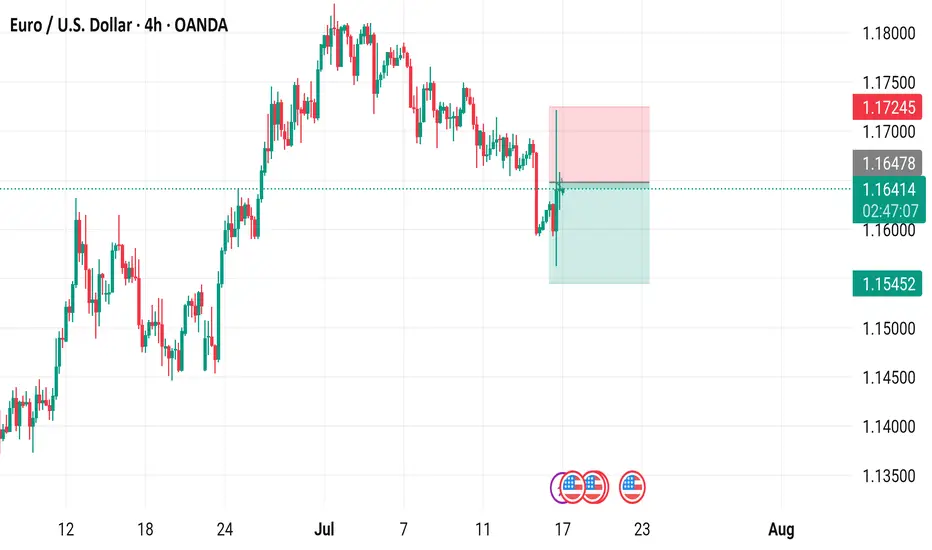
EUR/USD 4-Hour Chart - OANDA4-hour performance of the Euro/US Dollar (EUR/USD) currency pair on the OANDA platform as of July 17, 2025. The current exchange rate is 1.16408, showing a slight decline of 0.01%. Key levels include a buy signal at 1.16417 and a sell signal at 1.16399, with recent price action ranging between 1.1452 and 1.17245. The chart includes candlestick patterns and shaded areas indicating potential resistance and support zones.
EURUSD: Support & Resistance Analysis 🇪🇺🇺🇸
Here is my fresh support & resistance analysis for EURUSD.
Vertical Structures
Vertical Support 1: Rising trend line
Vertical Support 2: Falling trend line
Vertical Resistance 1: Falling trend line
Horizontal Structures
Support 1: 1.1577 - 1.1600 area
Support 2: 1.1445 - 1.1458 area
Support 3: 1.1356 - 1.1373 area
Support 4: 1.1190 - 1.1280 area
Resistance 1: 1.1682 - 1.1766 area
Resistance 2: 1.1807 - 1.1830 area
Consider these structures for pullback/breakout trading.
❤️Please, support my work with like, thank you!❤️
I am part of Trade Nation's Influencer program and receive a monthly fee for using their TradingView charts in my analysis.

EUR/USD) bearish chochy Trend Read The captionSMC trading point update
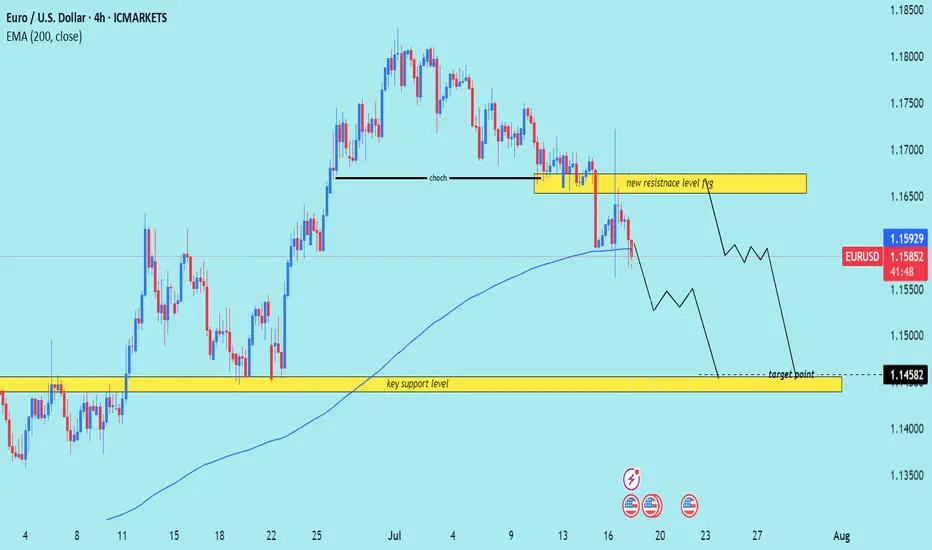
Technical analysis of EUR/USD (Euro vs. U.S. Dollar) on the 4-hour timeframe. Here’s the breakdown
---
Technical Breakdown:
1. Market Structure Shift (CHOCH):
The chart highlights a Change of Character (CHOCH), signaling a bearish reversal after a previous uptrend.
This is confirmed by lower highs and lower lows forming after the CHOCH point.
2. New Resistance Zone:
The previous support (yellow box) has now turned into a new resistance level around 1.16400–1.16700.
Price has rejected this area after the breakdown, validating the resistance flip.
3. 200 EMA Breakdown:
Price is now trading below the 200 EMA (1.15928), which reinforces bearish sentiment.
The EMA may act as dynamic resistance on any pullbacks.
4. Target Zone:
The projected target is the key support zone around 1.14582, where price consolidated before the last major bullish move.
This level has historical significance and aligns with a clean support demand zone.
5. RSI Indicator:
RSI is not yet oversold, sitting in a neutral-to-bearish range, indicating further downside potential.
Mr SMC Trading point
---
Trade Idea Summary:
Bias: Bearish
Entry Zone: On breakdown and rejection from the new resistance area (~1.16400–1.16700)
Target Zone: 1.14582 (key support)
Invalidation: A break and close above the resistance zone
Confluence: CHOCH confirmation + support-turned-resistance + 200 EMA breakdown
---
Please support boost 🚀 this analysis)
EUR/USD Bearish Outlook: Short-Term Opportunity Ahead!Hello Fellow Traders! 👋
In my last post on Monday, I pointed out a key zone where EUR/USD showed bullish momentum, hitting nearly 60% of our target! 🎯 I booked profits yesterday, and now the market is giving us fresh clues. Let’s dive into the latest setup! 🚀
Market Update
Over the past two days, the price has swept both buyers and sellers, clearing the way for a new move. The 4H trendline has been broken, signaling bearish momentum. As we head into the NY session, I’m watching for further confluence to confirm this move. 📊
Trade Idea
Direction: Bearish 📉
Target: 1.14500 ( Long-Term First Target)
Strategy: I’m focusing on short-term entries with confluence from lower timeframes (e.g., 1H or 15M). Long-term positions? Not yet—let’s stay nimble!
Why This Setup?
Trendline Break: Clear bearish signal on the 4H chart.
Confluence: Awaiting confirmation from lower timeframes for precise entries.
Risk Management: Short-term focus to capitalize on the move without overexposure.
What do you think of this setup? Drop a comment below with your thoughts! 💬 If you found this idea helpful, smash that Like button 👍 and Follow for more updates. Let’s keep the trading community thriving! 🚀
Happy Trading! 💰
#EURUSD #Forex #TradingView #TechnicalAnalysis
LONG for EURUSD?LONG EURUSD
What is going on with EURUSD
We see how beautiful the market went up from the beginning of the trend line constatly with pullbacks that means a steady uptrend not really the urge that the market want to go back.
We used the fib as always to indicate 61.8% perfect pullback on that and as we see on the resistance that has to be tested.
There will be a fake break out of 100-150 pips.
If we go back on the RSI we see divergence momentum is back to average.
We call this hidden divergence price goes up and indicator goes down.
What indicates us that we also have new space for a higher high.
Targets we have in mind 1.19035 with high momentum what I expect it will hit the 1.20274 , important to have in mind 1.20000 is a key level price wants to go there as a magnet.
Reverse of the analyses:
If it breaks the 61.8% it will retest the market structure and goes to the 1.13544 with high momentum just to test price and set us offside because that is what the market want hit as many stop losses because that’s where the liquidity is build up, takes out and will continue the uptrend.
Follow my journey I try to post daily.
Markets I analyse XAUUSD, EURUSD, USDMXN, XTIUSD, XRPUSD, BTCUSD.
Will start more forex and Crypto soon.
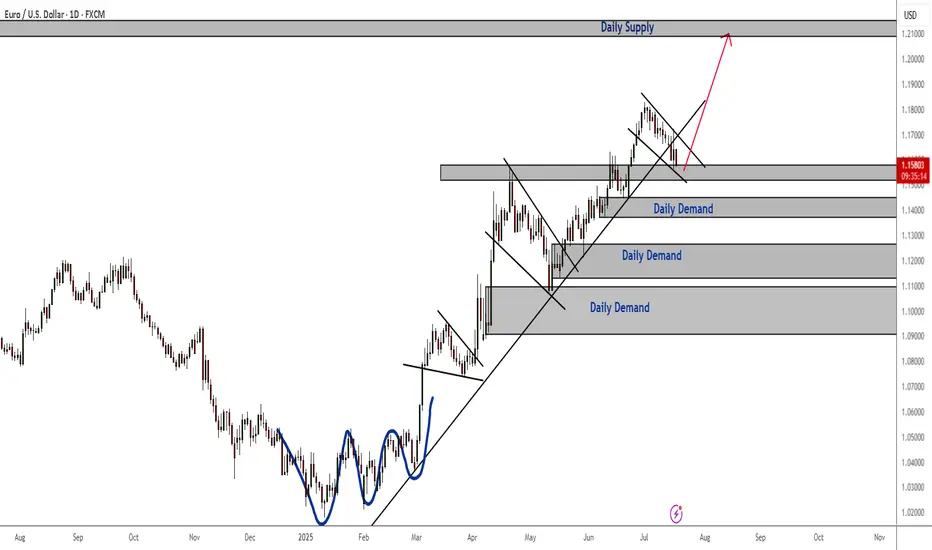
EURUSD Bullish Continuation Patterns and Consistent Demand The bullish continuation patterns and the consistent daily demand zones indicate that the trend is still bullish despite last week's bearish correction.
Price is currently reacting to a daily support zone. To confirm going long, especially long term, I recommend waiting for the current falling wedge to breakout and retest and then ride the bullish momentum to daily and weekly supply zones.
Euro Slips, Brussels Stalls RetaliationEUR/USD is pulling back toward 1.1620 in Thursday’s Asian session as markets await Eurozone HICP data, with eyes on US June retail sales later in the day. The dollar stays firm on expectations that the Fed will hold rates at 4.25%-4.50% in July amid tariff-driven uncertainty.
President Trump announced plans to notify over 150 countries of a 10% tariff, possibly rising to 15-20%, targeting those with minimal U.S. trade ties. He criticized Fed Chair Powell but admitted removing him might destabilize markets, while floating possible trade deals with Europe and India.
Strong June CPI has reignited concerns about prolonged high rates. Dallas Fed’s Lorie Logan and New York Fed’s John Williams both warned that tariffs may keep inflation elevated, reinforcing the case for keeping rates steady.
Resistance for the pair is at 1.1670, while support is at 1.1580.
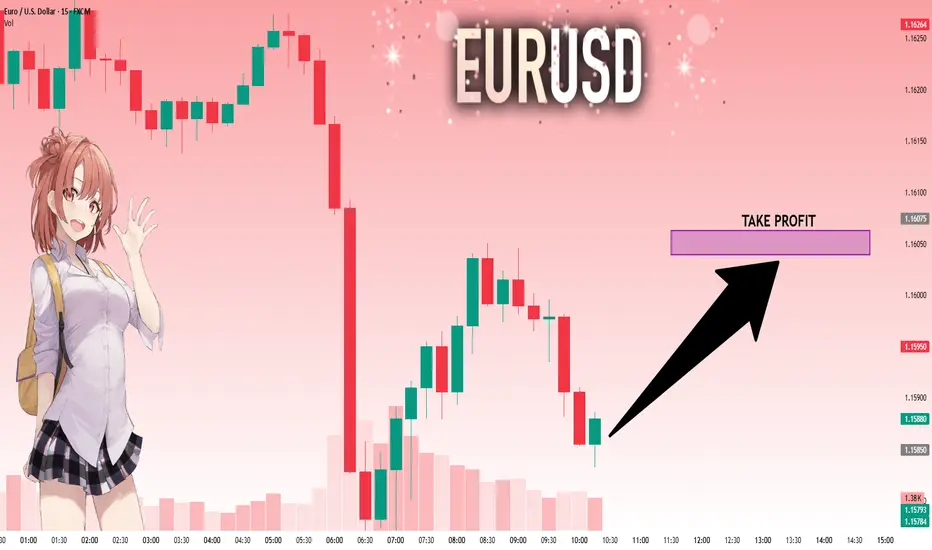
Trade Setup: EUR/USD 15min | OB Mitigation Play⚙️ Type: Countertrend (Risk-managed Buy)
Direction: Long
Entry Zone: 1.15850–1.15886 (Refined OB)
Entry Type: Buy Limit
Stop Loss: Below the OB low → 1.15790
Take Profit Targets:
TP1: 1.16043 (minor imbalance fill)
TP2: 1.16140 (supply zone re-test / 50% fib)
Risk to Reward: ~1:3 minimum (depending on fill and management)
🎯 Why This Setup Works
Price swept sell-side liquidity into a refined OB from the CPI move.
Confluence with 0.786 retracement, suggesting algo entry interest.
Strong momentum imbalance above gives room for retracement pullback.
DXY showing signs of short-term exhaustion at intraday highs.
🔒 Invalidation Criteria
15m candle close below 1.15790
Clean break and hold of OB low → Flip bias bearish

EURUSD: Target Is Up! Long!
My dear friends,
Today we will analyse EURUSD together☺️
The recent price action suggests a shift in mid-term momentum. A break above the current local range around 1.15850 will confirm the new direction upwards with the target being the next key level of 1.16039 and a reconvened placement of a stop-loss beyond the range.
❤️Sending you lots of Love and Hugs❤️
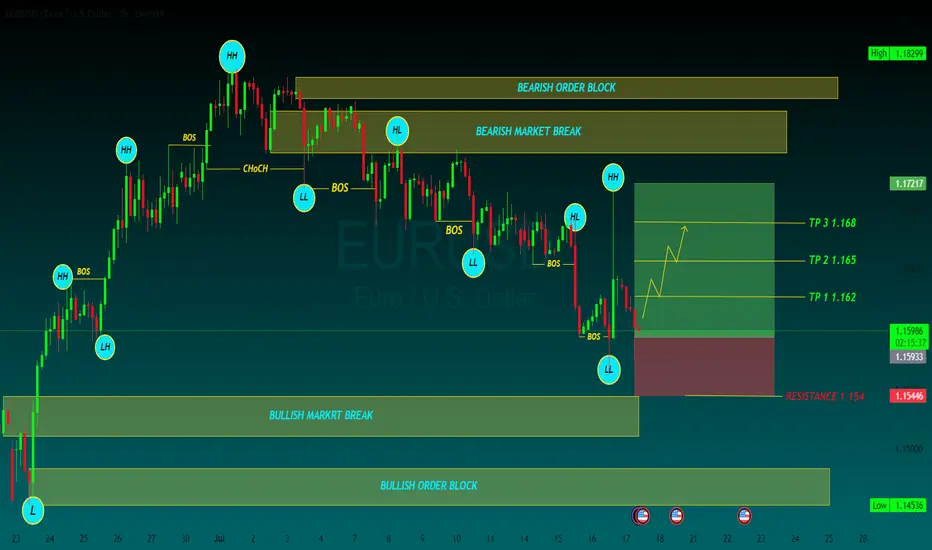
EURUSD BUYThe EUR/USD pair edged lower in the past week, settling a handful of pips below the 1.1700 mark, further retreating from the multi-year peak posted early in July at 1.1830. Financial markets kept revolving around the United States (US) President Donald Trump's targets. With geopolitical woes cooling down, Trump’s focus returned to tariffs, and the Federal Reserve’s (Fed) wait-and-see stance on monetary policy.
Trump fixated on tariffs and Powell
Since the week started, speculative interest kept their eyes on the July 9 tariffs deadline. Trump announced massive retaliatory levies on over 180 trading partners in May, quickly establishing a 90-day grace period afterwards. His goal was to clinch better trade deals with all these nations. But as the date loomed, deals were scarce. The US made some trade arrangements with some minor economies, such as Vietnam, but there were none with major counterparts, nor, of course, with China
TP 1 1.162
TP 2 1.165
TP 3 1.168
RESISTANCE 1.154
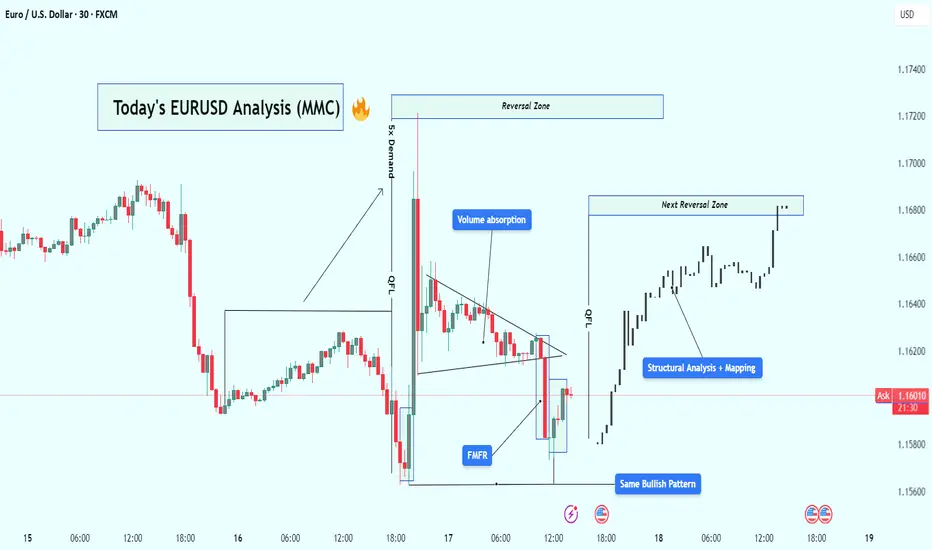
EUR/USD Analysis : Bullish Reversal – Volume Absorption & Target🧠 Market Overview:
EUR/USD has followed a flawless Market Maker Cycle, moving from manipulation to expansion. The chart shows institutional behavior through liquidity grabs, volume absorption, and structural breaks, confirming that big players are in full control.
The current price action signals bullish strength targeting the next high-probability reversal zone, but let’s break this down from the very beginning.
🔍 Key Chart Phases and Insights:
1️⃣ Massive Bearish Impulse – Liquidity Sweep Phase
At first glance, the chart shows an aggressive drop — a strong bearish leg that looks like market weakness.
❗ But in reality, this is the liquidity sweep phase. Here’s what likely happened:
Price ran below key lows
Hit stop losses of early buyers
Created “fake” bearish sentiment
Built sell-side liquidity for institutions to buy from
🔑 This isn’t weakness — it’s a setup.
2️⃣ FMFR (Final Move for Reversal) + Instant Reaction
At the end of that drop, the market printed a sharp bullish engulfing candle from the lows — this is known as the Final Move for Reversal (FMFR).
This marks:
The end of the accumulation phase
Entry of smart money into the market
The beginning of a new bullish cycle
The size and speed of this move indicate high-volume orders were filled — classic sign of institutional presence.
3️⃣ 5x Demand Push – Start of Expansion Phase
After the FMFR, price explodes upward with 5 consecutive bullish candles. This is your expansion phase — the market is moving fast, breaking structure, and flipping direction.
Key takeaways from this leg:
Strong displacement confirms a new trend
High momentum candles reflect institutional interest
Price breaks above previous structure levels
📈 This is no longer random — it’s planned and executed by bigger players.
4️⃣ Volume Absorption in Tight Wedge – Smart Money Re-Accumulation
After the breakout, price doesn’t just continue flying — instead, it compresses in a tight triangle. This is a key phase called volume absorption or re-accumulation.
What’s happening here:
Institutions are absorbing retail orders
Low volume = no resistance = easier breakout
Price is “charging” before the next move
🔋 Think of this like coiling a spring — it’s getting ready to pop again.
5️⃣ Bullish Pattern Repeats – MMC Confirmed
Interestingly, we now see the same bullish pattern forming again on the right side of the chart, similar to the first FMFR.
This is powerful because:
Pattern repetition means consistent order flow
Smart money is using the same blueprint
It gives us confidence to follow the trend
⚠️ When the same bullish setup happens twice — it’s not by chance.
6️⃣ Structural Mapping – Road to Reversal Zone
On the far right, we’ve entered clean bullish structure, making higher highs and higher lows.
We are now targeting:
The next Reversal Zone near 1.16800
This zone could act as resistance or another trap
A strong reaction from this zone can trigger either profit-taking or short-term reversal
Price is currently in the "continuation" part of MMC, heading toward premium levels.
📈 Trading Plan Based on This Setup:
✅ Primary Bullish Plan:
Price respects current structure
Breaks minor highs with strong volume
Entry on retracement to broken structure
Target: 1.16800 reversal zone
⚠️ Alternate Bearish Setup (If Price Rejects Reversal Zone):
Sharp rejection from reversal zone
Break of structure (BOS) on lower timeframe
Entry on lower high retest
Target: Liquidity areas below 1.16200
🧵 Conclusion:
This EUR/USD chart is a blueprint of institutional market flow. From the liquidity sweep, to volume absorption, to repeating bullish patterns, we’re seeing a textbook Market Maker Cycle (MMC) play out.
Here’s what makes this chart powerful:
✔️ Volume confirms structure
✔️ Reversal zones are clearly defined
✔️ Same bullish pattern = smart money roadmap
✔️ Trade setups are clean with defined risk
✅ This is the kind of setup you wait days for — don’t rush, follow structure, and execute with confirmation.
Euro-dollar pushes below $1.16 for nowThe announcement of 30% American tariffs on the EU from 1 August caused some negativity on the prospects for the bloc’s economy, but as with any similar announcement so far this year it’s likely that the figure can be negotiated down or just backtracked by the American government. A more immediate important factor driving euro-dollar down has been the significant rise in American annual headline inflation in June to 2.7%. The ECB is likely to cut once more this year and the Fed twice, but there’s some intrigue on the timing of the latter.
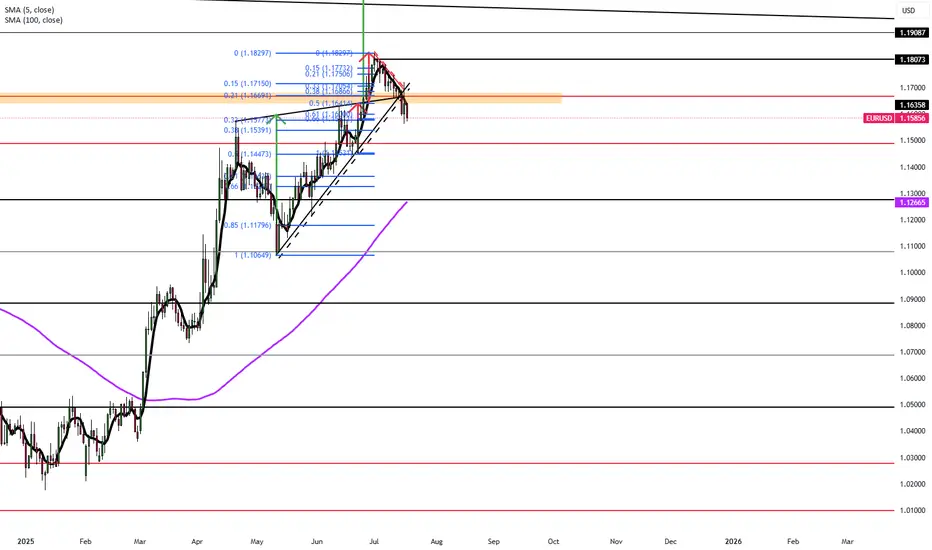
The retreat from the area of $1.18 – a high of nearly four years – has so far been fairly consistent with some momentum. However, $1.16 still seems to be an important battleground, with the long wick on 16 July indicating buying pressure. With the price currently oversold and there not being a clear uptick in selling volume, the 50 SMA around $1.155 might be an important short-term dynamic support.
A move back up to the 38.2% monthly Fibonacci retracement around $1.166 seems possible in the next few days depending on the volume of buying and reactions to upcoming news. For now, the movement seems more like a relatively small retracement in the context of the uptrend than the beginning of a new downward or sideways trend, but this depends on the reaction to the ECB’s meeting on 24 July as well.
This is my personal opinion, not the opinion of Exness. This is not a recommendation to trade.

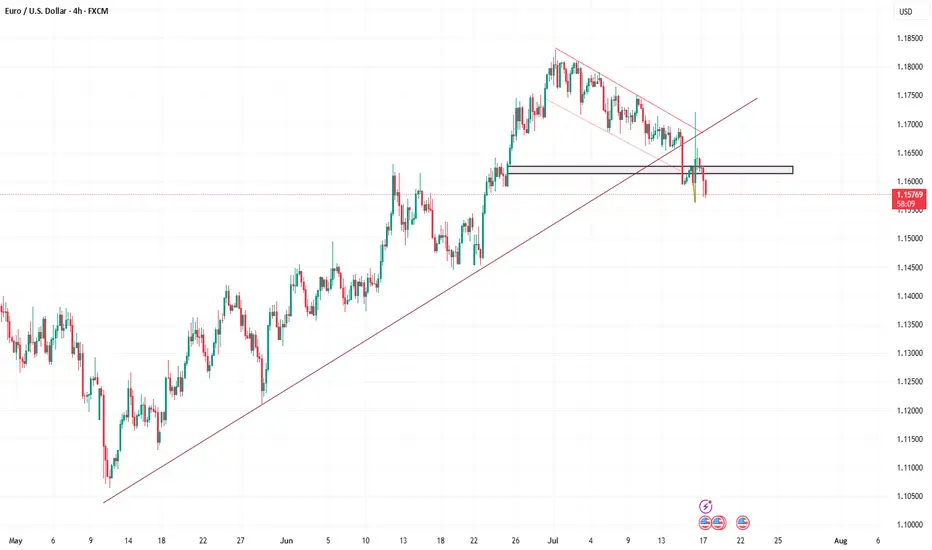
BullsHaving in mind that the have been in buys through the year so far. This would be a flag formation and we currently on the daily FVG which provides an entry to continuation in buys.
NB we have a resistance line and that would be iur target before EURUSD starts to dunp massively. Closure below the FVG will result in closure of the buys.
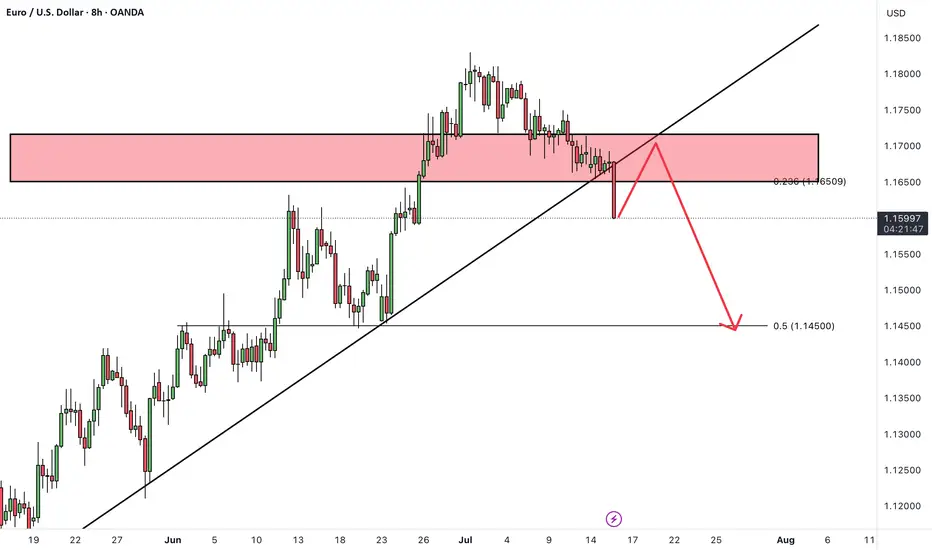
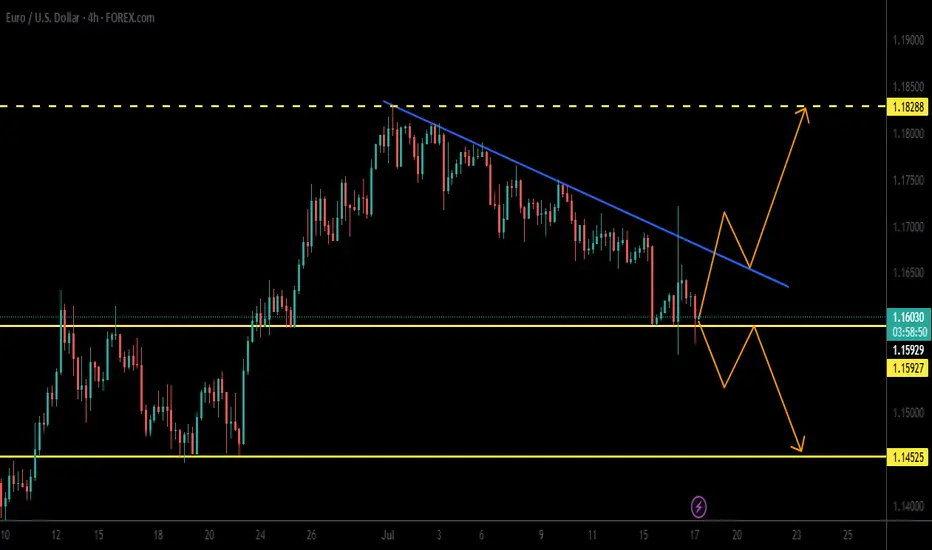
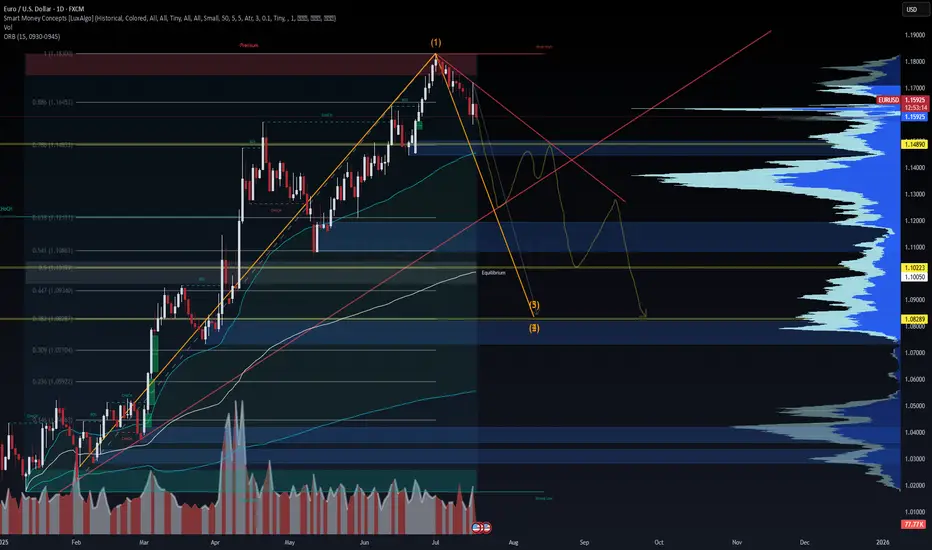
EUR/USD Bearish Wave Outlook Into September 2025EUR/USD Bearish Wave Outlook Into September 2025
Technical + Elliott Wave + Macro View
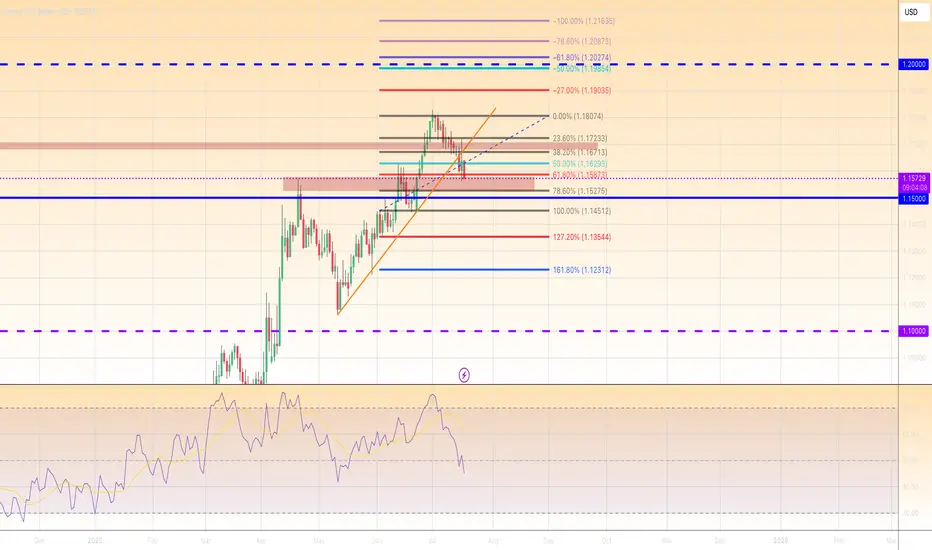
EUR/USD has likely completed a major top at 1.18300, which aligns with the 1.0 Fibonacci extension. This level acted as a liquidity sweep before reversing sharply, marking the top of Wave (1) in the current Elliott sequence. We're now entering Wave (3) to the downside—a high-momentum leg often driven by macro confirmation.
Price has broken the ascending channel and rejected the 0.786 and 0.886 retracement zones. With lower highs forming, the structure is weakening. The next likely target sits around 1.10223, a key Fibonacci and order block confluence. If momentum accelerates, EUR/USD could continue toward 1.08289, completing the full Wave (2).
From a macro lens, the divergence between the Fed and ECB continues to widen. The U.S. economy remains resilient with sticky inflation and strong yields supporting the dollar. In contrast, Europe is showing signs of stagnation, with Germany and France struggling to post meaningful growth. This favors continued downside on the pair.
Expect potential relief rallies into 1.1400–1.1550, but these are likely to be sold unless a fundamental catalyst shifts sentiment.
Bias: Bearish
Targets: 1.1022 > 1.0828
Invalidation: Clean break and close above 1.1700
—
🔔 Watch for volume spikes and failed reclaims of structure as confirmation. DSS signals aligned.
#EURUSD #Forex #ElliottWave #SmartMoneyConcepts #MacroTrading #WaverVanir #VolanX #DollarStrength #FXForecast #TechnicalAnalysis
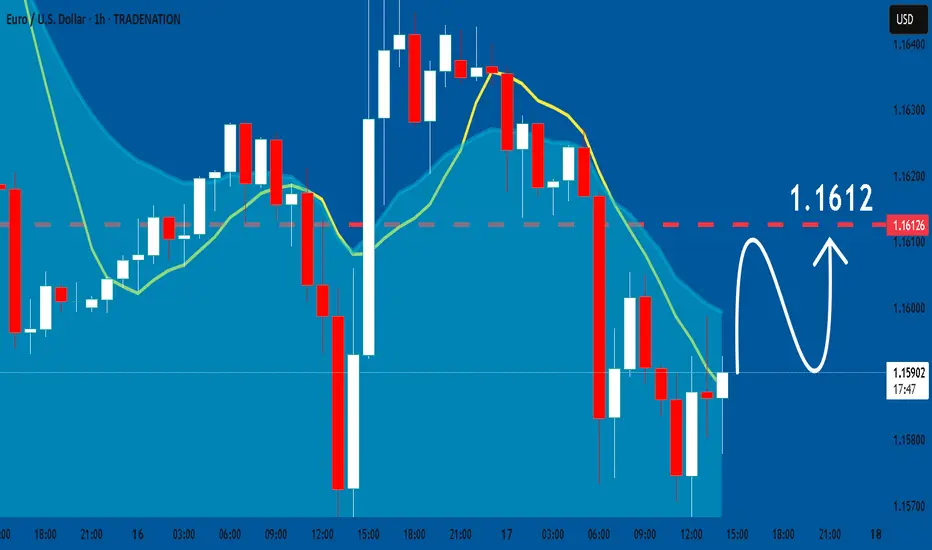
Eurousd techinical analysis.This chart shows a technical analysis of the EUR/USD currency pair on a 2-hour timeframe. Let's break down the elements and implications:
---
Key Chart Elements:
Current Price: 1.15988
Bullish Move Expected:
A potential price increase of 0.00574 (0.50%), targeting 1.16385 around 21:00 on July 17, 2025.
This is indicated by the curved arrow pointing upwards and the blue box highlighting a projected move.
FVG (Fair Value Gap):
This zone often represents inefficiencies in the market where price might return to fill the gap. There's a visible FVG around the current action zone.
O.B (Order Block):

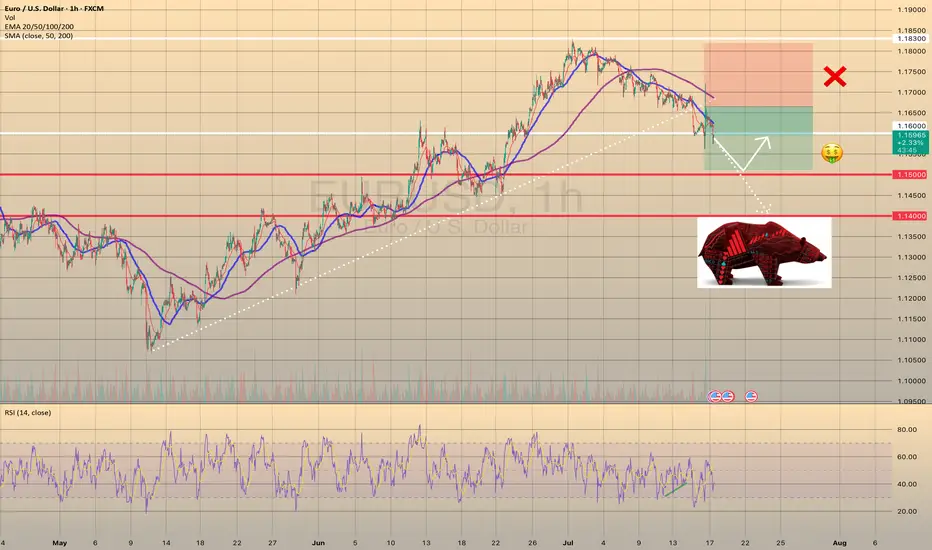
EURUSD - BEARISH TREND CONTINUESEURUSD - BEARISH TREND CONTINUES📉
On Tuesday, despite the bullish divergence (highlighted as green on RSI), the price broke through the trendline, formed since the beginning of May. Yesterday this trendline got retested on Bloomberg's rumor that Powell may resign. Currently the price is going through the support level of 1.16000.
I see the major way is to go towards 1.15000 support level with a further rebound and possible target of 1.16000. Another option is to go straight towards 1.14000. Will see.
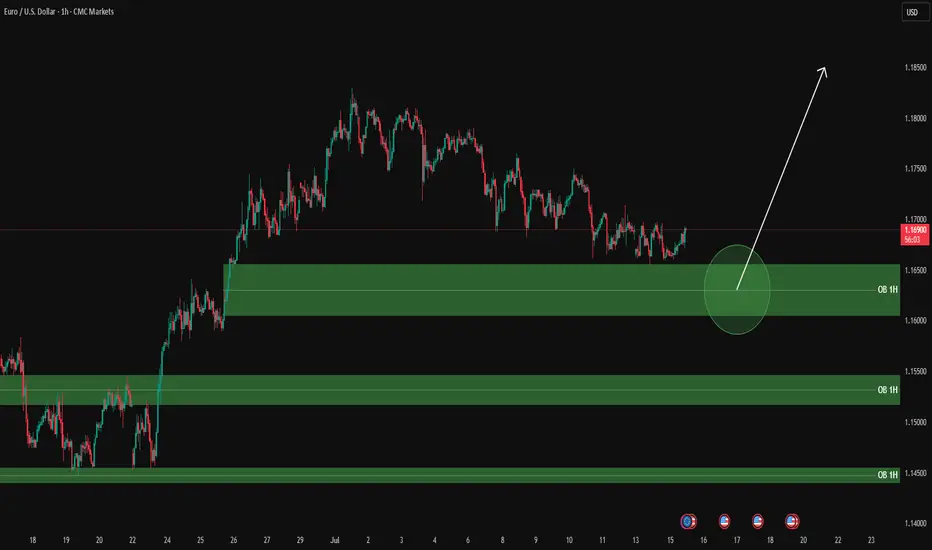
EURUSD analysis – 1H OB Setup
✅ Green zones = 1H Buy Order Blocks
Clean plan:
Wait for price to reach the green circle zone (1.1600 – 1.1650 OB).
Once there:
✅ Drop to LTF (5M / 3M) and wait for:
Price reaction to the OB zone
BOS / CHoCH structure confirmation
Strong bullish candle for clean entry
Then, enter with stop below the OB zone.
🎯 Targets:
First TP: 1.1690 – 1.1700
Second TP: higher previous highs if momentum continues
⚠️ Let price enter your zone, get your LTF confirmations, and then take your entry with discipline.
📊 ProfitaminFX | Gold, BTC & EUR/USD
📚 Daily setups & educational trades
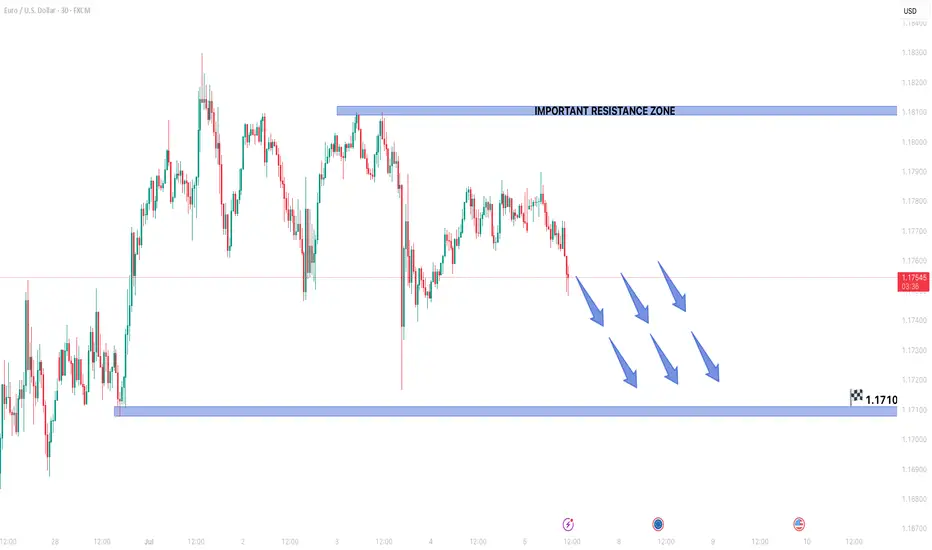
EURUSD FORMING BEARISH TREND STRUCTURE IN 15 MINUTES TIME FRAMEEURUSD is forming lower lows and lower highs.
Sellers are maintaining selling pressure from late few sessions.
Market is expected to remain bearish in upcoming trading sessions.
On lower side market may hit the target level of 1.17100
On higher side 1.18100 can act as an important resistance zone.