USDEUR trade ideas
EURUSD Forming Bullish Continuation SetupEURUSD is currently retesting a key breakout zone that previously acted as resistance and is now serving as strong support around the 1.1620–1.1630 area. After a healthy bullish impulse in recent weeks, the pair is pulling back in a controlled manner, likely forming a bullish continuation setup. I entered from earlier levels and remain confident in a further upward move, with the structure showing signs of a new bullish wave forming.
From a fundamental perspective, the euro is gaining strength as the European Central Bank (ECB) continues to signal a more cautious stance on rate cuts compared to the Federal Reserve. US inflation data released last week came in softer than expected, increasing speculation that the Fed could start its rate-cutting cycle as early as September. This shift in monetary policy outlook has weighed on the US dollar, opening up room for EURUSD to push higher.
Additionally, eurozone macro data is showing early signs of recovery, especially in Germany, where industrial production and sentiment indicators are slowly improving. As inflation in Europe trends lower but remains sticky, the ECB has fewer reasons to rush into easing, which adds strength to the euro over the medium term. This divergence is a critical driver of the current bullish sentiment in EURUSD.
Technically, the market is respecting a clean demand zone, with momentum indicators starting to flatten after the recent correction. With the trend structure intact and fundamentals aligned, I'm targeting the 1.2180–1.2200 zone as the next leg of this bullish cycle. Price action remains favorable, and the broader sentiment on TradingView is also increasingly bullish, confirming my conviction in this setup.

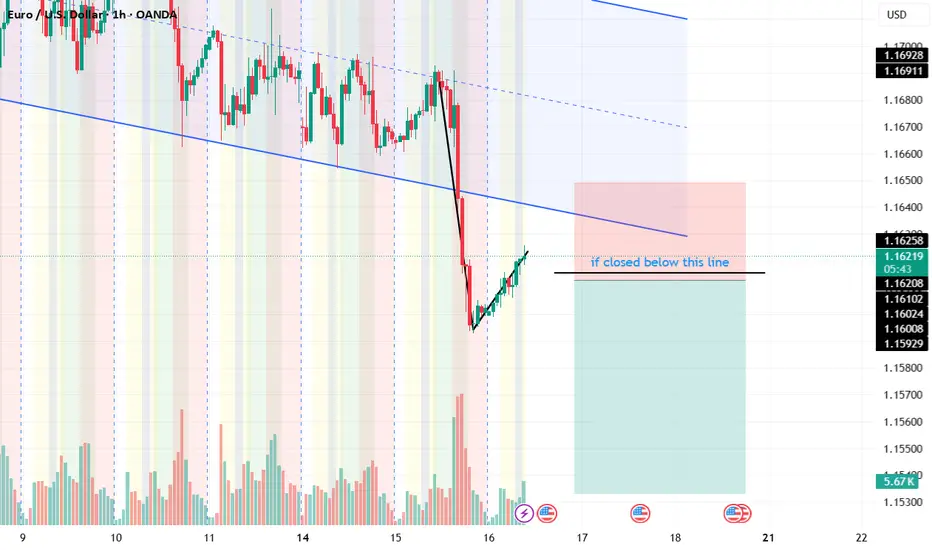
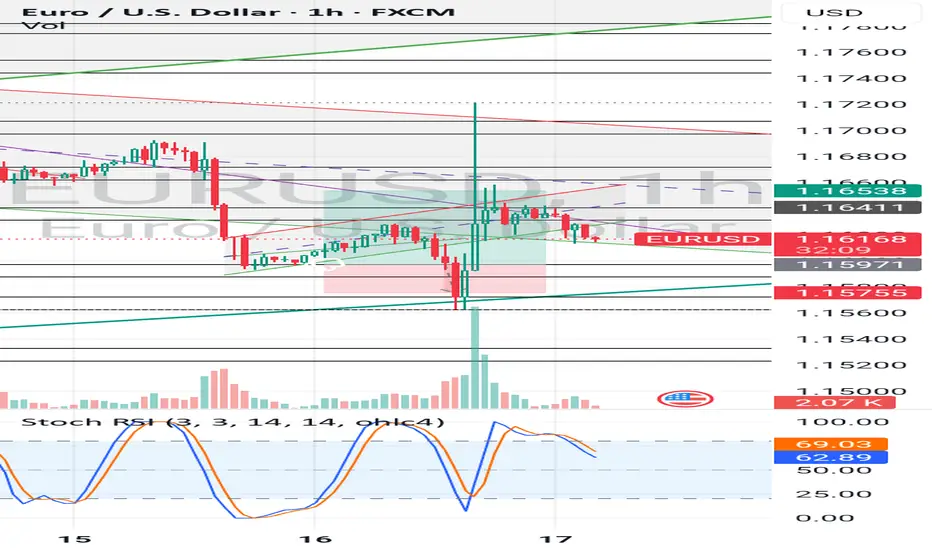
Buying opportunities on EURUSDYesterday, EURUSD saw a sharp spike after reports that Trump might fire the Federal Reserve Chair.
Although this wasn’t confirmed, the news triggered short-term volatility before the market settled down again.
At the moment, EURUSD is reacting to key support levels. Watch for the formation of a higher low and potential signs of a new bullish move.
The goal remains a breakout above the previous high and continuation of the main uptrend.
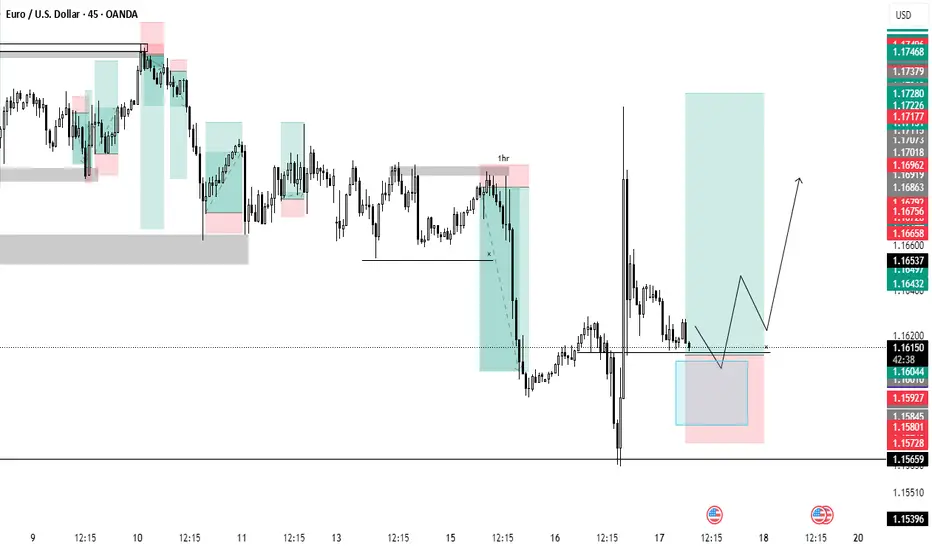
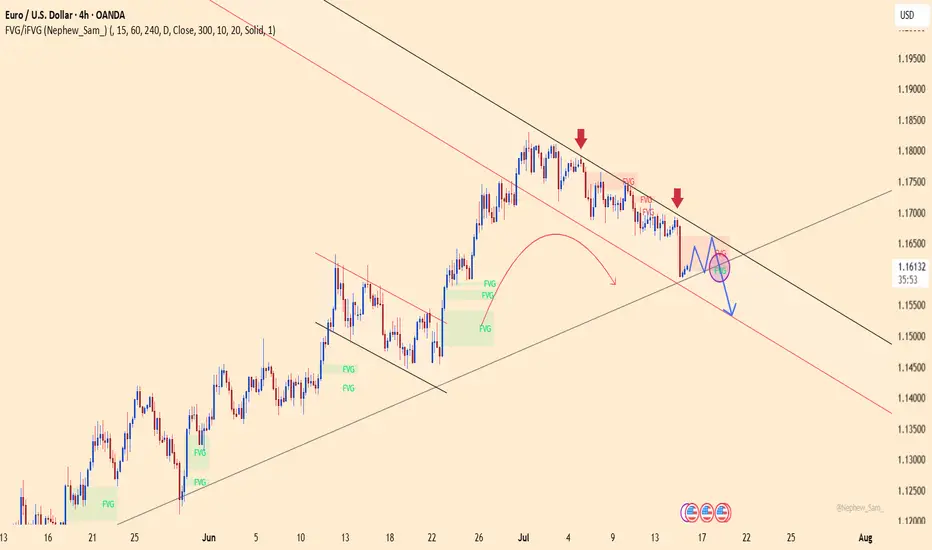
Trump’s Noise, Market’s Choice: Downtrend ContinuesTrump came out with a fake piece of news to create some volatility for himself.
But the trend went back to its original path, and in my opinion, the downtrend will likely continue.

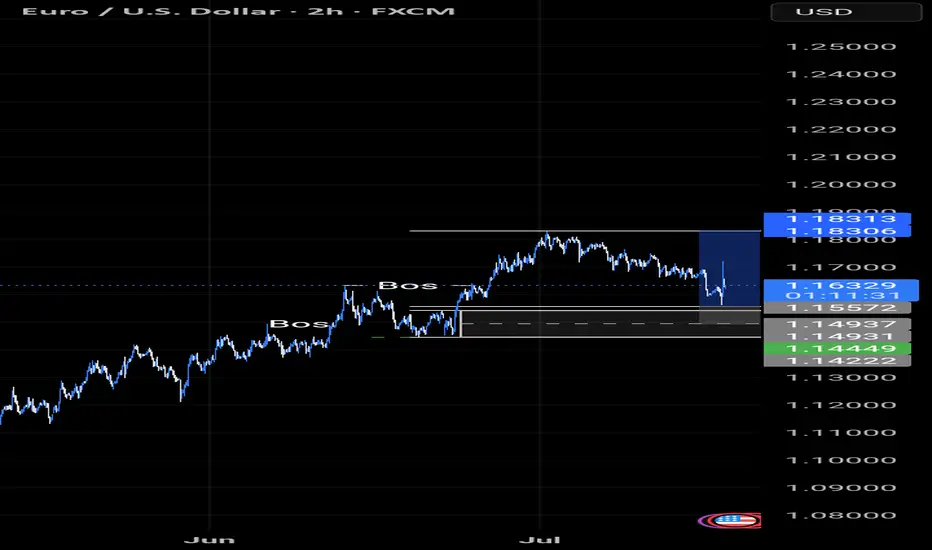
EURUSD Elliott Wave: Top in PlaceExecutive Summary
Wave 1 rally from January 2025 to July 2025 appears complete
Decline to 1.1170 and possibly 1.08 in wave 2.
The support shelf near 1.1170 may contain the decline.
We now have enough evidence in place to consider a medium-term (or longer) top in place for EURUSD.
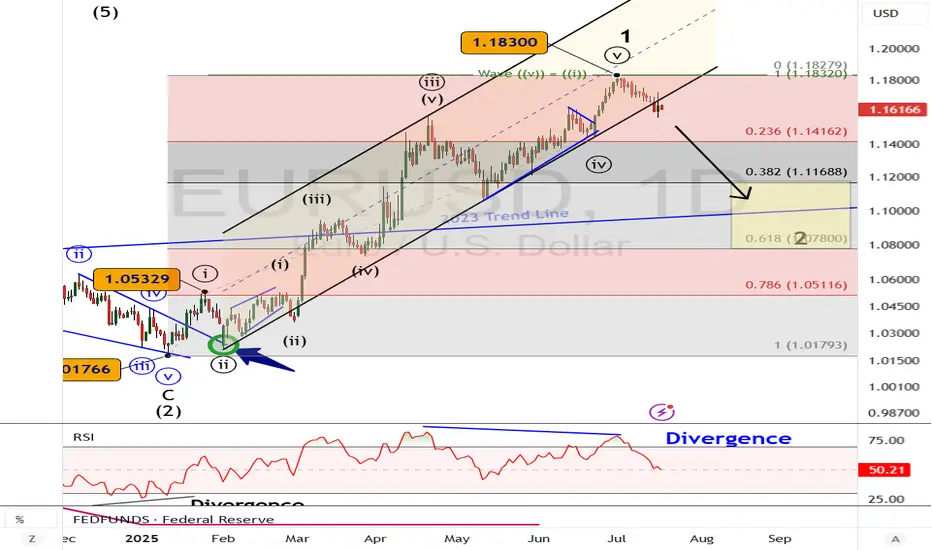
The weekly chart above shows a rally from the January 2025 low that reached the upper parallel at the July high. This rally appears to be complete and a sideways to lower consolidation is likely underway.
On January 24, we forecasted a rally with a second target of 1.18. EURUSD reached the target topping at 1.1830.
Now, it’s time to flip the scrip as a correction is likely underway to correct that strong rally.
The 6-month rally in EURUSD appears to have ended this month and a correction is likely underway to 1.1170 and possibly lower levels.
The top of EURUSD on July 1 is labeled as wave 1. The decline underway appears incomplete and would be wave 2.
Within the wave 1, wave ((v)) measures equal to wave ((i)) at 1.1832, just a couple of pips within the actual high. Additionally, there is RSI divergence within the wave ((v)) and wave ((iii)) highs. This is a common pattern within a fifth wave of an Elliott wave impulse pattern.
The next trend (lower) will likely carry to below 1.1170.
Near this level is the 38% Fibonacci retracement level of the 6-month rally. Additionally, there is a support shelf of broken resistance and congestion appearing between 1.1033 - 1.1275.
At the lower end of that price zone is a broken trend line dating back to 2023. Therefore, this price zone will offer up a strong level of support that may launch the next rally or at least a small bounce.
BOTTOM LINE
The Elliott wave impulse pattern from January to July 2025 appears over. A downward correction appears to have begun and may visit 1.1170 and possibly lower levels.
As the downward trend takes hold, we’ll review its structure to determine where we are at within the larger wave sequence.
EUR USD LONG RESULT Euro Price had been trading inside a falling channel then broke down the channel holding the Order Block Support from which I Opened the long position, just misread/ didn't extend our sl taking the 4HTF Support Trendline into consideration which cost the downside to be taken first before heading up
But no worries, better Setups and Results on the way 🙌
_THE_KLASSIC_TRADER_.
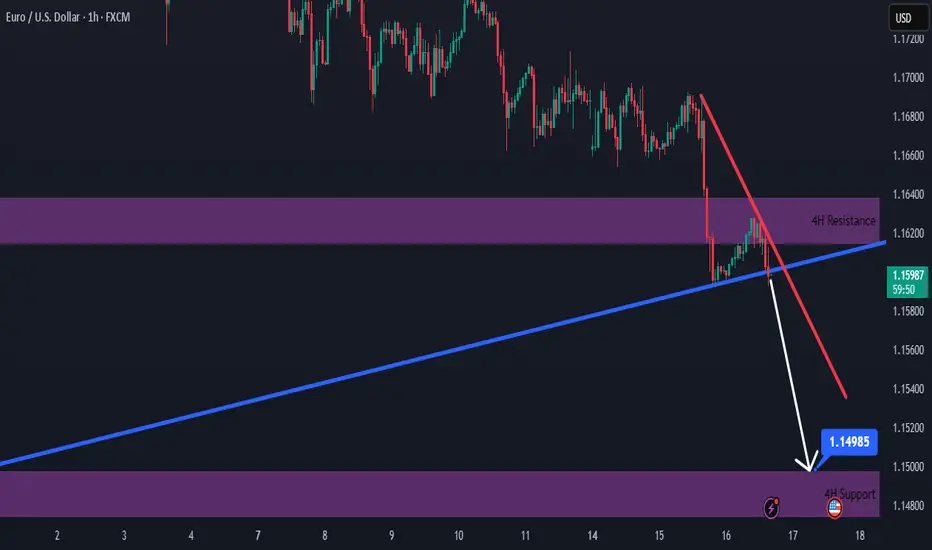
EURUSD – Weakness emerges at descending channel resistanceEURUSD remains within a well-defined descending channel and was recently rejected at the upper trendline – a key dynamic resistance zone. Price action shows the recovery is limited around 1.16600, with multiple FVG (Fair Value Gap) zones reinforcing the potential for further downside.
On the news front, the euro remains under pressure as Eurozone inflation data brought no surprises, while the US dollar is supported by June’s PPI rising exactly as expected at 0.2%. This combination leaves EURUSD with little momentum to break higher, making a move back toward the 1.15300 support area a scenario to watch.
If the price fails to break above 1.16600 and forms a lower high, the bearish trend will be further confirmed. Keep an eye on price behavior around the FVG zones to identify optimal entry points.
Potential IdeaCould see price go for last months low seeing that it took last months high so giving that this month has opened high now looking for the low then close at the end

EUR/USD Trend Analysis: Pullback or Reversal?Alright Traders,
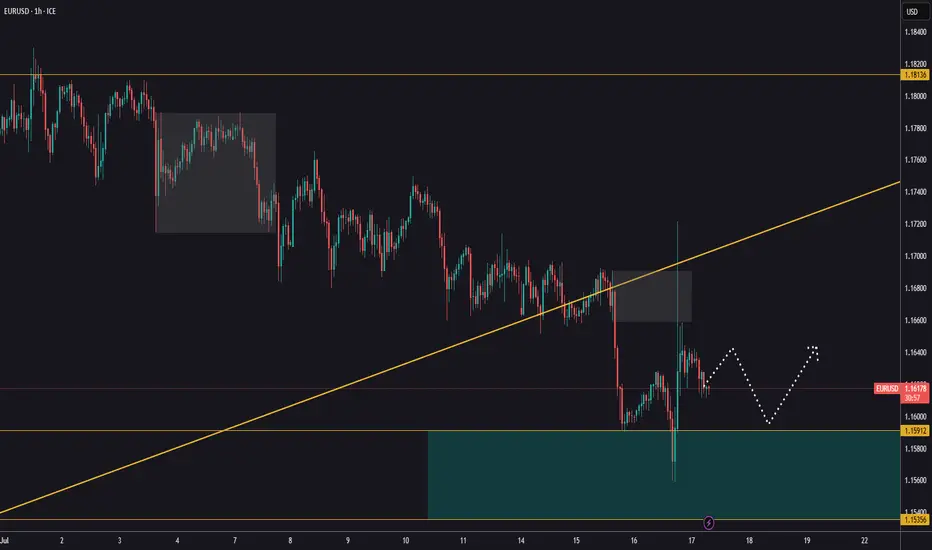
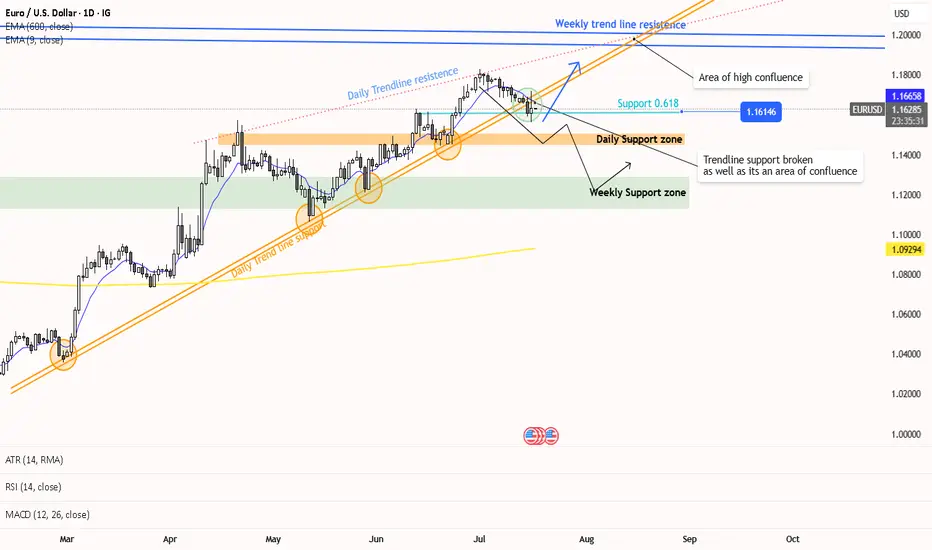
Looking at the charts, it seems price just broke below a really strong trend line support – that line held up multiple times (you can see the circled spots!).
Now, the big question is: Is this just a quick dip (a pullback) in our current uptrend, or is this the end of the uptrend altogether?
If the price holds up at the 1.16146 support level, we could see a strong move higher, potentially all the way to our daily trend line resistance (that dotted line).
But, if the 0.618 Fibonacci support level fails to hold, we might be looking at a short downtrend heading towards a daily or even weekly support zone.
My technical indicators are flashing 'buy' right now, but we know we can't just follow indicators blindly.
So, here's my plan: I'm waiting. I want to see if this pullback finishes and price starts climbing again, or if it clearly shows us the uptrend is over and a downtrend has started. Patience is key!
Timeframes used: Daily and Weekly
Current Trend: Uptrend"
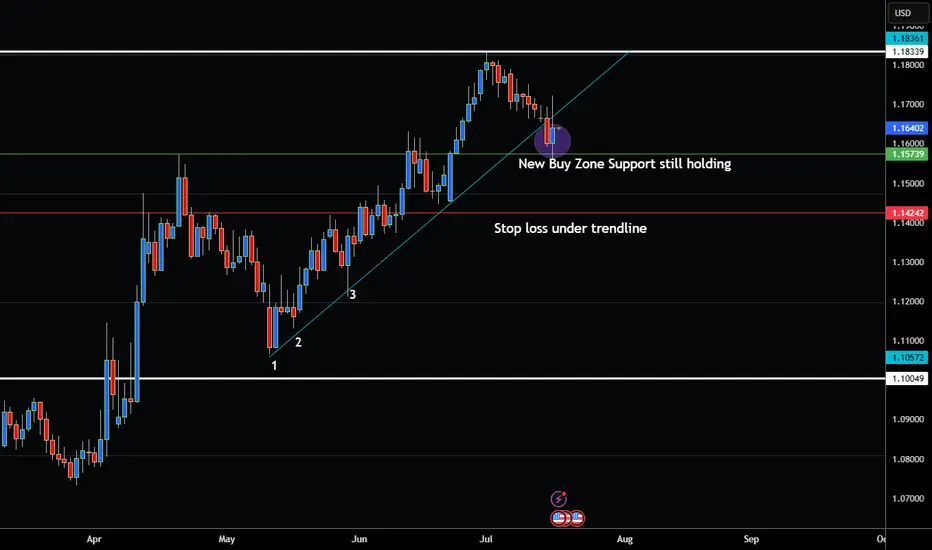
EUR/USD PULLS BACK TO BUY ZONE MORE UPSIDE AHEAD?Hey Traders so looking at Euro still looks bullish but again markets can change on a dime so always be cautious because we need to be good at defense just as much as offense in this game of trading.
Some say US Dollar may bottomed some say it's still going to weaken regardless of what do news says what can the charts show us?
I see a support level of 1.1573 holding for now I see new highs made at 1.1833.
Also I see higher lows and higher highs this all signals an uptrend but again trend changes happen.
However I still see enough to stay bullish for now so if your bullish consider buying here with a stop below support 1.1424
But if bearish I would wait for break below support at 1.1424 before selling into a rally. That way market confirms it wants to change trend.
Good Luck & Always use Risk Management!
(Just in we are wrong in our analysis most experts recommend never to risk more than 2% of your account equity on any given trade.)
Hope This Helps Your Trading 😃
Clifford
Fed warning: Rate cut rally or credibility crisis?JPMorgan and Goldman Sachs have both raised their concern about political interference at the Federal Reserve, amid reports that President Trump considered firing Fed Chair Jerome Powell earlier this week.
In a note titled “How Safe is Powell’s Job?”, JPMorgan analysts warned that even the perception of a politically motivated dismissal could undermine the Fed’s credibility and spark market volatility.
Goldman Sachs CEO David Solomon echoed the concern in a CNBC interview, describing central bank independence as “super important,” and warning that it remains a pillar of global economic stability that “we should fight to preserve.”
The warnings followed a volatile 24-hour period in markets, after reports emerged that Trump had drafted a letter to dismiss Powell and floated it among Republican leaders. This might prove the right distraction from the Epstein client list?

EURUSD Seller in controlEURUSD made a strong rejection toward resistant which hint that it will going down again.
I'm expecting a pullback toward resistant zone again.
waiting confirmation price action in a lower timeframe for a minimum drawdown.
good luck.
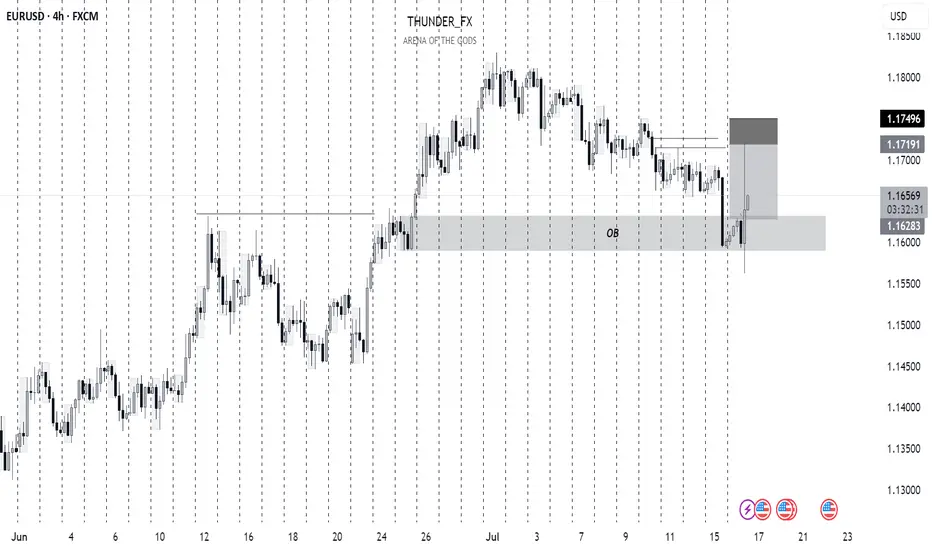
EURUSD BUY IDEA SWING PLAY (WEEKLY) Outlook🔁 EUR/USD Long – Weekly Buyside Re-Test for 1.17 Breakout 🌍📈
Description:
EUR/USD is retesting a weekly buyside liquidity zone between 1.1575–1.1600, which previously acted as strong resistance and has now flipped into support. This zone aligns with a confluence of breakout structure, Fibonacci mid-point, and a clean liquidity sweep beneath local lows.
📉 Trade Setup:
Entry Zone: 1.1475–1.1600 (buyside retest)
Stop Loss: 1.1400 Zone (risker)
Safer stop: use chart
Target 1: 1.1777
Target 2: 1.1877
Target 3: Open(manage)
Risk-Reward: ~1:3+ depending on entry precision
Trade Type: Swing / Trend Continuation
📊 Technical Bias:
Weekly structure flipped bullish after breakout above 1.1575
Daily shows clean HH/HL sequence with strong momentum
RSI/MACD favor continuation with no divergence yet
DXY weakness supports continuation move
🧠 Macro + Sentiment Overlay:
EUR supported by improving Eurozone data + reduced ECB dovishness
Fed pause expectations + soft US CPI drive USD weakness
Retail sentiment shows most traders are short EUR/USD — contrarian bullish
⏳ Patience:
Let price stabilize in the 1.1575–1.1600 zone with a bullish engulfing or H4 reversal signal before execution. Structure invalidation below 1.1530.

EURUSD TRADE IDEA UPDATE We had a pullback on EURUSD. Although we didn't get a full pullback to our Fibonacci level and the market seems to have taken off to the upside.
Let's see how the market unfolds
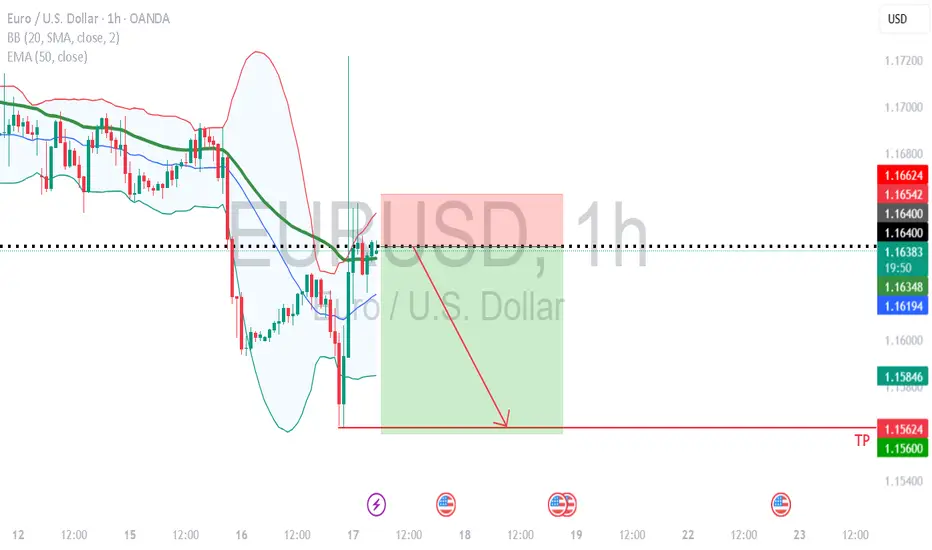
Bearish Momentum Builds Below Broken Support
Hello everybody!
Price is in a strong bearish trend and has broken a support area, which we now expect to act as resistance.
The break of the upward trendline adds a second confirmation to take a short position.
The target is around 1.14990.
The stop loss is placed beyond the downward trendline and will be trailed along with it.
If the downward trendline is broken, the short position will be invalidated.
EUR/USD Technical Outlook Daily chart frame**EUR/USD has bounced from the S1 zone (\~1.1595–1.1575)**, chart analysis
**EUR/USD Technical Outlook**
**Current Price:** \~1.1618
**Recent Action:** Rejection from S1 zone, forming a potential base.
**Bullish Scenario (Active)**
The pair has bounced from key **S1 support** (1.1595 area), suggesting demand is present.
**If momentum holds:**
* **Immediate Target 1:** 1.1645 (Fibonacci + 21 EMA)
* **Target 2:** 1.1665–1.1685 zone (7 EMA + minor resistance)
* **Target 3:** 1.1725 (R1 zone and mid-July resistance)
* Breakout above R1 would shift momentum firmly bullish.
*Watch for bullish continuation candles and rising volume.*
**Bearish Risk (Still Possible)**
* If the bounce stalls near **1.1645–1.1665**, and the pair reverses:
* A drop back toward **1.1595–1.1575** support could occur again.
* Break below that zone would expose:
* **S2 support at 1.1510**
* Possibly extend to **1.1475** in case of stronger USD demand
Summary:
* **Bounce from S1** shows initial bullish strength.
* **Key resistance to break:** 1.1645–1.1685 for bullish continuation.
* **Key support to hold:** 1.1595–1.1575 to avoid deeper correction.

sell idea on EURUSDI LIKE THIS 4HR SETUP. eurusd is pushing in bearish mode as the dxy is correcting up.. I feel like we can reach these two targets if we can break below this next consolidation
two targets as the second target would be good place to exit hitting that next strong area of support
trade idea fulfilledi expected EU to take out the eh above, get into the fvg and then sell off. it has done just that
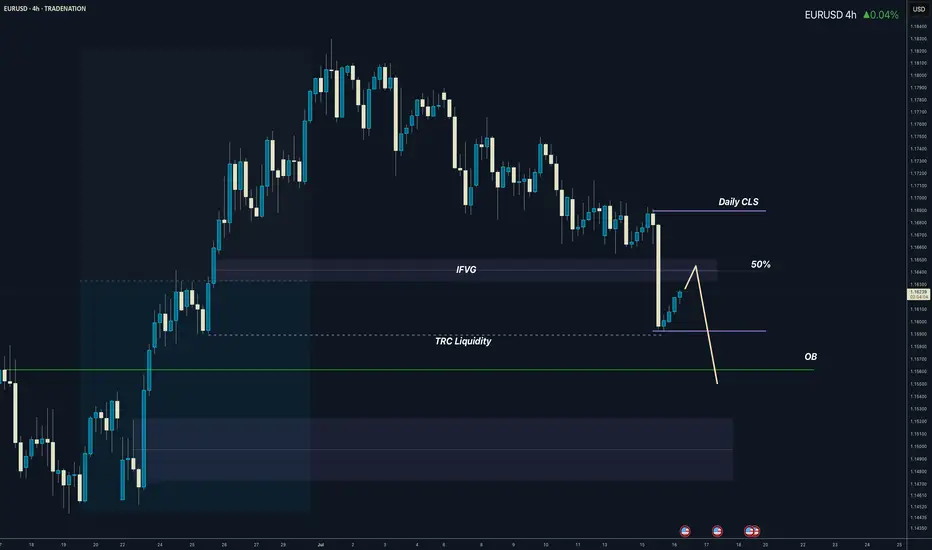
Daily CLS I Model O I CLS low will be visited...Yo Market Warriors ⚔️
Fresh outlook drop — if you’ve been riding with me, you already know:
🎯My system is 100% mechanical. No emotions. No trend lines. No subjective guessing. Just precision, structure, and sniper entries.
🧠 What’s CLS?
It’s the real smart money. The invisible hand behind $7T/day — banks, algos, central players.
📍Model 1:
HTF bias based on the daily and weekly candles closes,
Wait for CLS candle to be created and manipulated. Switch to correct LTF and spot CIOD. Enter and target 50% of the CLS candle.
For high probability include Dealing Ranges, Weekly Profiles and CLS Timing.
Analysis done on the Tradenation Charts
Disclosure: I am part of Trade Nation's Influencer program and receive a monthly fee for using their TradingView charts in my analysis.
Trading is like a sport. If you consistently practice you can learn it.
“Adapt what is useful. Reject whats useless and add whats is specifically yours.”
David Perk aka Dave FX Hunter
💬 Comment with requests for analysis, just post instrument. I will answer with my opinion.
Price action Eurusd has made lower low now price gone back to sweep liquidity another chance to lower

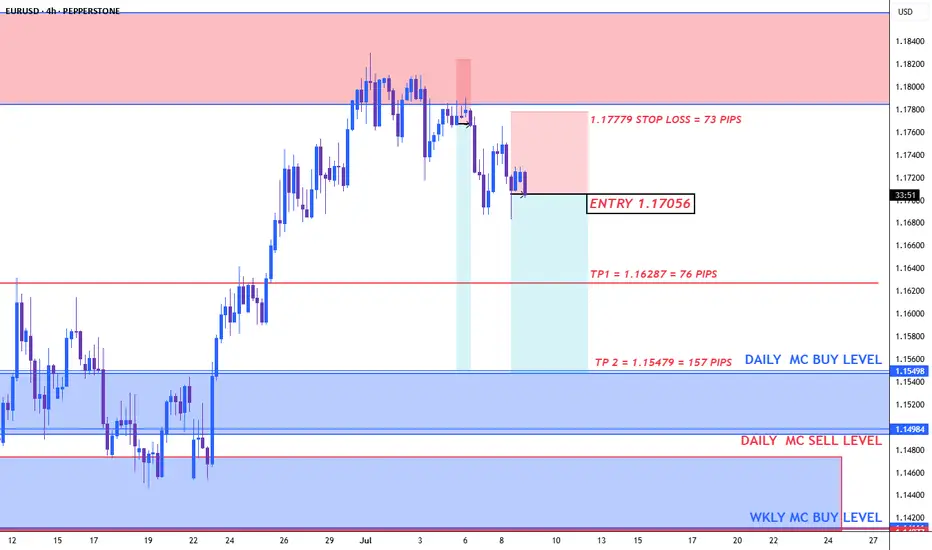
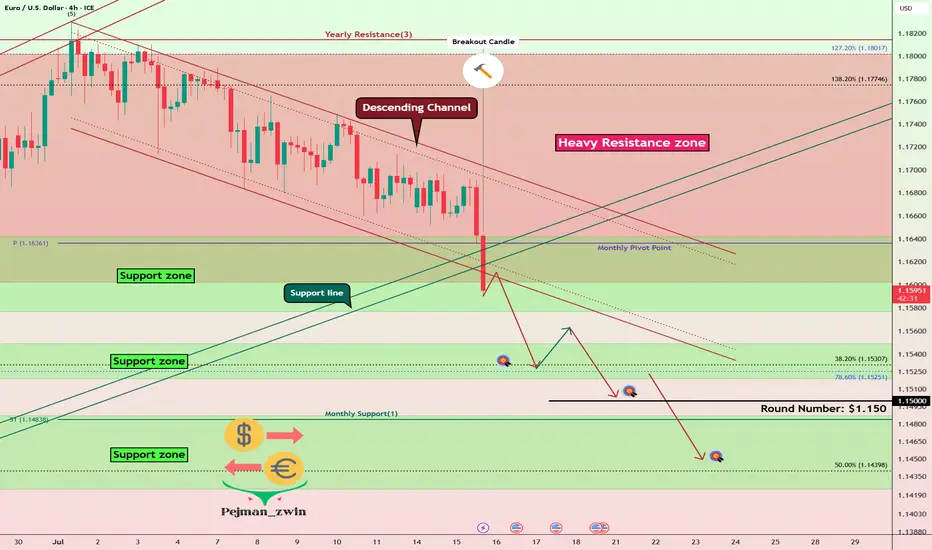
EURUSD Under Pressure After Hot CPI – More Downside Ahead?Today, the US released key inflation figures :
Core CPI m/m: 0.2% (vs 0.3% forecast)
CPI m/m: 0.3% (as expected)
CPI y/y: 2.7% (vs 2.6% forecast, up from 2.4%)
Fundamental Analysis ( EURUSD ):
The slightly lower Core CPI suggests some easing in underlying inflation pressures. However, the headline CPI y/y came in hotter than expected at 2.7%, reinforcing the idea that the Fed is not yet ready to ease policy aggressively.
This combination supports the US dollar, as sticky inflation could delay rate cuts.
EURUSD is likely to remain under pressure in the short term unless the ECB signals a more hawkish stance or US data starts showing broader weakness.
Now let's move on to the technical analysis of EURUSD ( FX:EURUSD ) on the 4-hour timeframe .
EURUSD is trading in a Heavy Resistance zone($1.1802-$1.1602) , having simultaneously managed to break the Support lines and the lower line of the Descending Channel , and is also trying to break the Support zone($1.1642-$1.1578) .
I expect EURUSD to continue its downtrend and decline to the Support zone($1.1549-$1.1520) at the first target .
Second target : $1.15043
Third target : $1.1464
Note: Stop Loss(SL)= $1.1660
Please respect each other's ideas and express them politely if you agree or disagree.
Euro/U.S. Dollar Analyze (EURUSD), 1-hour time frame.
Be sure to follow the updated ideas.
Do not forget to put a Stop loss for your positions (For every position you want to open).
Please follow your strategy and updates; this is just my Idea, and I will gladly see your ideas in this post.
Please do not forget the ✅' like '✅ button 🙏😊 & Share it with your friends; thanks, and Trade safe.
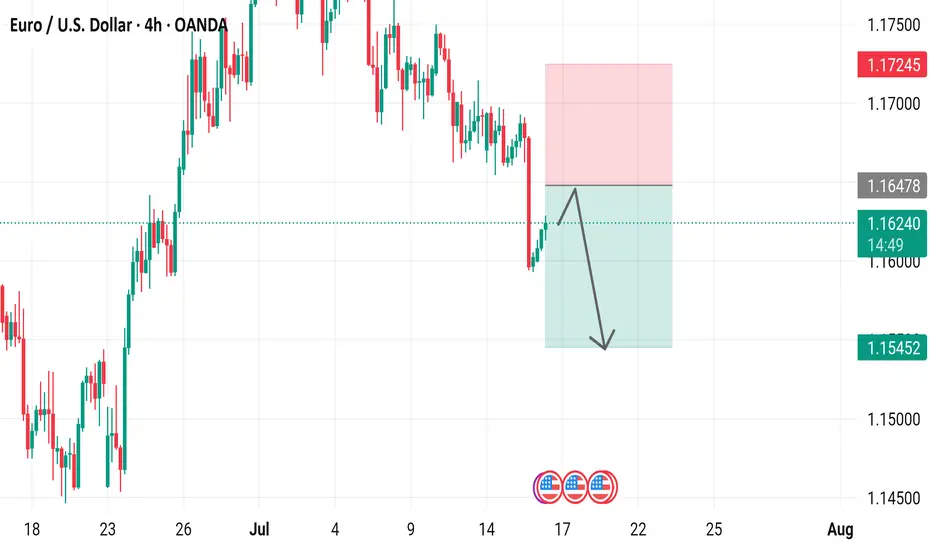
Euro/U.S. Dollar (EUR/USD) 4-Hour Chart - OANDA4-hour performance of the EUR/USD currency pair. The chart shows a recent upward trend peaking around 1.16241, followed by a sharp decline to approximately 1.15452. Key levels include a high of 1.17245 and a support level around 1.16478, with a highlighted area indicating a potential consolidation or reversal zone.
EUR USD shortThis is not my original idea. I took some advice and looked at other ideas, so I decided to come up with a short one. Let's see what happens.
Please note: This is for educational purposes only and not a trading signal. These ideas are shared purely for back testing and to exchange views. The goal is to inspire ideas and encourage discussion. If you notice anything wrong, feel free to share your thoughts. In the end, to learn is to share !