EURUSD Will Explode! BUY!
My dear followers,
I analysed this chart on EURUSD and concluded the following:
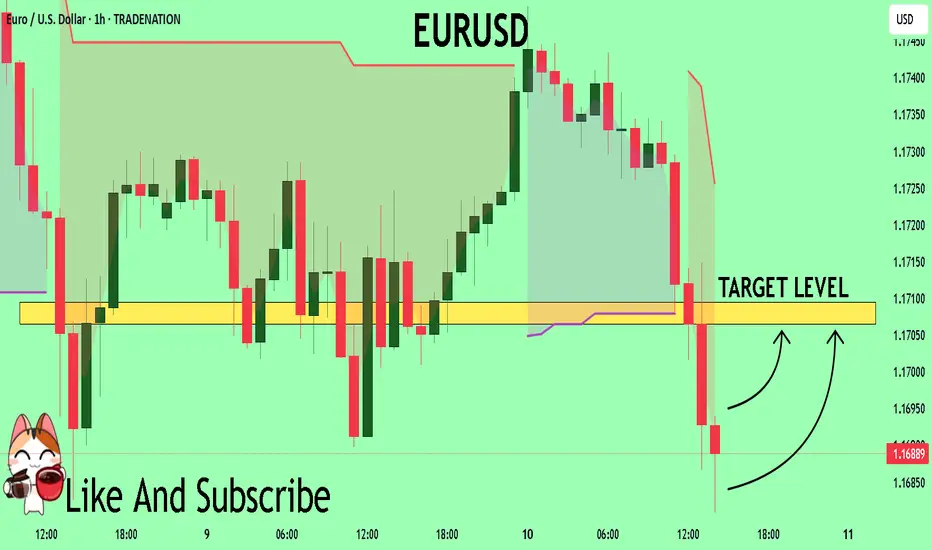
The market is trading on 1.1686 pivot level.
Bias - Bullish
Technical Indicators: Both Super Trend & Pivot HL indicate a highly probable Bullish continuation.
Target - 1.1706
About Used Indicators:
A super-trend indicator is plotted on either above or below the closing price to signal a buy or sell. The indicator changes color, based on whether or not you should be buying. If the super-trend indicator moves below the closing price, the indicator turns green, and it signals an entry point or points to buy.
Disclosure: I am part of Trade Nation's Influencer program and receive a monthly fee for using their TradingView charts in my analysis.
———————————
WISH YOU ALL LUCK
USDEUR trade ideas
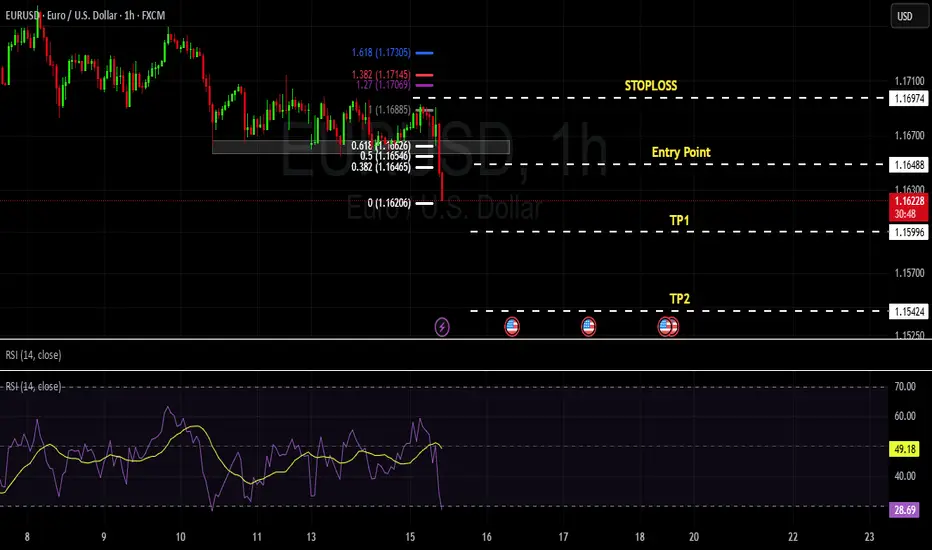
EURUSD - sell market after consolidation phase has taken control by the bears with strong support level being broken with engulfing candle (momentum candle)
we have two buy setup: wait for the market to retrace to the level of 0.382 of fib or enter instant in to the market.
TP1 and TP2 with R:R of 1:1 and 1:2
EURUSD: Long Trade with Entry/SL/TP
EURUSD
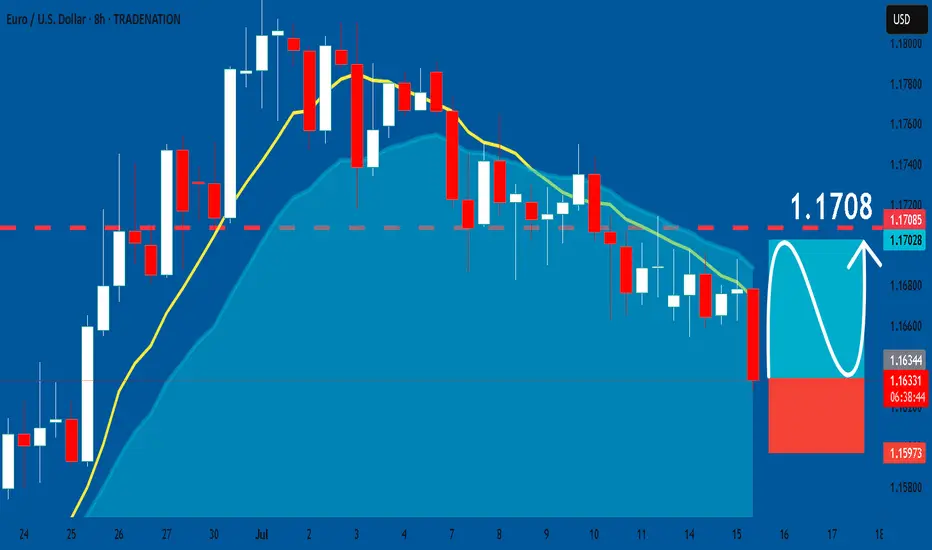
- Classic bullish pattern
- Our team expects retracement
SUGGESTED TRADE:
Swing Trade
Buy EURUSD
Entry - 1.1635
Stop - 1.1597
Take - 1.1708
Our Risk - 1%
Start protection of your profits from lower levels
Disclosure: I am part of Trade Nation's Influencer program and receive a monthly fee for using their TradingView charts in my analysis.
❤️ Please, support our work with like & comment! ❤️
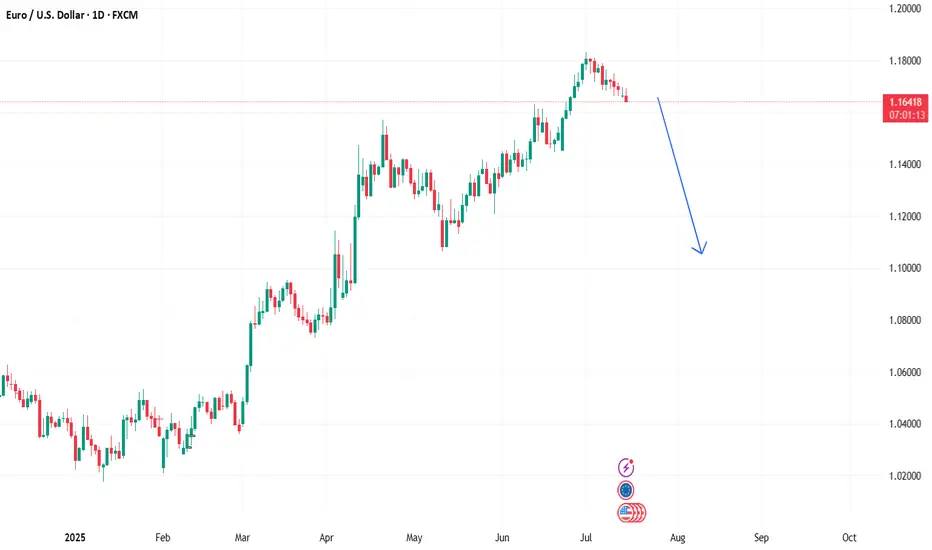
Bearsih EurUsd!The fibre has begun its downward spiral. You can look for sell set-ups from now on; every time it buys, wait and look for sells. Unless of course you can trade both sides of the market. Price is aiming for 1.1060 level.

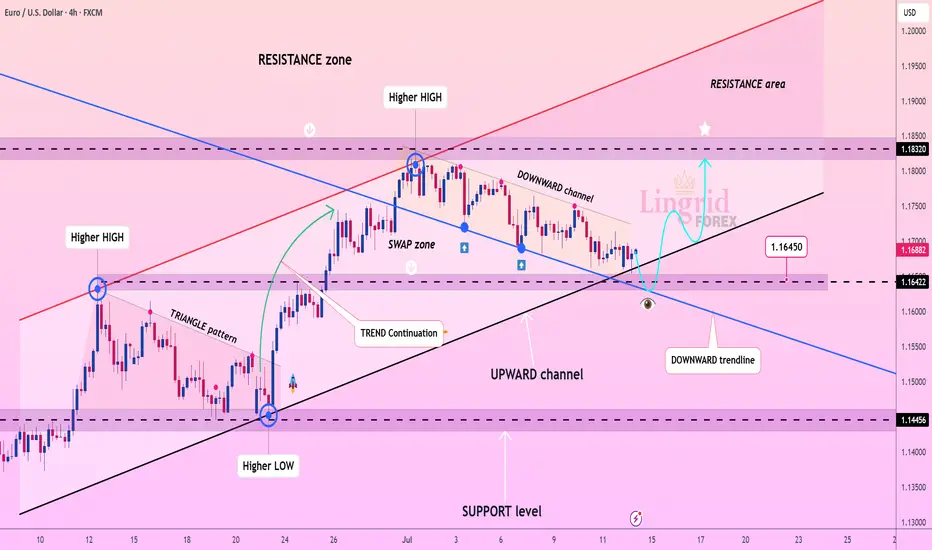
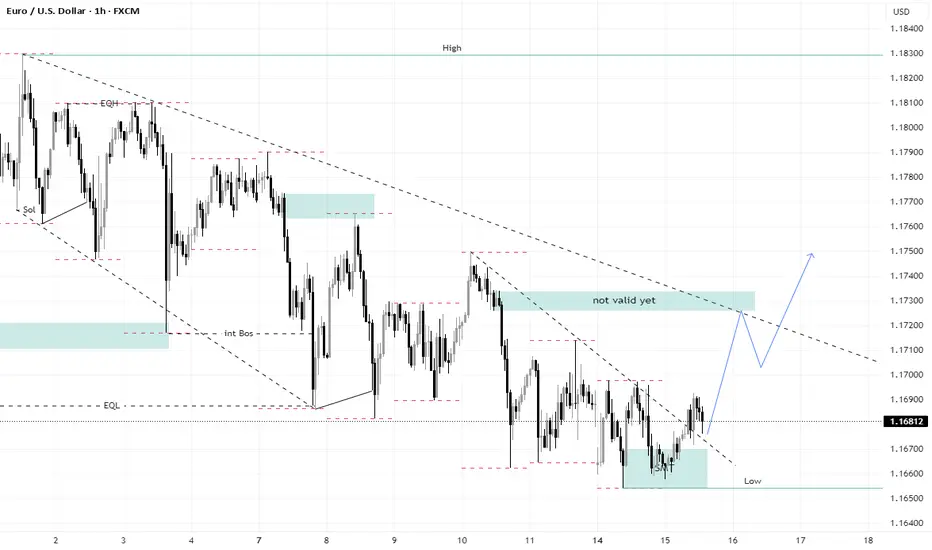
Lingrid | EURUSD Pulled Back to Key Support levelFX:EURUSD is approaching a major confluence zone at 1.16422 where the downward channel meets the upward trendline and horizontal support. The structure remains bullish with a sequence of higher highs and higher lows, and the current pullback fits within a healthy correction phase. A strong bounce from this triple-support region could trigger a reversal toward 1.18320, validating the continuation of the broader uptrend. All eyes are now on the 1.16450 reaction point for early momentum signs.
📉 Key Levels
Buy trigger: bullish reaction from 1.16422 support zone
Buy zone: 1.16200–1.16500 (channel base + trendline + demand)
Target: 1.18320
Invalidation: confirmed 4H close below 1.1600 breaks upward structure
💡 Risks
Deeper push below the trendline may trap early buyers
Low liquidity during the bounce can cause fakeouts
Unexpected USD strength could stall recovery momentum
If this idea resonates with you or you have your own opinion, traders, hit the comments. I’m excited to read your thoughts!
#EURUSDStill playing so hard!!!! Eur/usd is really waitng for aa breakout, since following the Resistance and pattern .
looking for a bullish side for now.....but its bearish this week.
whats your analysis....traders!!
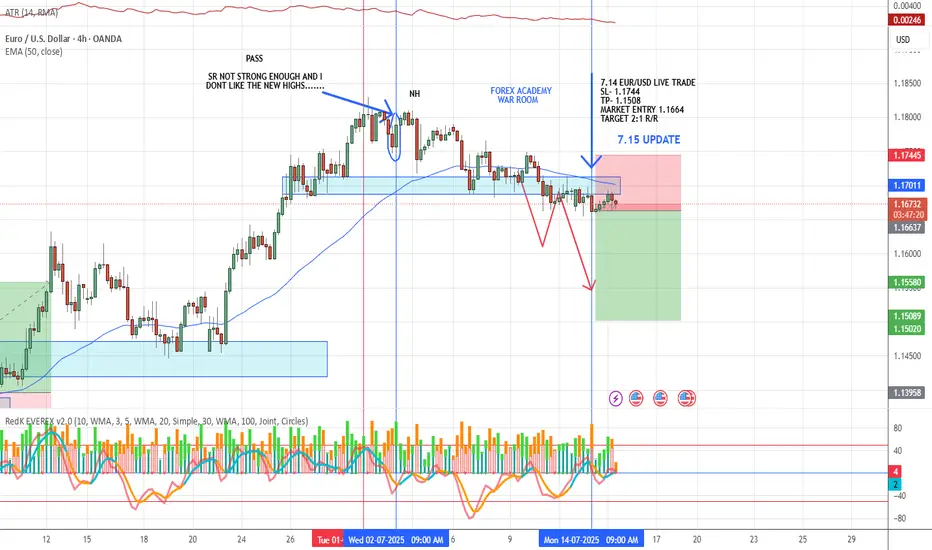
7.15 EUR/USD LIVE TRADE UPDATEWe took this trade yesterday based on the pullback followed by a strong engulfing candle. volume and momentum are strong. Currently looks like it is having a hard time getting out of the S/R zone which to me seems pretty strong. I still think this market is heading down. We will wait and let the market do it's thing.
EURUSD Remains Under Pressure Following CPIThis morning, after the US CPI report was released at 8:30 AM EDT, EUR/USD surged briefly due to a slightly weaker-than-expected inflation reading. Despite this, signs of rising inflation persisted, leading EUR/USD to rise sharply before quickly retreating.
EUR/USD has seen an intermediate top at 1.1830 since early July. The euro is under pressure due to looming US tariffs (30% on EU imports, effective August 1) and mixed economic signals, like Eurozone industrial production rising 1.7% in May (vs. 0.9% expected). The pound (GBP) and other currencies are also reacting to tariff concerns.
Taking a look at the 1hour chart, you can see we are still trading below a descending trendline. Taking everything into consideration, I'm positioning short sells whenever we get bounce higher.
That's it - That's all - Trade Safe

#AN021: TRUMP Threats on Tariffs and FOREX Tensions
Global markets are waking up to a currency cold war. Hi, I'm Trader Andrea Russo, and today I want to share the latest news with you.
Donald Trump set the day alight, launching a barrage of threats from a rally in Ohio:
"If re-elected, I will impose 60% tariffs on all of China, 20% on Mexico, and 10% on the European Union. And I'm telling Putin clearly: if you continue to help China evade our embargoes, we will hit Russia too."
The words reverberated across global investment banks, triggering an immediate reaction in the dollar and emerging market currencies.
Markets React: USD Soars, GBP and NOK on Alert
The US dollar gained ground against nearly all major currencies, while the GBP collapsed under pressure from fears of a BoE rate cut and a slowing labor market.
The GBP/NOK pair, in particular, is showing signs of a structured bearish breakout: the pound is under dual pressure (domestic politics + trade war), while the Norwegian krone is indirectly benefiting from rising energy prices and pro-commodity sentiment.
US CPI at 2:30 PM: The Real Detonator
The US core inflation figure will be released at 2:30 PM Italian time. The consensus is for +3.4%, but a higher reading could push the Fed to remain more hawkish for longer. This would strengthen the dollar and create new shock waves in weak and emerging market currencies.
Specifically:
USD/JPY could break above 162.00 with strength.
GBP/USD risks a break below 1.29.
USD/SEK and USD/MXN are the key pairs to watch for explosive movements.
Trump vs. Powell: A Showdown
Meanwhile, fears are growing of a direct attack by Trump on the Fed. According to Deutsche Bank, markets are underestimating the possibility that Trump will attempt to remove Jerome Powell if he returns to the White House.
"The market is ignoring the Trump-Powell variance. If he really tries, the dollar could fall 4% in a week," – Deutsche Bank
We are about to enter the best time of the month for Forex. Those who get their timing wrong today will burn capital. Those who wait for the right signal can ride the trend arising from a predicted global crisis.

LONG EURUSD I am LONG on this pair at time of writing.
IT is important to adjust your paper profits NOT SO high that it will wipe you out and you need to restart at a higher buying price. Say you have 2 contracts and is in profits position, you can take 1 contract or 0.5 or 1.5 size and leave the remaining to run at breakeven SL position. That way, if you are riding on the market trend, then your remaining position be it 0.5 or 1.5 will still benefit and you can just accumulate as it trends up.
This works for me but may not be for everyone. Choose a strategy that fits you. Different folks, different strokes.

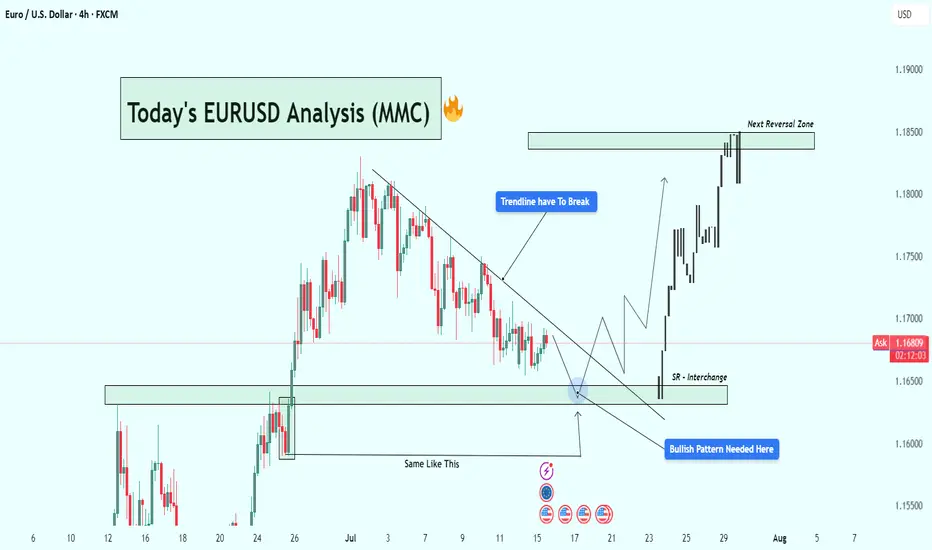
EURUSD Analysis : Eyes on Bullish Breakout Setup + Target🧭 Current Market Context:
The EURUSD pair is currently trading near 1.16765 on the 4H timeframe, displaying classic accumulation behavior at a key Support-Resistance Interchange Zone (SR Flip). After an extended bearish correction from the previous swing high, price has started compressing in a descending structure underneath a well-respected trendline. This tightening range near a historic support zone suggests that a major breakout could be on the horizon.
🧠 Technical Confluences:
🔹 1. Descending Trendline - Bearish Control Line:
The trendline drawn from the July highs has acted as a clear resistance line, rejecting multiple bullish attempts to break higher.
Price has failed to close above it on the 4H chart, showing sellers are still in control—but momentum is fading.
A breakout of this line is a crucial confirmation of buyer strength returning.
🔹 2. SR Flip Zone - Interchange Area:
This zone previously acted as resistance, capping the rally in June.
After price broke above it, the same area now acts as support, confirming its role as an SR flip zone—a textbook demand level.
Smart money often steps in at these interchange areas to accumulate long positions.
🔹 3. Re-accumulation Phase (Smart Money Behavior):
Market structure is showing a rounded bottom formation, hinting at possible absorption of sell-side liquidity.
Price action is compressing into the support zone, reducing volatility—a signal that a reversal or breakout is near.
The previous similar move ("Same Like This") from late June led to a strong bullish impulsive wave—this historical behavior adds confidence in the current bullish outlook.
🔹 4. Potential Bullish Pattern:
Price needs to develop a bullish reversal pattern (e.g., inverse head & shoulders, bullish engulfing, or a sweep of the low with rejection).
Only then will the setup be validated. This is not a blind buy zone, but a zone of interest for high-probability longs if price confirms.
🧨 Trade Plan Scenarios:
✅ Scenario 1 - Confirmation Breakout:
Wait for a clean breakout above the descending trendline.
Enter on breakout + retest structure.
Target the next major reversal zone at 1.18500.
🐢 Scenario 2 - Early Long Entry:
Enter on bullish confirmation (engulfing, pin bar, etc.) at the SR Interchange zone.
Stop loss below the support box.
Ride early for better R:R if the breakout confirms.
❌ Invalidation:
A clean breakdown below 1.1600 with momentum will invalidate the bullish bias.
In that case, reevaluate based on new structure.
📊 Projected Path:
If the trendline breaks, expect a bullish rally toward the next major resistance zone (1.18500).
That zone has historically acted as a major reversal and profit-taking level for bulls, and we expect price to react again if tested.
🔍 Macro View (Optional Insight):
USD may show weakness due to macro data (CPI/FED talks), helping EURUSD lift.
Eurozone data stability could further fuel demand for EUR.
📌 Final Thoughts:
This EURUSD setup is forming at a high-value area, backed by technical structure, historical behavior, and smart money positioning. If the price reacts positively from this zone and breaks the descending trendline, it could trigger a bullish leg toward 1.18500, offering a rewarding risk-to-reward opportunity for both swing and short-term traders.
Stay patient. Let the market confirm the direction before execution. 📈
EURUSD Good buy opportunityTime to buy EURUSD with CPI
EURUSD has broken the Trend Line liquidity and is ready to continue the upward trend.
EURUSD Bullish continuation supported 1.1640The EURUSD currency pair continues to exhibit a bullish price action bias, supported by a sustained rising trend. Recent intraday movement reflects a sideways consolidation breakout, suggesting potential continuation of the broader uptrend.
Key Technical Level: 1.1640
This level marks the prior consolidation range and now acts as pivotal support. A corrective pullback toward 1.1640 followed by a bullish rejection would reinforce the bullish trend, targeting the next resistance levels at:
1.1830 – Near-term resistance
1.1900 – Minor swing high
1.1940 – Longer-term bullish objective
On the other hand, a decisive daily close below 1.1640 would invalidate the bullish setup, shifting the outlook to bearish in the short term. This could trigger a deeper retracement toward:
1.1590 – Initial support
1.1530 – Key downside target
Conclusion:
As long as 1.1640 holds as support, the technical outlook remains bullish, favoring long positions on dips. A confirmed break below this level would signal a shift in sentiment and open the door to a corrective pullback phase.
This communication is for informational purposes only and should not be viewed as any form of recommendation as to a particular course of action or as investment advice. It is not intended as an offer or solicitation for the purchase or sale of any financial instrument or as an official confirmation of any transaction. Opinions, estimates and assumptions expressed herein are made as of the date of this communication and are subject to change without notice. This communication has been prepared based upon information, including market prices, data and other information, believed to be reliable; however, Trade Nation does not warrant its completeness or accuracy. All market prices and market data contained in or attached to this communication are indicative and subject to change without notice.

The Day AheadMacro Data Highlights
United States
June CPI – Crucial inflation gauge; likely to shape Fed rate expectations.
Empire Manufacturing Index (July) – Regional economic activity snapshot.
China
Q2 GDP – Key read on the health of the world’s second-largest economy.
June Retail Sales / Industrial Production / Home Prices – Important for tracking domestic demand and real estate trends.
Europe
Germany & Eurozone ZEW Surveys (July) – Investor sentiment indicators, especially relevant amid sluggish European growth.
Eurozone May Industrial Production – Tracks output momentum in manufacturing-heavy economies.
Italy May Government Debt – Sovereign debt level insights amid fiscal scrutiny.
Canada
June CPI – Important for BoC policy outlook.
Existing Home Sales / May Manufacturing Sales – Indicators of economic activity and housing market resilience.
Central Bank Speakers
Fed: Bowman, Barr, Collins, Barkin – Watch for comments on inflation and rate cut timing.
BoE: Governor Bailey – May impact GBP and UK rate expectations.
Earnings (Focus: Financials)
JPMorgan Chase, Wells Fargo, Citigroup, Bank of New York Mellon, BlackRock
Q2 results will offer insights into:
Net interest income trends
Credit quality & loan growth
Capital market activity (BlackRock focus on AUM and inflows)
Trading Takeaway
U.S. CPI and bank earnings are the top market movers – inflation print could shift rate cut expectations for September.
China data may influence commodity and EM sentiment.
Fed/BoE speakers may provide policy clarity amid disinflationary trends.
Financials earnings will be key to market tone, especially for value stocks and financial sector ETFs.
This communication is for informational purposes only and should not be viewed as any form of recommendation as to a particular course of action or as investment advice. It is not intended as an offer or solicitation for the purchase or sale of any financial instrument or as an official confirmation of any transaction. Opinions, estimates and assumptions expressed herein are made as of the date of this communication and are subject to change without notice. This communication has been prepared based upon information, including market prices, data and other information, believed to be reliable; however, Trade Nation does not warrant its completeness or accuracy. All market prices and market data contained in or attached to this communication are indicative and subject to change without notice.

EURUSD: Move Up Expected! Long!
My dear friends,
Today we will analyse EURUSD together☺️
The market is at an inflection zone and price has now reached an area around 1.16869 where previous reversals or breakouts have occurred.And a price reaction that we are seeing on multiple timeframes here could signal the next move up so we can enter on confirmation, and target the next key level of 1.16975.Stop-loss is recommended beyond the inflection zone.
❤️Sending you lots of Love and Hugs❤️
EURUSD SEEMS TO FIND SUPPORT
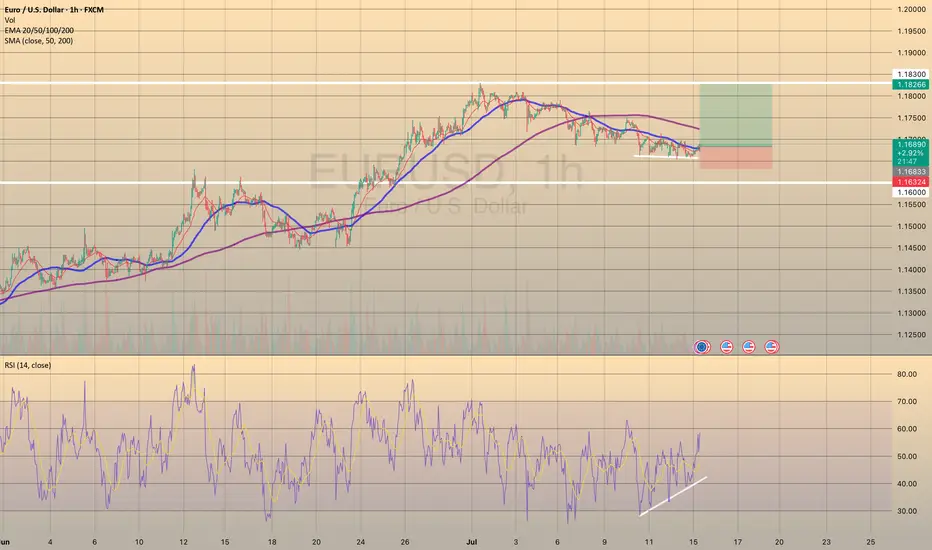
TRADING IDEA UPDATE - EURUSD SEEMS TO FIND SUPPORT🦾
EURUSD seems to find support on a trendline and shows us divergence on RSI on 1-h timeframe. So, I decided to close my trade in advance before my stop loss gets triggered and open long position with a
🔼 a market buy order at 1.16833 with
❌a stop loss at 1.16324 and
🤑a take profit at 1.18266
Additionally, today is the U.S. CPI report data coming out. Market expects the annual inflation to be around 2.7%. Me, personally, think that actual June inflation will be a bit lower, which may provide some fundamental support to the EURUSD. Will see.
15.07.25 Morning ForecastPairs on Watch -
FX:EURUSD
CAPITALCOM:DE40
FX:EURGBP
FX:GBPJPY
A short overview of the instruments I am looking at for today, multi-timeframe analysis down to what I will be looking at for an entry. Enjoy!

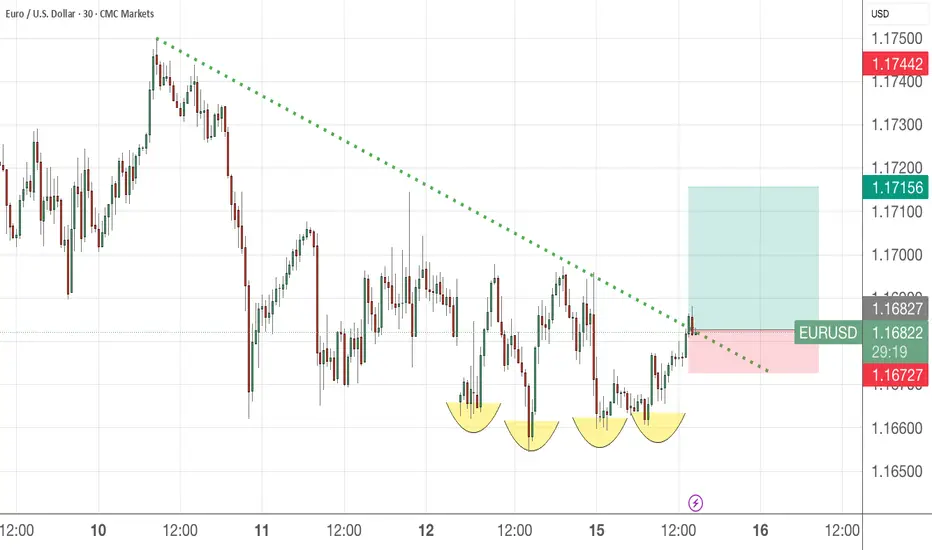
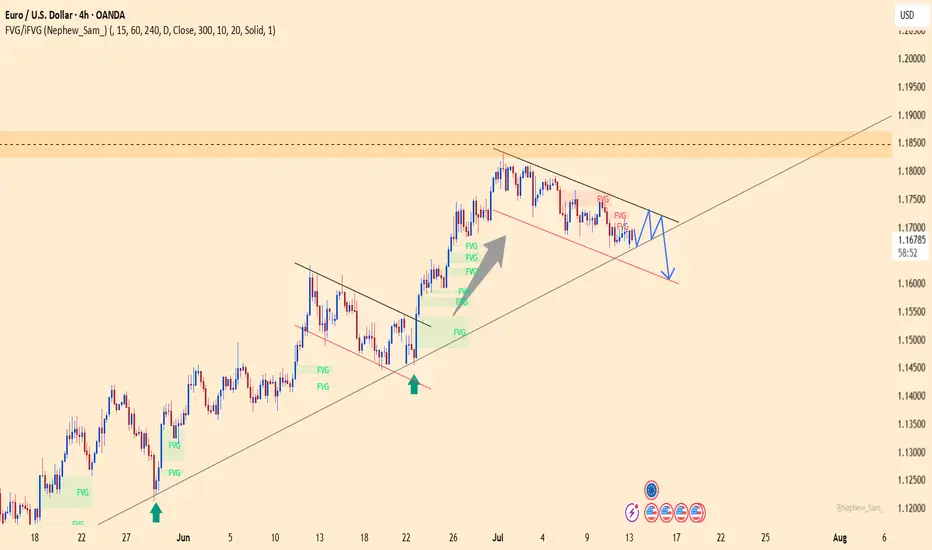
Eurousd techinical analysis.This chart shows the EUR/USD currency pair on a 1-hour timeframe. Here's a breakdown of the key technical elements:
Key Features:
1. Purple Zones (Rectangles):
Top Rectangle (~1.1695 - 1.1700): Resistance zone.
Bottom Rectangle (~1.1660): Support zone.
2. Pink Descending Trendline:
Represents a downtrend or dynamic resistance.
Price recently approached or tested this trendline from below.
3. Yellow Zigzag and Arrow:
Illustrates potential price movement—an anticipated rejection from the trendline and a move down toward support.
4. Current Price:
1.16858, sitting just below the trendline and within the resistance zone.
---
Interpretation:
Bearish Bias: The chart suggests a potential short opportunity if the price fails to break

Important News for EURUSDYesterday, EURUSD continued moving sideways as the market waits for upcoming news.
Today at 1:30 PM London time, U.S. inflation data will be released.
This report has a strong impact and is likely to set the next direction for the pair.
It’s advisable to reduce your risk and avoid opening new positions before the news comes out.
The goal is to follow the trend once it resumes!

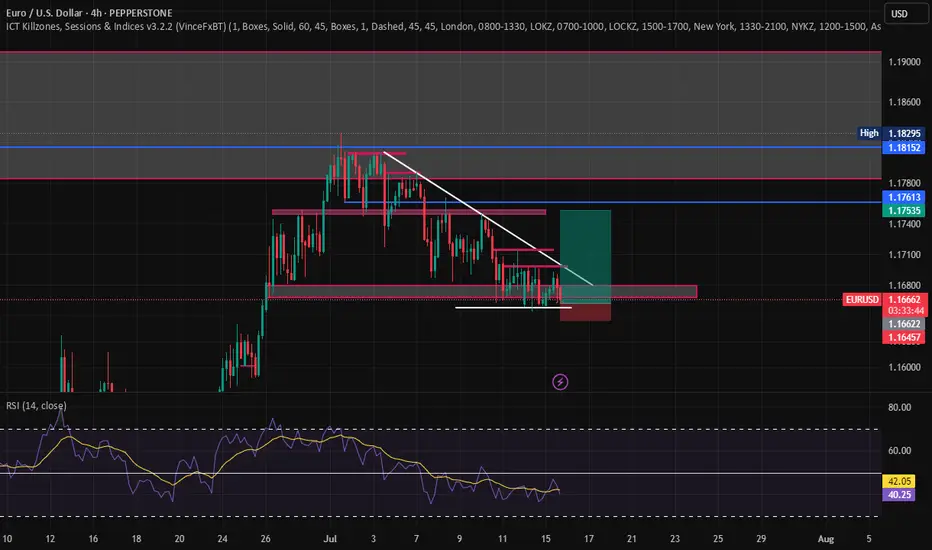
EURUSD – Bearish Pressure Mounts Ahead of Triangle Breakout EURUSD is trading within a contracting triangle and currently leans toward a bearish bias. After several failed attempts to break the upper boundary, momentum is weakening, and the pair is showing signs of a potential breakdown toward lower support levels.
With several key events ahead, the euro may face additional pressure if upcoming Eurozone inflation data disappoints or if the Fed maintains a hawkish tone through upcoming speeches by U.S. officials. Unless there is a strong bullish catalyst, EURUSD is likely to correct further to the downside.
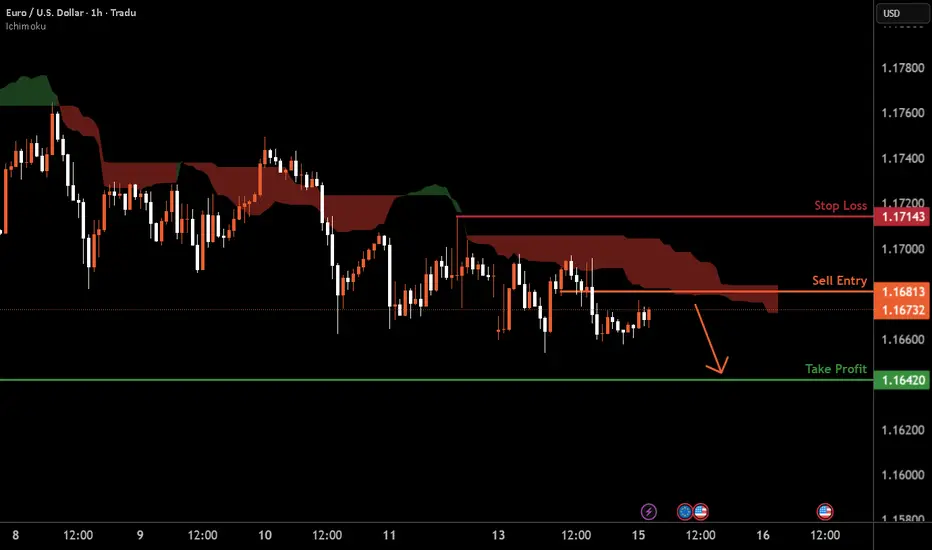
EURUSD H1 I Bearish Reversal Based on the H1 chart analysis, we can see that the price is rising toward our sell entry at 1.1681, which is a pullback resistance.
Our take profit will be at .1642, an overlap support level.
The stop loss will be placed at 1.1714, a swing-high resistance level.
High Risk Investment Warning
Trading Forex/CFDs on margin carries a high level of risk and may not be suitable for all investors. Leverage can work against you.
Stratos Markets Limited (tradu.com ):
CFDs are complex instruments and come with a high risk of losing money rapidly due to leverage. 63% of retail investor accounts lose money when trading CFDs with this provider. You should consider whether you understand how CFDs work and whether you can afford to take the high risk of losing your money.
Stratos Europe Ltd (tradu.com ):
CFDs are complex instruments and come with a high risk of losing money rapidly due to leverage. 63% of retail investor accounts lose money when trading CFDs with this provider. You should consider whether you understand how CFDs work and whether you can afford to take the high risk of losing your money.
Stratos Global LLC (tradu.com ):
Losses can exceed deposits.
Please be advised that the information presented on TradingView is provided to Tradu (‘Company’, ‘we’) by a third-party provider (‘TFA Global Pte Ltd’). Please be reminded that you are solely responsible for the trading decisions on your account. There is a very high degree of risk involved in trading. Any information and/or content is intended entirely for research, educational and informational purposes only and does not constitute investment or consultation advice or investment strategy. The information is not tailored to the investment needs of any specific person and therefore does not involve a consideration of any of the investment objectives, financial situation or needs of any viewer that may receive it. Kindly also note that past performance is not a reliable indicator of future results. Actual results may differ materially from those anticipated in forward-looking or past performance statements. We assume no liability as to the accuracy or completeness of any of the information and/or content provided herein and the Company cannot be held responsible for any omission, mistake nor for any loss or damage including without limitation to any loss of profit which may arise from reliance on any information supplied by TFA Global Pte Ltd.
The speaker(s) is neither an employee, agent nor representative of Tradu and is therefore acting independently. The opinions given are their own, constitute general market commentary, and do not constitute the opinion or advice of Tradu or any form of personal or investment advice. Tradu neither endorses nor guarantees offerings of third-party speakers, nor is Tradu responsible for the content, veracity or opinions of third-party speakers, presenters or participants.