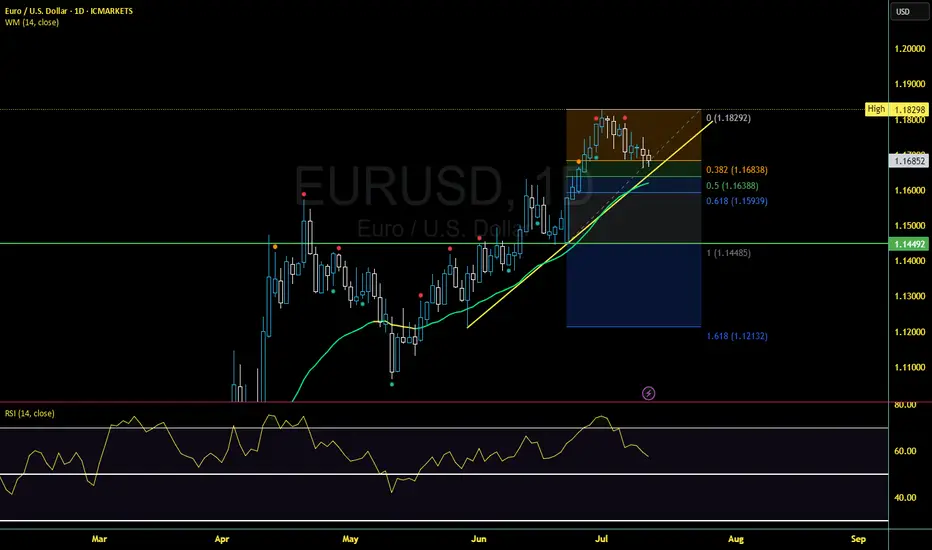
EURUSD Daily: More trouble ahead or ready to recover?The last Friday NY bearish closed sited at Fibo(38.2) and still showing a strong bullish move since last March we may see a bit more downward move to test the Fibo(50) at 1.16388 before start another bullish leg up again. While the price stays above the 1.5956 level I will look for any price action towards 1.18298 but with all chaos caused by this tariff war we need to be careful.
As a technical reference, Resistance at 1.182998, Support at 1.14522 and RSI(14) at 58 that seems to be heading to test the 50 level.
USDEUR trade ideas
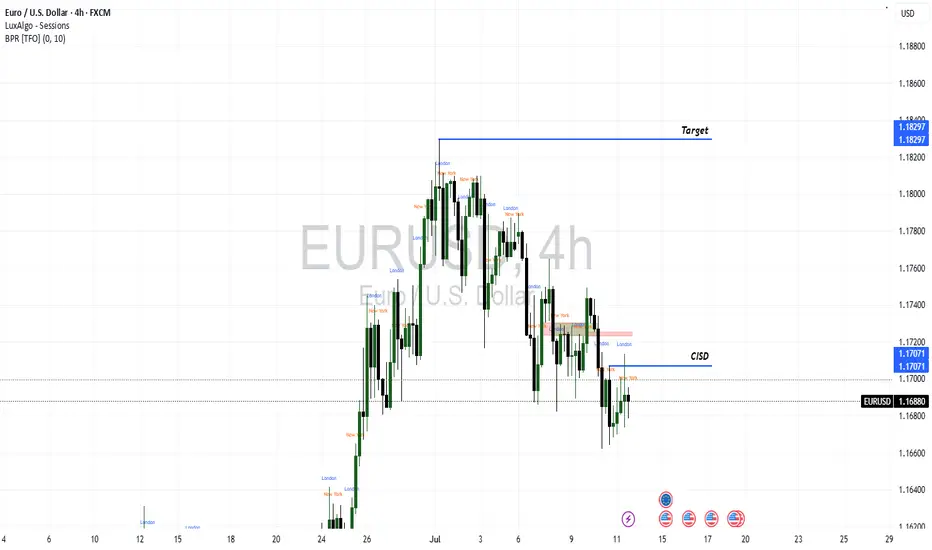
EURUSD Trade idea for 14th - 118th July 2025For next week, I am expecting bullish moves on EURUSD with a target at 1.18297. The trigger for this trade will be a CISD at 1.17071. I expect to cascade this trade with FVGs setups on the 4HR timeframe.
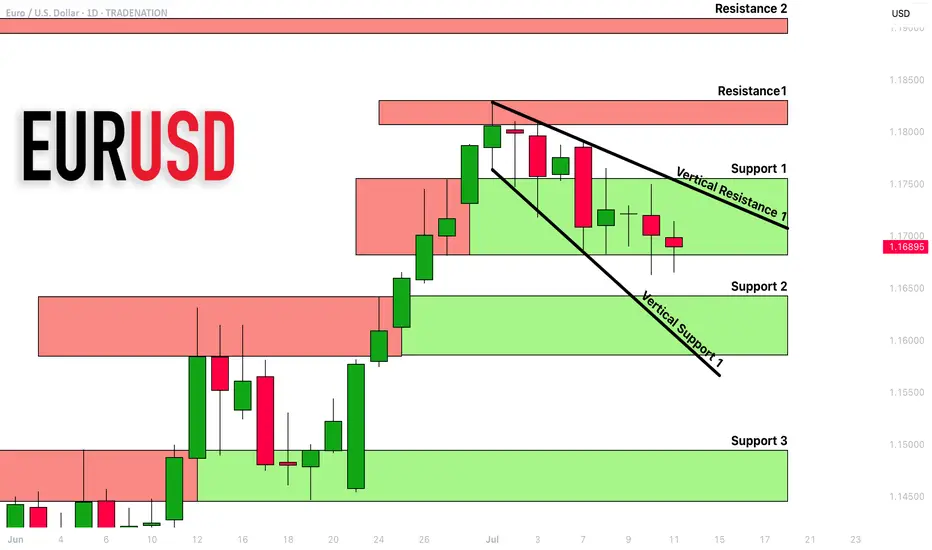
EURUSD: Detailed Support & Resistance Analysis 🇪🇺🇺🇸
Here is my latest structure analysis and important
supports and resistances for EURUSD for next week.
Consider these structures for pullback/breakout trading.
❤️Please, support my work with like, thank you!❤️
I am part of Trade Nation's Influencer program and receive a monthly fee for using their TradingView charts in my analysis.
What Are Bollinger Bands? How to use it.✅ What Are Bollinger Bands?
Bollinger Bands are a volatility-based technical analysis tool developed by John Bollinger. They consist of three lines:
1. Middle Band: 20-period Simple Moving Average (SMA)
2. Upper Band: Middle Band + 2 standard deviations
3. Lower Band: Middle Band - 2 standard deviations
The bands expand and contract based on price volatility.
📊 What Bollinger Bands Tell You
Contraction (Squeeze): Low volatility, possible breakout coming
Expansion: High volatility, breakout in progress or exhausted
Price Touches Band: Doesn’t mean reversal—it's a sign of strength or weakness
🎯 Mastering Strategies with Bollinger Bands
1. Bollinger Band Squeeze (Breakout Strategy)
Setup: Bands are very close together (low volatility)
Signal: Wait for breakout and volume spike
Action: Enter in direction of breakout
Tip: Combine with MACD or RSI for confirmation
> 🔍 Example: If the price breaks above the upper band with strong volume after a squeeze → potential long entry.
2. Mean Reversion (Reversal Strategy)
Setup: Price touches or exceeds upper/lower band
Signal: Look for RSI divergence, candlestick reversal patterns
Action: Fade the move back to the 20 SMA (mean reversion)
Tip: Works best in ranging markets
> ⚠️ Warning: Don’t short just because price touches the upper band. Look for confluence.
3. Trend Riding with Bands
Setup: Price rides upper/lower band
Signal: Pullbacks to the 20 SMA in a strong trend
Action: Enter on bounce near SMA if the trend is strong
Tip: Use higher timeframes to confirm the trend
> 🟢 In an uptrend, buy near the 20 SMA when price pulls back but doesn’t break lower band.
📌 Key Tips for Mastery
1. Adjust settings for asset/timeframe (e.g., crypto might need a 10 or 14 SMA)
2. Never use Bollinger Bands alone – combine with:
RSI (for overbought/oversold confirmation)
MACD (trend confirmation)
Volume (for breakout confirmation)
3. Use multiple timeframes – e.g., 4H for trend, 15m for entry
4. Avoid chasing band breakouts without confirmation
5. Backtest strategies with your preferred asset
🧠 Advanced Concepts
Double Bottoms Outside Band: When price forms a W-bottom with the second low outside the lower band bullish reversal setup.
Walking the Band: In strong trends, price can "walk" along the band don’t fade too early.
Band Width: Track the width of bands to detect upcoming breakouts.
⚠️ Disclaimer
This guide is for educational purposes only and does not constitute financial advice. Trading involves risk, and past performance does not guarantee future results. Always do your own research (DYOR) and consult with a financial advisor before making any investment decisions.

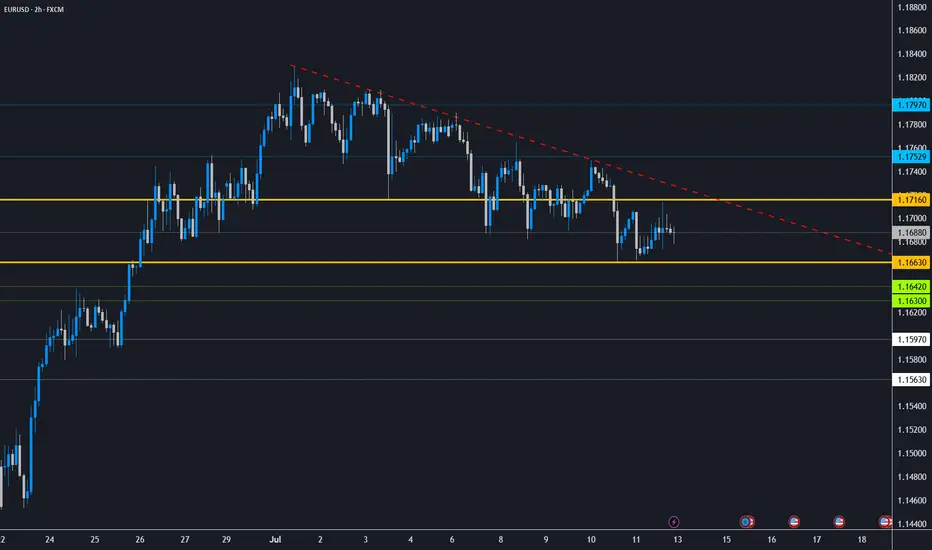
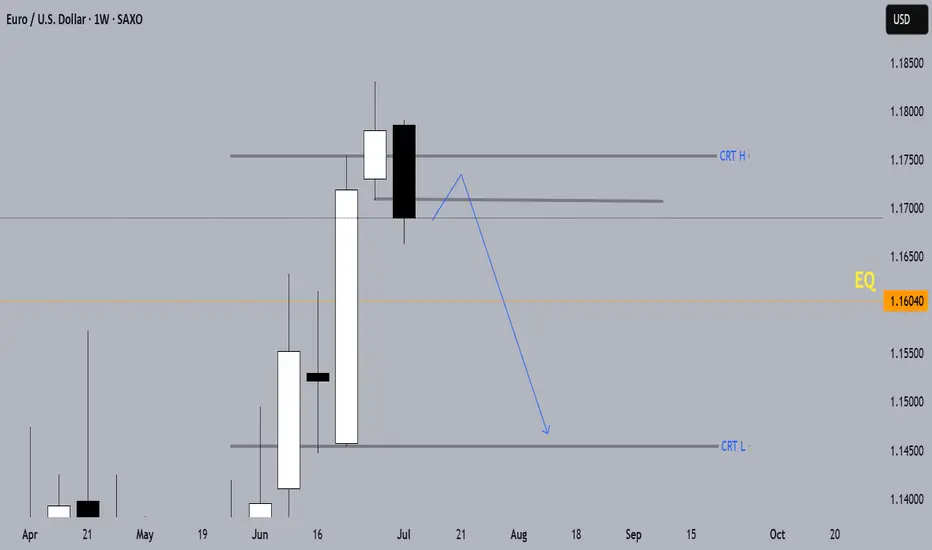
EUR/USD - Potential TargetsDear Friends in Trading,
How I see it,
PIVOT AREA @ 1.16630 - 1.17160
1) Rangebound at this time between support and resistance.
2) We need a strong breach above or below PIVOT area.
Keynote:
1.16420 - 1.16300 = 50% retracement area from
23rd of June on 1D Time Frame Correction path.
I sincerely hope my point of view offers a valued insight.
Thank you for taking the time to study my analysis.
continue example 1 how to identify direction of the marketeurussd replicated on w d 4 Today 1220254
join the bullies

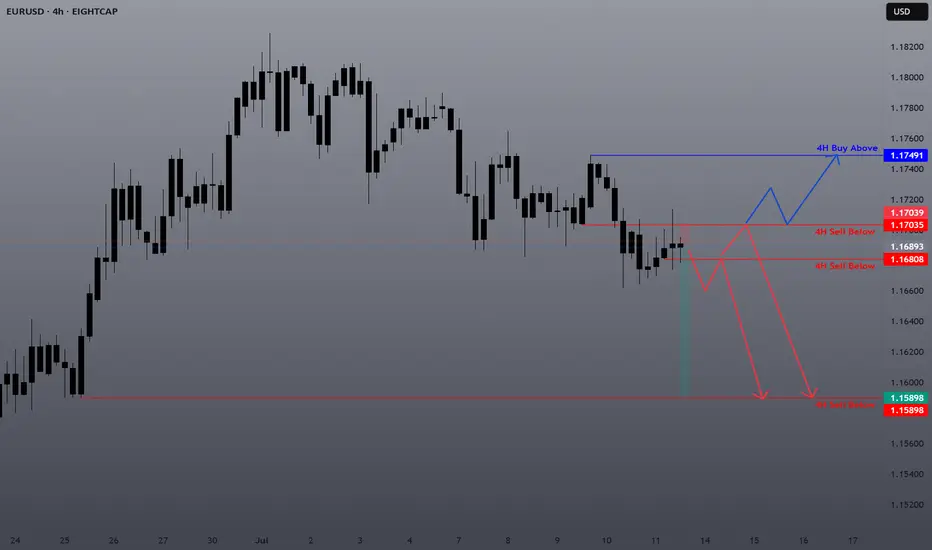
EURUSDEURUSD appears to be running SSL. 4H levels identified. Looking for Break & retest. If support does not hold on to any level, expect the bulls to return and take over.
EURUSD EU has been bearish from last week as we can see..
We expect further drop from next week after a small rally to to resistance
I will update the analysis depending on price action ..
Kindly and support for and follow more setups
direction example 1 finding directionbullish mostly
market reading saturday 12 25
2 ways to identify which direction its going

EURUSD - Still Orderflow remains bearishLooking at EU. The 1H Orderflow is still maintaining that bearish intent. My area is set now for where i want to take a potential sell to the downside seeing as everything else is pretty much mitigated.
The only issue with this potential sell of is that we never really had a sweep of liquidity before we rolled over and moved to the downside.
We do have a level of inducement before our POI but i think in an ideal world i would love to see us build up a bit more liquidity before the POI just to induce the early sellers before making that move to the downside.
For now. On the lower TF's i will be looking to take short term long positions back up to our POI before looking for the longer terms short. to our 4H POI in which i will be looking to get long once again.
Any questions feel free to give me a message

EUR/USD Falling Wedges Forming. Breakout Expected?Hello Traders,
Falling wedges can be seen in Eurusd chart and price is expected to breakout.
Wait for the price to break 1.17229 to go long or if it breaks below 1.1629 consider short.
This analysis is solely based on chart patterns and some indicators like MACD, RSI and Moving Averages.

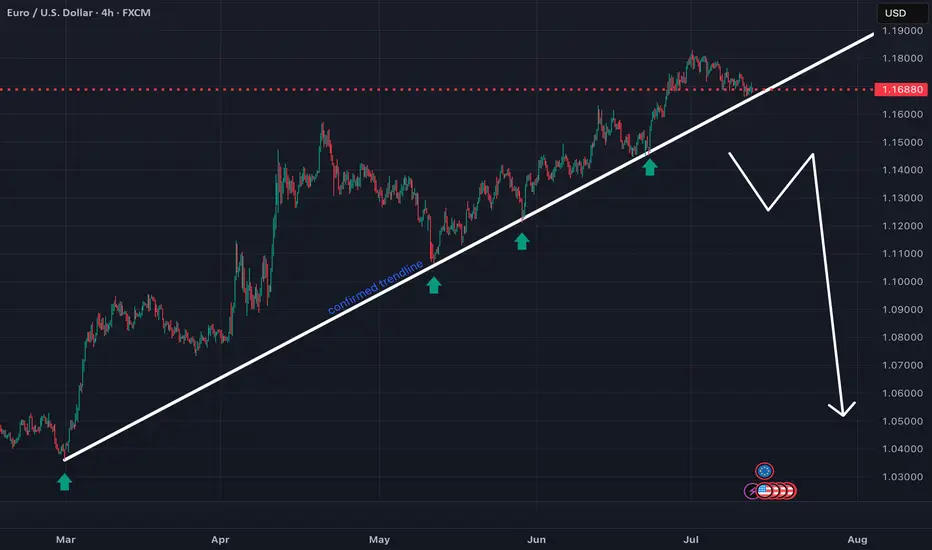
Potential Sell Opportunity on EURUSDReasons I think this pair will fall:
- Bearish RSI Divergence on Daily chart
-RSI overbought on H4 and Daily
What are your thoughts?
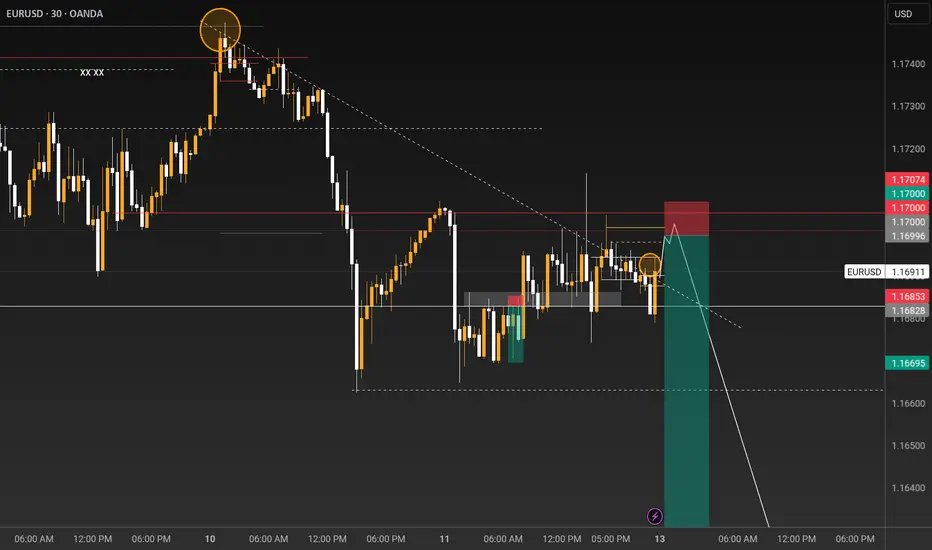
EURUSD 13/7/25
HTF still in buy mode
Expecting price to make a little pullback
Ride buying trend if key is happening in buy zone
Euro DollaroThe Euro is close to resistance, represented by the bullish equilibrium orbit in the 1.192 area. A break of the resistance would project prices to the 1.22 area to be realised by 25/08/2025.
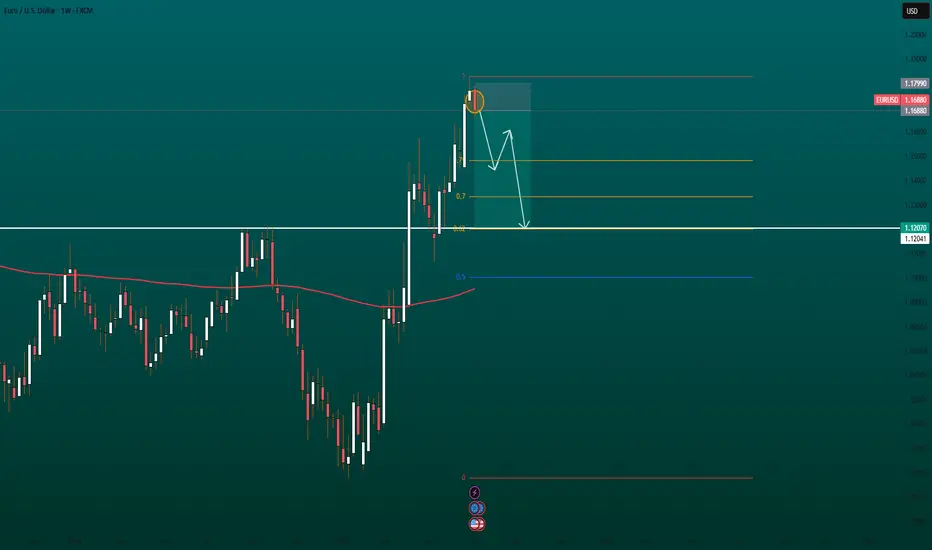
EURUSD WEEKLY LOOKING FOR SELLS🔹 Bearish divergence on indicators suggests that the bullish momentum is weakening.
🔹 A reversal has formed near a key Fibonacci time zone, indicating the potential beginning of a corrective move.
🔹 Price is rejecting from the intersection of a channel line and a strong Fibonacci retracement level, reinforcing the case for a possible downward reversal.
EURUSD Trading Opportunity! BUY!
My dear subscribers,
This is my opinion on the EURUSD next move:
The instrument tests an important psychological level 1.1689
Bias - Bullish
Technical Indicators: Supper Trend gives a precise Bullish signal, while Pivot Point HL predicts price changes and potential reversals in the market.
Target - 1.1748
My Stop Loss - 1.1659
About Used Indicators:
On the subsequent day, trading above the pivot point is thought to indicate ongoing bullish sentiment, while trading below the pivot point indicates bearish sentiment.
Disclosure: I am part of Trade Nation's Influencer program and receive a monthly fee for using their TradingView charts in my analysis.
———————————
WISH YOU ALL LUCK
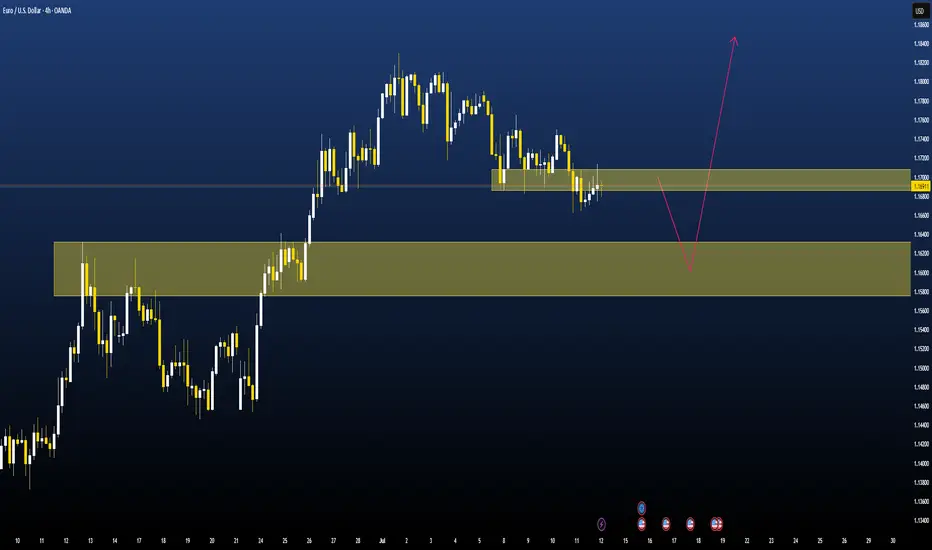
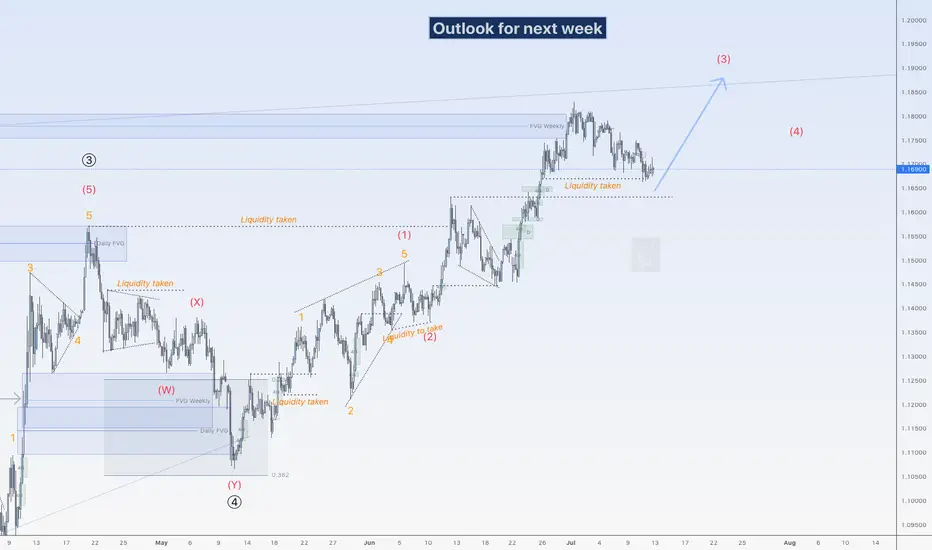
Up again for EUHi traders,
Last week EU went exactly as I've said in my outlook.
It slowly went down to take the liquidity.
Next week we could see price reverse from the Daily FVG below and start the next impulsive wave up.
Let's see what the market does and react.
Trade idea: Wait for the finish of the correction down and a change in orderflow to bullish on a lower time frame to trade longs.
If you want to learn more about trading with FVG's, liquidity sweeps and Wave analysis, then make sure to follow me.
This shared post is only my point of view on what could be the next move in this pair based on my technical analysis.
Don't be emotional, just trade your plan!
Eduwave
EUR/USD – Daily Bias (as of July 12, 2025)Current Structure:
EUR/USD is in a bearish market structure on the Daily.
The pair has been making lower highs and lower lows
Most recent daily candles show lower wicks and weak bullish closes, indicating sell pressure remains.
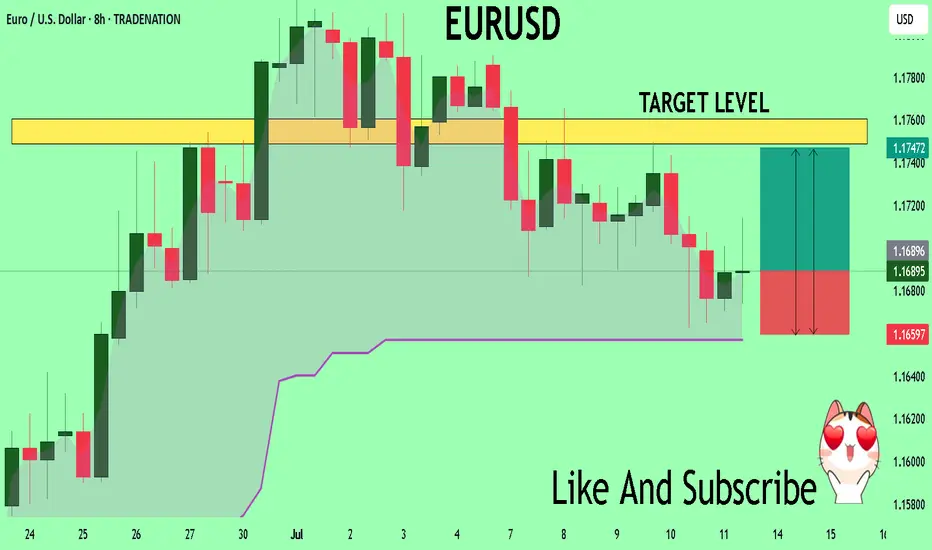
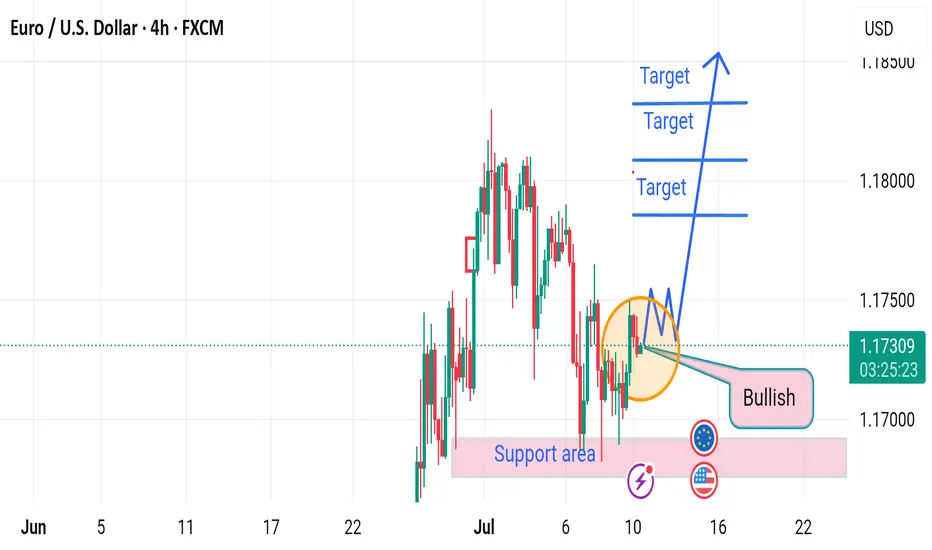
EURUSD H4 RISES 🔄 Disrupted EUR/USD Analysis (4H)
📉 Current Structure:
Price is hovering around 1.17298, showing hesitation at the resistance of a potential bearish flag.
While the chart labels this zone as “bullish,” there are signs of market indecision, possibly a fakeout trap.
⚠️ Key Disruptions:
1. Bullish Trap Risk:
The price formed a short-term M-pattern (double top inside the orange circle), indicating bearish exhaustion rather than continuation.
The expected breakout to the upside may fail if bulls don’t sustain volume.
2. Support Area Weakness:
The support zone around 1.17000 has been tested multiple times. If it breaks, it could turn into a strong resistance, flipping the sentiment.
3. Macro Influence:
Upcoming EUR and USD economic events (noted by icons) could cause high volatility and break structure unexpectedly.
A strong USD report could reverse bullish momentum, sending EUR/USD toward 1.16500 or lower.
4. Bearish Continuation Scenario:
If the market breaks down from the current consolidation, expect targets at:
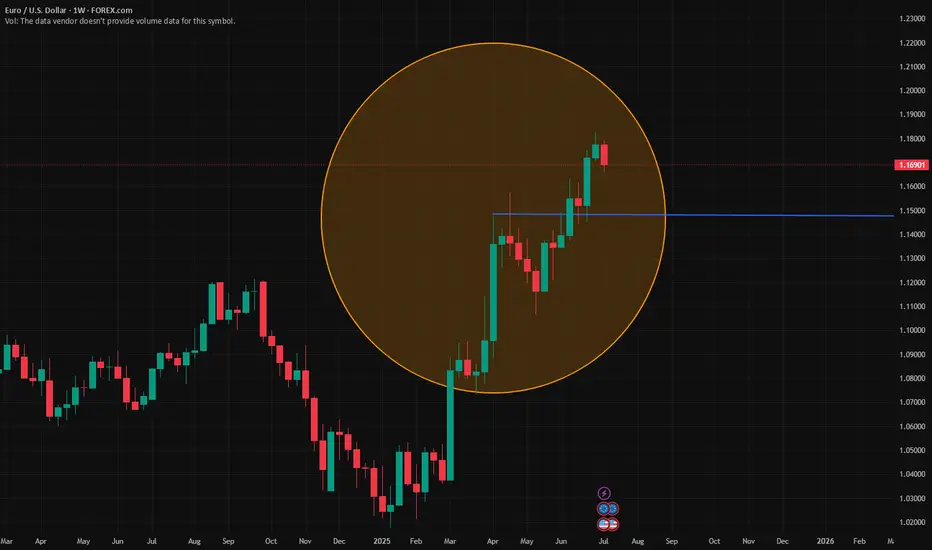
HTF analysis for EurUsdFollowing simple Ict concepts, we can see that EU has respected the higher time frames PD array.
Following the trend as price seems to be "drawn" to premium towards the D1 FVG area.
we can expect to see price fill that PD array around the 1.20800 area

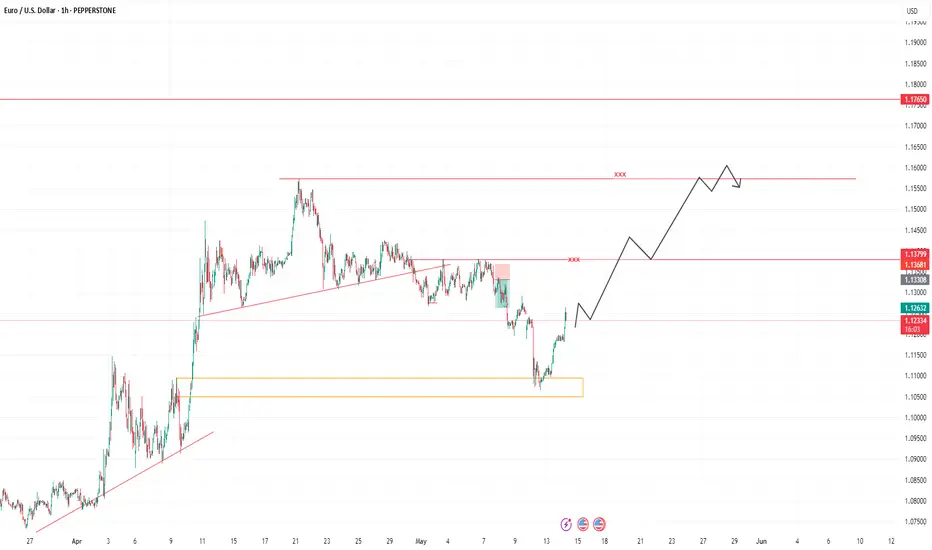
EURUSD NEW HIGHS?The 1h timeframe reminds me of this book, LIQUIDITY AND MANIPULATION.
"The markets need to generate liquidity in order to move, so if liquidity isn´t
already there, it will be created. So when new traders come in to forex and
learn about it for the first time, what they usually do is gonna be retail based
trading.
So support and resistance, chart patterns which are extremely popular in the
industry, and things of that nature.
So what some brokers do is they offer free education for their clients once we
start trading. Now this education will usually be retail methods support and
resistance. "
Thanks for this idea.
here is the chart relative to this, see the price above it will clear?
I have more on this kind of idea.
This is not a financial advice.
Follow for more .
trade it or see it.
Goodluck
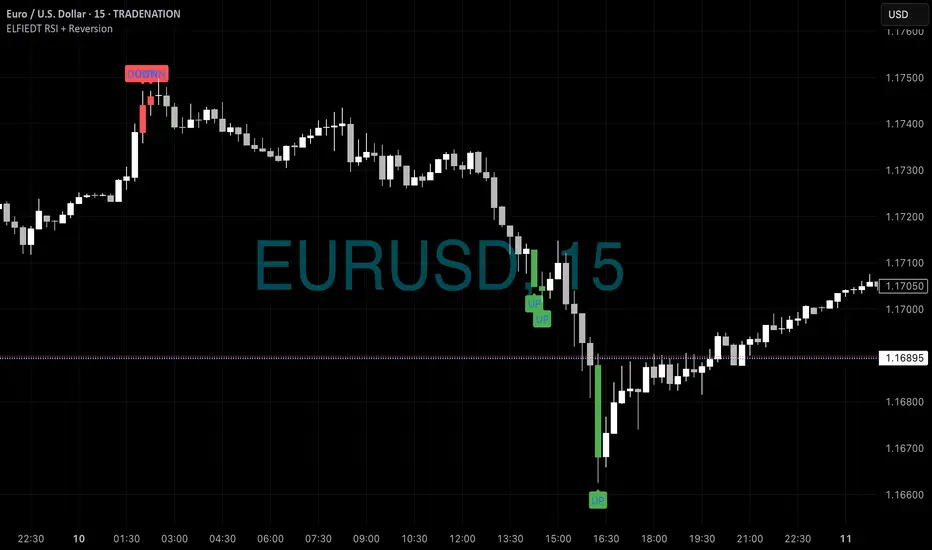
EU - Shorts into Longs📊 EURUSD 15min – Reversal Both Ways: Sell the Top, Buy the Bottom
🔄 Complete Cycle Coverage | Precision Short & Long | Real-Time Edge
This EURUSD chart is a textbook example of how the ELFIEDT RSI + Reversion system captures both ends of the market — printing a clean DOWN signal at the high, followed by multiple stacked UP signals at the low.
🔻 High-Precision Short Signal
At the early session high, a lone DOWN signal was printed at 01:45 — just as price peaked before entering a persistent downtrend.
🔹 Hypothetical Trade Idea:
Entry: Short at the close of the red DOWN candle
Stop-loss: Just above the signal candle’s high
Reward: Price dropped more than 60 pips before stabilizing
🟢 Strong Bottom Reversal with Triple Confirmation
After the sustained decline, the indicator printed three consecutive UP signals starting around 15:00 — catching the bottom of the selloff with minimal further downside.
🔹 Hypothetical Trade Idea:
Entry: After the last UP signal prints (aggressive traders could scale in earlier)
Stop-loss: Below the signal wick
Reward: Immediate reversal led to a steady move up into the next session
This setup offered a second high-probability opportunity, demonstrating the system’s strength in both directions.
🧠 What This Shows
The ELFIEDT system isn’t reactive. It pre-empts exhaustion, spotting the true shift in sentiment before traditional indicators catch on.
📣 Public Release – Limited Scope Only
This is a basic public version of the ELFIEDT RSI + Reversion engine.
🚀 Advanced versions include:
Multi-symbol confluence
Divergence overlays
Trendline breakouts
Re-entry logic
Institutional filter layers
📬 DM to apply for premium access — strictly invite-only.
#EURUSD #ForexSignals #MeanReversion #ReversalTrading #SmartForexTools #ELFIEDT #15MinuteChart #FXPrecision #TradingView
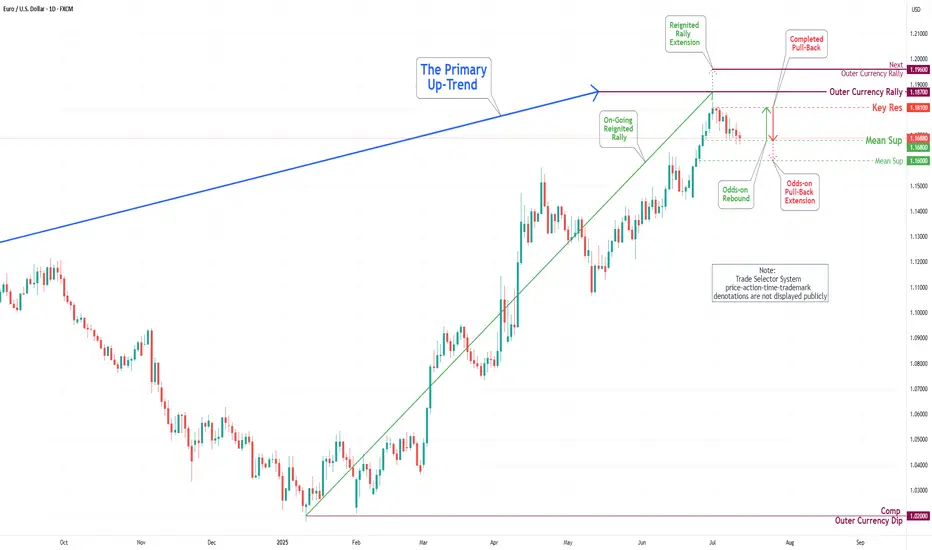
EUR/USD Daily Chart Analysis For Week of July 11, 2025Technical Analysis and Outlook:
In this week's trading session, as expected, the Euro continued its decline, reaching our Mean Support level of 1.168. Recent analyses suggest that the Euro is likely to experience a further downward trend, with the next target set at the Mean Support level of 1.160. However, it's essential to consider the possibility of a rebound toward the Key Resistance level of 1.181, which could lead to the completion of an Outer Currency Rally reaching 1.187.