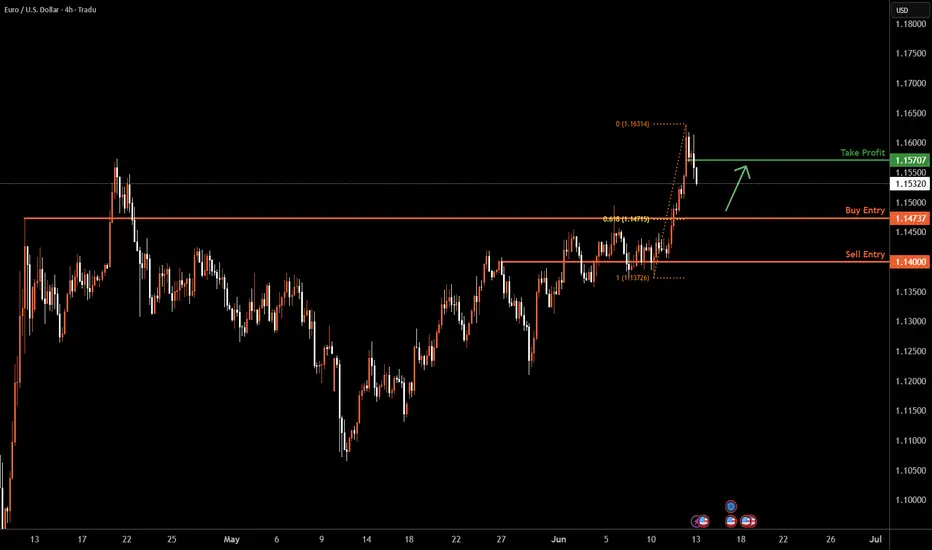
EURUSD H4 I Bullish Bounce OffBased on the H4 chart analysis, we can see that the price is falling toward our buy entry at 1.14737, which is a pullback support that aligns with the 61.8% Fib retracement.
Our take profit will be at 1.1570, which is a pullback resistance level.
The stop loss will be placed at 1.1400, an overlap support.
High Risk Investment Warning
Trading Forex/CFDs on margin carries a high level of risk and may not be suitable for all investors. Leverage can work against you.
Stratos Markets Limited (tradu.com ):
CFDs are complex instruments and come with a high risk of losing money rapidly due to leverage. 63% of retail investor accounts lose money when trading CFDs with this provider. You should consider whether you understand how CFDs work and whether you can afford to take the high risk of losing your money.
Stratos Europe Ltd (tradu.com ):
CFDs are complex instruments and come with a high risk of losing money rapidly due to leverage. 63% of retail investor accounts lose money when trading CFDs with this provider. You should consider whether you understand how CFDs work and whether you can afford to take the high risk of losing your money.
Stratos Global LLC (tradu.com ):
Losses can exceed deposits.
Please be advised that the information presented on TradingView is provided to Tradu (‘Company’, ‘we’) by a third-party provider (‘TFA Global Pte Ltd’). Please be reminded that you are solely responsible for the trading decisions on your account. There is a very high degree of risk involved in trading. Any information and/or content is intended entirely for research, educational and informational purposes only and does not constitute investment or consultation advice or investment strategy. The information is not tailored to the investment needs of any specific person and therefore does not involve a consideration of any of the investment objectives, financial situation or needs of any viewer that may receive it. Kindly also note that past performance is not a reliable indicator of future results. Actual results may differ materially from those anticipated in forward-looking or past performance statements. We assume no liability as to the accuracy or completeness of any of the information and/or content provided herein and the Company cannot be held responsible for any omission, mistake nor for any loss or damage including without limitation to any loss of profit which may arise from reliance on any information supplied by TFA Global Pte Ltd.
The speaker(s) is neither an employee, agent nor representative of Tradu and is therefore acting independently. The opinions given are their own, constitute general market commentary, and do not constitute the opinion or advice of Tradu or any form of personal or investment advice. Tradu neither endorses nor guarantees offerings of third-party speakers, nor is Tradu responsible for the content, veracity or opinions of third-party speakers, presenters or participants.
USDEUX trade ideas
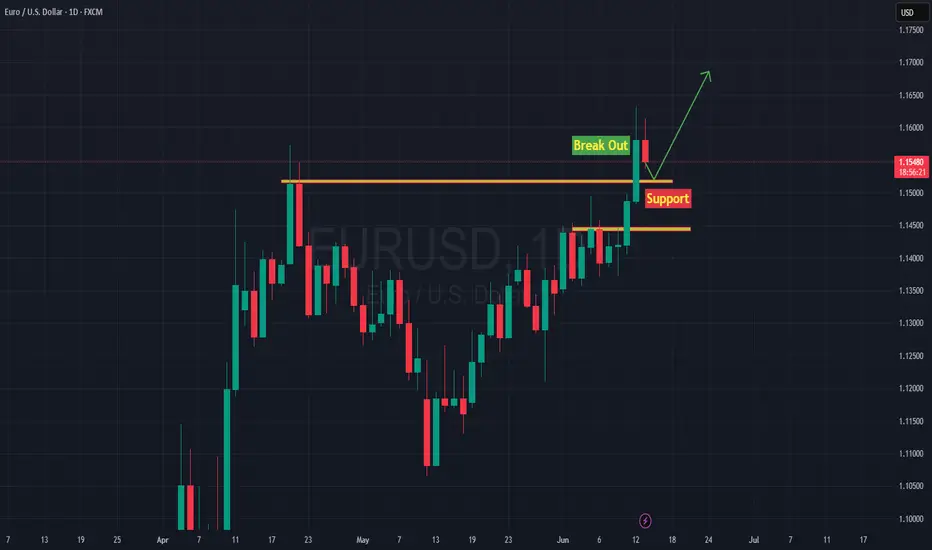
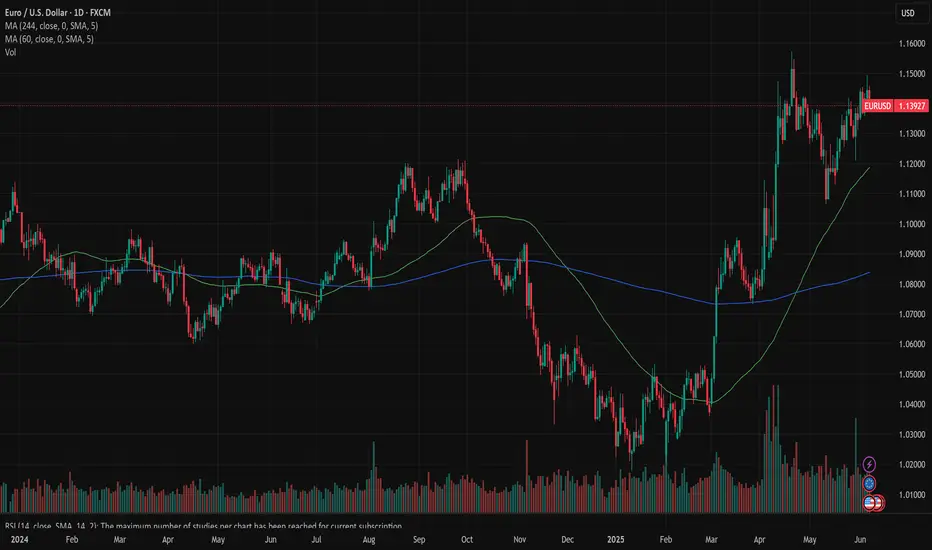
EU Daily Chart AnalysisEU Daily Chart Analysis
In D1 Chart, clearly the break out candle is huge and waiting to retest the area to Buy opportunity again
EURUSD, GBPUSD & EURGBP analysisHere's my outlook on the 3 pairs mentioned in the title. Looking for more upside momentum after we have some sort of pullback into the premium discount prices.
Once we get some15min bearish internal orderflow on the lower Time Frames I will look to enter short term sell positions before looking to take longer term buys on the way back up.
Again, if I can be of any assistance please do let me know and I will be happy to help where I can.

EURUSD: Breakout and Potential RetraceHey Traders, in today's trading session we are monitoring EURUSD for a selling opportunity around 1.14200 zone, EURUSD was trading in an uptrend and successfully managed to break it out. Currently is in a correction phase in which it is approaching the retrace area at 1.14200 support and resistance zone.
Trade safe, Joe.
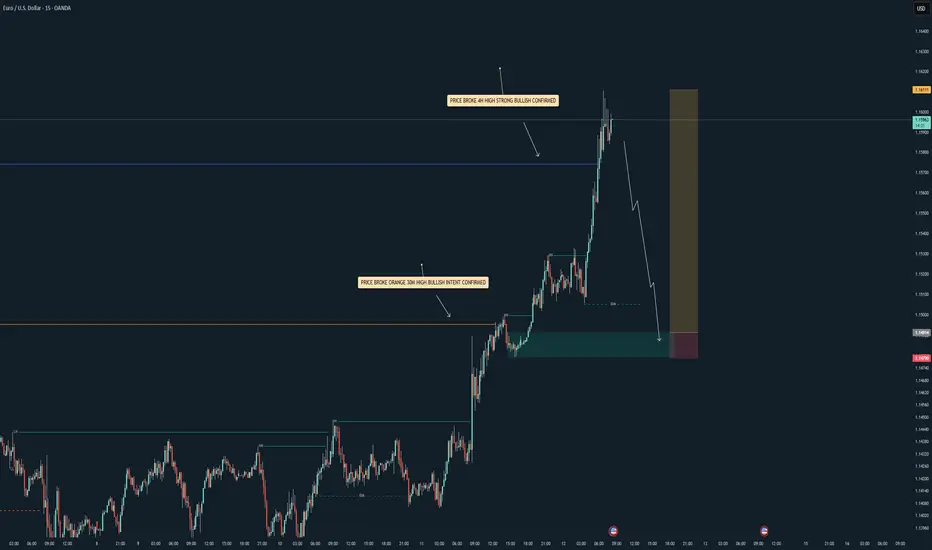
EU| Workflow - End of Week but Still in SyncPrice still pushing with strong bullish conviction, so I’m just flowing with it and waiting on that precision entry — nothing forced, just discipline and patience.
Even though we’re nearing the end of the week, the workflow and higher timeframe analysis still align, so I’m staying ready. I’ve got my zones mapped out and I’m watching for price to pull back into that green zone POI. Once that mitigation happens, I’ll drop to the 1M for the structure shift and look for that 5M LH break to confirm my entry.
Just letting the setup mature and keeping emotions out of the way. 📊
Always open to hearing how others are viewing EU right now — let’s elevate the convo while we wait on the market to give us the greenlight. 🎯
#SMC #EU #SmartMoney #TopDownPrecision #InducementKing #JuicemannnStyle #ForexFlow #EndOfWeekExecution
Bless Trading!
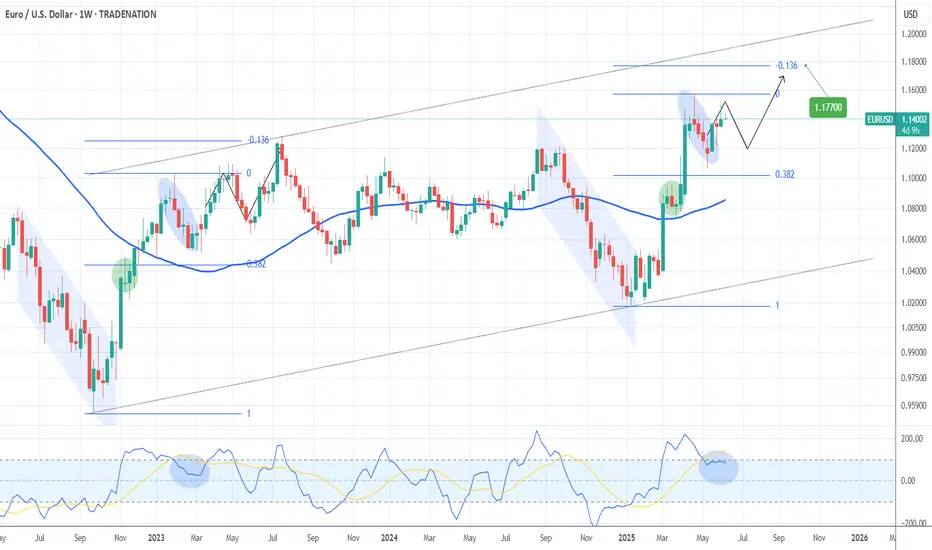
EURUSD Buy the next dip and target 1.17700The EURUSD pair has been trading within a Channel Up pattern and is currently on its 2nd Bullish Leg that hasn't yet been completed.
It does print an identical price action to the 1st Bullish Leg of the pattern, having already made its first pull-back near the 0.382 Fibonacci retracement level and is now rising for the 2nd rejection.
Our plan is to buy the next dip and target 1.17700, which is the -0.136 Fibonacci extension, the level where the 1st Bullish Leg topped.
-------------------------------------------------------------------------------
** Please LIKE 👍, FOLLOW ✅, SHARE 🙌 and COMMENT ✍ if you enjoy this idea! Also share your ideas and charts in the comments section below! This is best way to keep it relevant, support us, keep the content here free and allow the idea to reach as many people as possible. **
-------------------------------------------------------------------------------
Disclosure: I am part of Trade Nation's Influencer program and receive a monthly fee for using their TradingView charts in my analysis.
💸💸💸💸💸💸
👇 👇 👇 👇 👇 👇
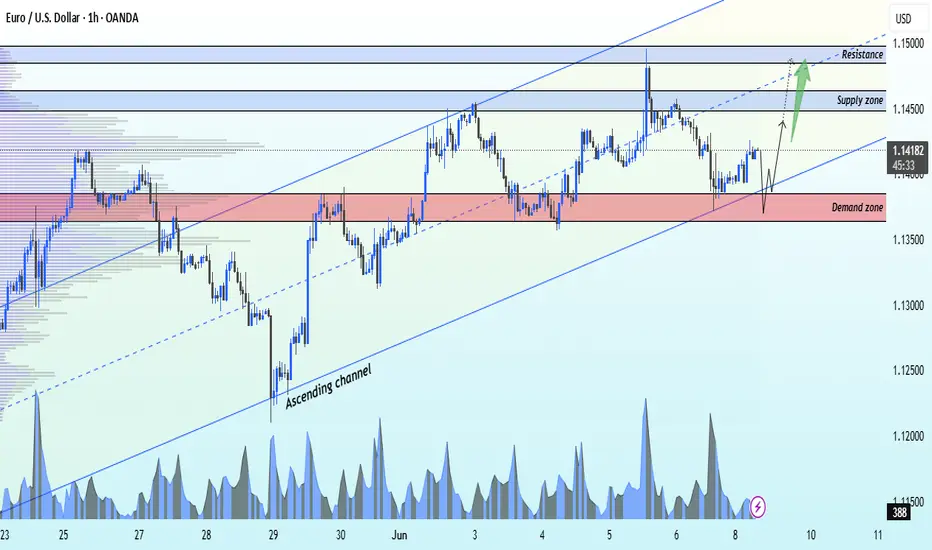
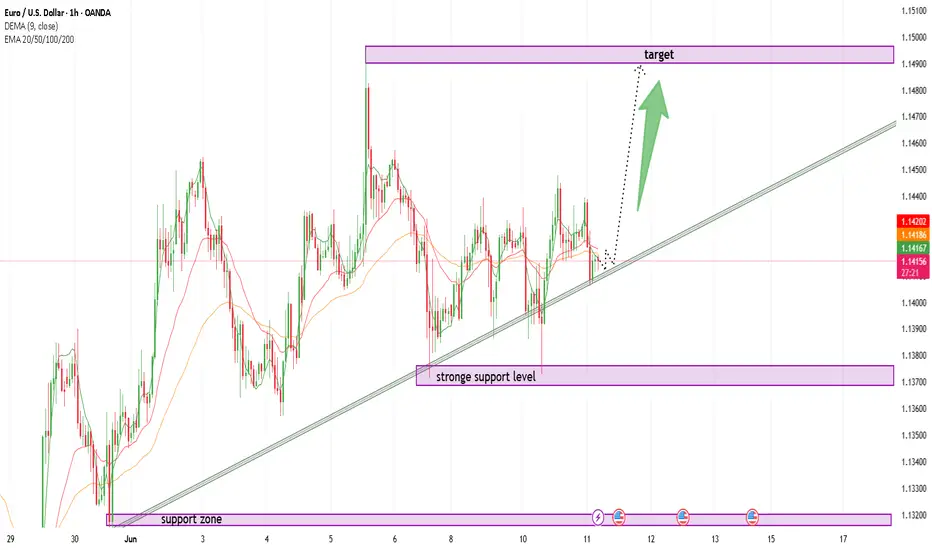
EURUSD has follow the ascending channel bullish from support FX:EURUSD Analysis – 1H Time Frame
EUR/USD is currently respecting an ascending channel and showing strong bullish momentum from the key demand zone at 1.13900.
🎯 Technical Targets:
1st Target: 1.14600
2nd Target: 1.15000
The price action confirms buyer interest and continued upside potential, as long as the structure holds.
📊 Stay tuned for more updates and trade setups!
💬 Like, follow, and drop your thoughts in the comments!
— With love,
Livia 😜
EUR/USD Weekly Outlook | Harmonic Butterfly PatternHere is a professional TradingView publish description for your EUR/USD Weekly Butterfly Pattern Analysis:
---
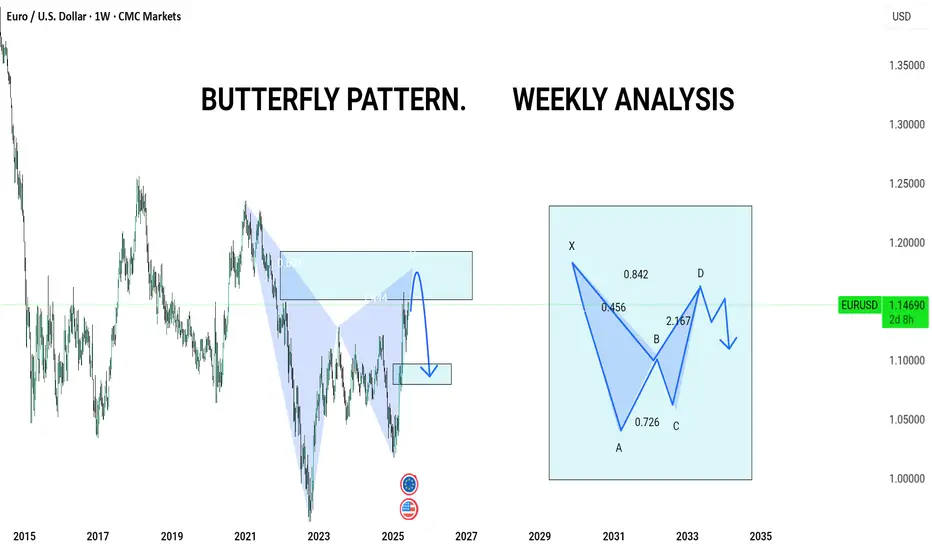
🦋 EUR/USD Weekly Outlook | Harmonic Butterfly Pattern
Pair: EUR/USD
Timeframe: 1W (Weekly)
Strategy: Harmonic Pattern Recognition – Butterfly Pattern
Bias: Bearish Reversal Setup
---
🔍 Pattern Analysis:
Butterfly Harmonic Pattern completed with precision at the 1.272–1.414 extension zone, forming the critical D-point near 1.14700.
Price has reacted sharply from the PRZ (Potential Reversal Zone), aligning with a historical supply zone.
Confluence from Fibonacci extensions:
AB = 0.786 retracement
BC = 0.382 to 0.886 retracement
CD = 1.618 to 2.618 extension
📉 Bearish rejection expected from this high-probability reversal zone.
---
📌 Key Levels:
PRZ (Potential Reversal Zone): 1.14500 – 1.15000
First Target Zone (Support Block): 1.11500 – 1.10500
Invalidation (Pattern Failure): Close above 1.15500
---
📅 Projection: This weekly harmonic butterfly suggests a potential trend reversal or deep pullback. We may see EUR/USD targeting lower support as D-point gets respected. Watch for signs of weakness such as long-wick rejections, bearish engulfing patterns, or RSI divergence confirmation.
---
💡 Conclusion: EUR/USD is at a critical juncture. If the butterfly holds, this could be a high RR short opportunity for swing traders. Patience is key—confirmation on lower timeframes will validate entry.
---
📊 #EURUSD #ButterflyPattern #HarmonicTrading #ForexAnalysis #TechnicalAnalysis #SwingTradeSetup
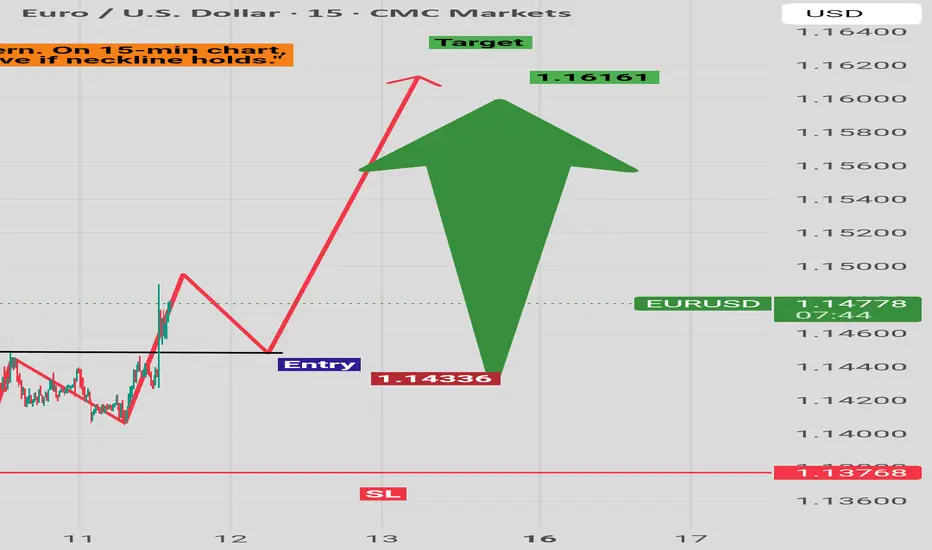
"EUR/USD 15-Min | Inverse Head & Shoulders Breakout EUR/USD 15-Min Chart — Inverse Head & Shoulders Pattern.
✅ Entry: 1.14336 (Neckline Break Confirmation)
✅ Target: 1.16161 (Based on Pattern Projection)
✅ Stop Loss: 1.1400 (Below Right Shoulder)
🎯 Potential Move: 50-80 pips
📊 Risk:Reward = 1:3
Educational Purpose Only. Not Financial Advice.
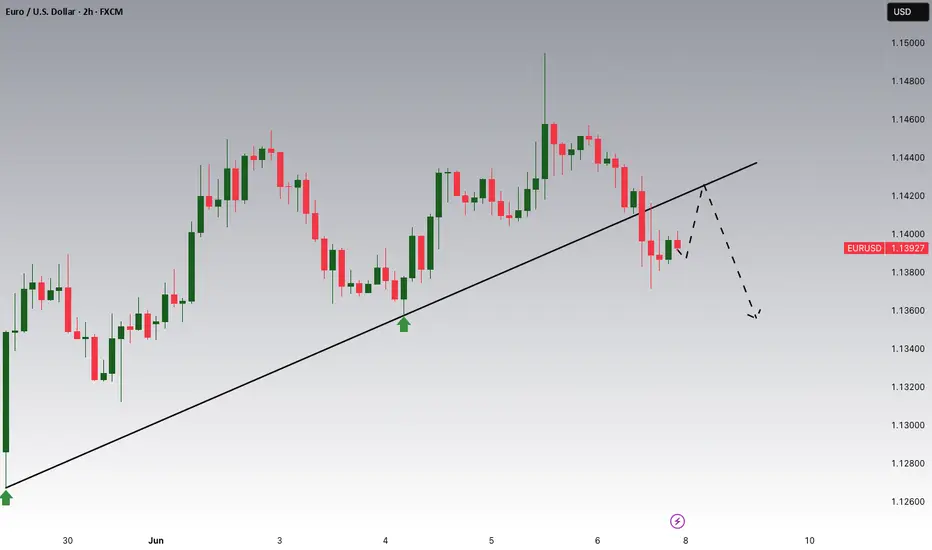
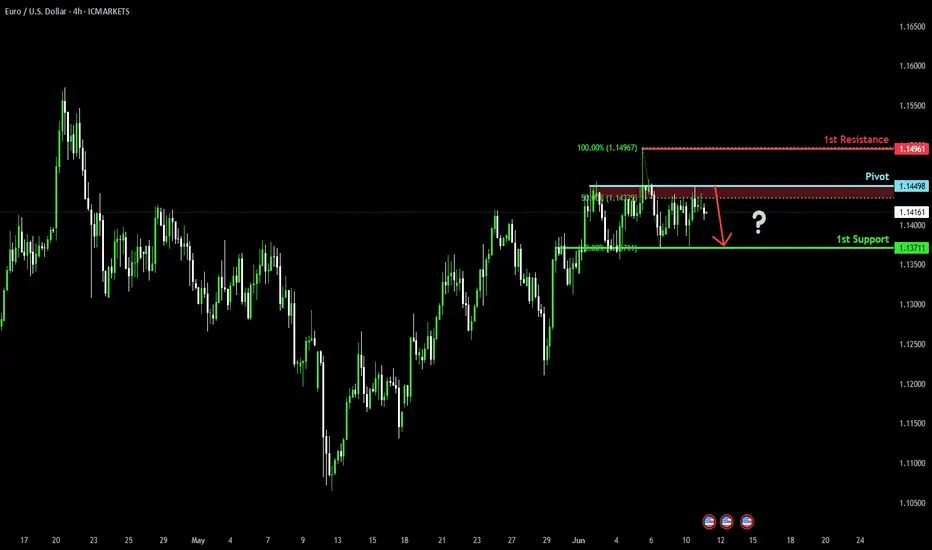
Bearish drop?Fiber (EUR/USD) has reacted off the pivot which is a pullback resistance and could drop to the 1st support which is an overlap support.
Pivot: 1.1449
1st Support: 1.1371
1st Resistance: 1.1496
Risk Warning:
Trading Forex and CFDs carries a high level of risk to your capital and you should only trade with money you can afford to lose. Trading Forex and CFDs may not be suitable for all investors, so please ensure that you fully understand the risks involved and seek independent advice if necessary.
Disclaimer:
The above opinions given constitute general market commentary, and do not constitute the opinion or advice of IC Markets or any form of personal or investment advice.
Any opinions, news, research, analyses, prices, other information, or links to third-party sites contained on this website are provided on an "as-is" basis, are intended only to be informative, is not an advice nor a recommendation, nor research, or a record of our trading prices, or an offer of, or solicitation for a transaction in any financial instrument and thus should not be treated as such. The information provided does not involve any specific investment objectives, financial situation and needs of any specific person who may receive it. Please be aware, that past performance is not a reliable indicator of future performance and/or results. Past Performance or Forward-looking scenarios based upon the reasonable beliefs of the third-party provider are not a guarantee of future performance. Actual results may differ materially from those anticipated in forward-looking or past performance statements. IC Markets makes no representation or warranty and assumes no liability as to the accuracy or completeness of the information provided, nor any loss arising from any investment based on a recommendation, forecast or any information supplied by any third-party.
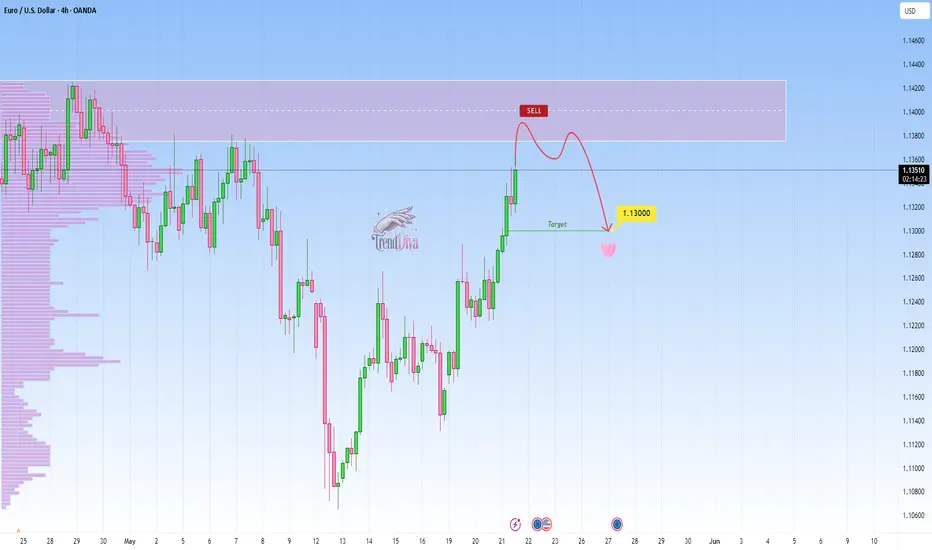
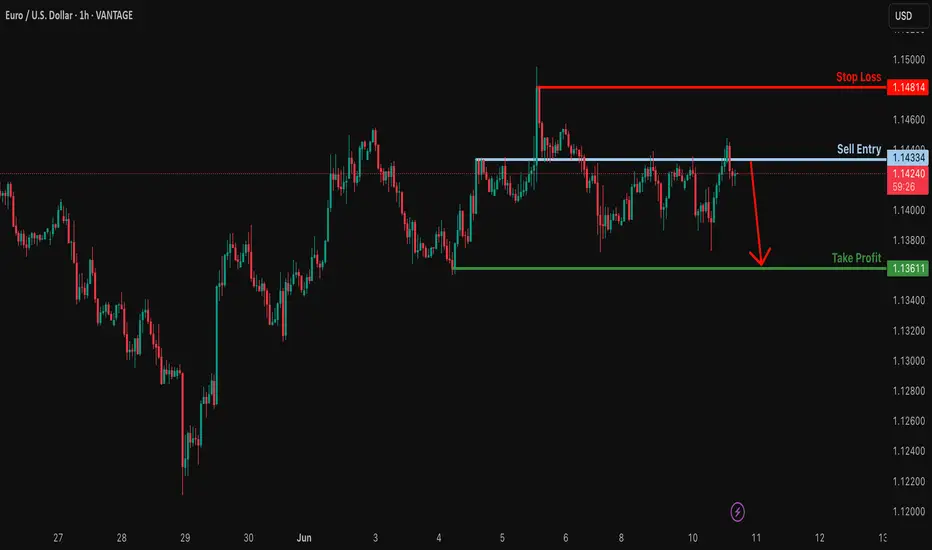
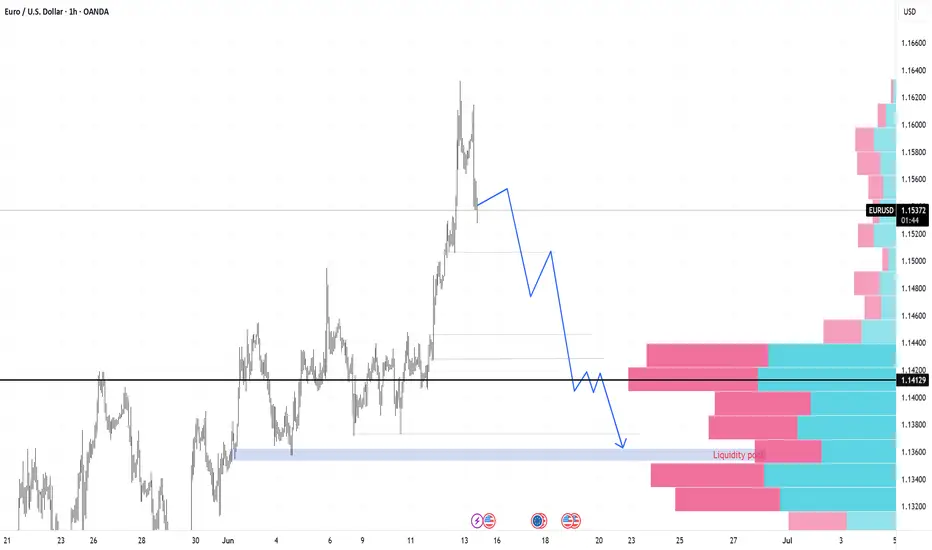
Bearish drop off major resistance?EUR/USD has reacted off the resistance level which is a pullback resistance and could drop from this level to our take profit.
Entry: 1.1433
Why we like it:
There is a pullback resistance level.
Stop loss: 1.1481
Why we like it:
There is a pullback resistance level.
Take profit: 1.1361
Why we like it:
There is a pullback support level.
Enjoying your TradingView experience? Review us!
Please be advised that the information presented on TradingView is provided to Vantage (‘Vantage Global Limited’, ‘we’) by a third-party provider (‘Everest Fortune Group’). Please be reminded that you are solely responsible for the trading decisions on your account. There is a very high degree of risk involved in trading. Any information and/or content is intended entirely for research, educational and informational purposes only and does not constitute investment or consultation advice or investment strategy. The information is not tailored to the investment needs of any specific person and therefore does not involve a consideration of any of the investment objectives, financial situation or needs of any viewer that may receive it. Kindly also note that past performance is not a reliable indicator of future results. Actual results may differ materially from those anticipated in forward-looking or past performance statements. We assume no liability as to the accuracy or completeness of any of the information and/or content provided herein and the Company cannot be held responsible for any omission, mistake nor for any loss or damage including without limitation to any loss of profit which may arise from reliance on any information supplied by Everest Fortune Group.
What Is a Morning Star Pattern & How Can You Use It in Trading?What Is a Morning Star Pattern, and How Can You Use It in Trading?
The morning star candlestick is a popular price action pattern that technical analysts and traders use to identify potential trading opportunities. It indicates a reversal from a bearish to a bullish trend and is a valuable addition to any trader's toolkit. In this article, we will cover all the technical aspects of the morning star candlestick pattern.
What Is the Morning Star Candlestick Pattern?
The morning star in technical analysis is a reversal formation that appears at the end of a downtrend and signals a trend reversal. It consists of three candles.
To identify it on the chart, you should look for the following:
1. Downtrend: The market should be in a downtrend, and the first candle should be long and bearish.
2. Indecision: The second candle is usually expected to have a gap down, but gaps are uncommon in forex. Therefore, a small-bodied candle is considered sufficient. It's worth noting it can be either bullish or bearish, but if it’s bullish, the signal is stronger.
3. Significant increase: The third candle should be strong and bullish and close above the midpoint of the first bearish one. If it forms with a gap up, the buy signal is considered stronger.
When Morning Star Candlestick Patterns Occur
Traders can identify the morning star candlestick pattern in stocks, forex pairs, commodities, and cryptocurrencies*. It may also be observed across various timeframes, from minutes to weeks.
Generally speaking, a morning star pattern can be considered more reliable when it appears on a higher timeframe. For instance, a morning star candlestick pattern has more significance when it occurs over three days vs three minutes, given the increased amount of price action and market participation reflected over longer periods.
Psychology Behind the Pattern
The morning star reversal pattern reflects a shift in market sentiment from bearish to bullish. Initially, a strong bearish candle indicates prevailing selling pressure. The second candle, with its small body, suggests indecision as the market stabilises and neither bulls nor bears dominate. This pause indicates that sellers are losing momentum. The third morning star candle, a strong bullish one, confirms the shift as buyers take control, driving prices higher. This pattern signals that the downtrend is likely exhausted, and a potential reversal is underway due to increasing buyer confidence.
Trading with the Morning Star
Traders can use the following steps to trade this setup:
1. Identify the setup: Look for a setup on the chart formed after a solid downtrend.
2. Confirmation: After identifying the formation, traders should confirm it before entering a long position.
3. Enter a long position: Consider entering a long position once the formation is confirmed.
4. Determine a take-profit target: Although candlesticks don’t provide specific entry and exit points, traders may consider the closest resistance level to take potential profit.
5. Monitor the trade: Continuously monitor the trade and adjust the stop-loss and take-profit levels as needed based on market conditions.
What Is the Morning Star Candlestick Strategy?
The morning star trading strategy leverages the formation's ability to signal a bullish reversal after a downtrend. The formation's reliability increases when it occurs at a support level and is confirmed by a momentum indicator like the RSI or MACD.
Entry:
- Traders look for the full morning star to form at a support level.
- They then look for a confirmatory bullish signal from a momentum indicator, such as RSI showing oversold conditions, a bullish MACD crossover, or a bullish divergence in either.
- Traders may wait for additional confirmation, like RSI moving back above 30, or enter on the close of the third candle in the pattern.
Stop Loss:
- A stop loss might be set below the swing low of the setup.
- Alternatively, traders may place the stop loss beyond the lower boundary of the established support level.
Take Profit:
- Profits might be taken at a predetermined risk-reward ratio, like 2:1 or 3:1.
- Traders also often aim for an opposing resistance level where a further reversal might occur.
Morning Star and Other Formations
Traders should not confuse the morning star candle formation with other formations, such as the evening star, which is the complete opposite.
Doji Morning Star
In a traditional morning star reversal pattern, the candle that appears in the middle of the formation has a small real body, meaning there is a clear difference between the opening and closing prices.
In a morning doji star formation, the second candlestick has characteristics of a doji, where the opening and closing prices are very close to each other, resulting in a very small real body. This reflects the indecision as neither bulls nor bears can take control of the market.
The doji setup is less common than the traditional formation, but it still signals a potential upward movement after a prolonged downtrend.
Evening Star
In contrast to a morning setup, an evening star is a bearish setup occurring after an uptrend. It also consists of three candles – a long bullish one, a small-body one (it can also be a doji), and a long bearish one that closes below the midpoint of the first bullish candle. This suggests that the market is about to turn down.
Benefits and Limitations of the Morning Star Candle
The morning star is a useful tool for traders seeking to identify potential market reversals, but it does come with some benefits and limitations.
Benefits
- Strong Reversal Signal: Indicates a bullish reversal after a downtrend, helping traders anticipate upward moves.
- Broad Applicability: Effective across various financial instruments such as forex, stocks, commodities, and cryptocurrencies*.
- Timeframe Flexibility: It can be observed on different timeframes, from intraday to weekly charts.
Limitations
- False Signals: Like all patterns, it can produce false signals, especially in volatile markets.
- Confirmation Needed: A morning star pattern entry requires confirmation from additional indicators or formations to improve accuracy.
- Experience Required: Identifying the formation correctly and interpreting its signals requires experience and a good understanding of price action.
Final Thoughts
While candlestick formations such as the morning star can be useful for traders to identify potential trading opportunities, it is crucial to remember that they are not foolproof and should not be the sole choice of market participants when making their trading decisions. Traders should also incorporate technical indicators and develop risk management techniques to potentially minimise losses.
FAQ
What Is a Morning Star in Trading?
The meaning of a morning star in trading refers to a bullish reversal formation consisting of three candles. It appears at the end of a downtrend, indicating a potential shift to an uptrend. The setup includes a long bearish candle, a small-bodied candle, and a long bullish candle.
Is the Morning Star Bullish or Bearish?
It is a bullish candlestick pattern that indicates a potential reversal from a downtrend to an uptrend in the market. It suggests that the selling pressure is subsiding, and buying pressure is beginning to take over.
What Does the Morning Star Pattern Indicate?
It is a three-candle price action, often indicating a bullish reversal in the market. It suggests that selling pressure has been exhausted, and buyers are starting to gain control of the market.
How Do You Read the Morning Star Pattern?
To read the morning star formation, traders should look for the following characteristics: a long bearish candle formed in a solid downtrend and followed by a bullish or bearish candle with a small real body, which in turn is followed by a long bullish candle closing above the midpoint of the first one.
What Is the Opposite of Morning Star?
The opposite of a morning star is the evening star, a bearish reversal pattern. It appears at the end of an uptrend, signalling a potential shift to a downtrend. The morning and evening stars are similar, except the latter mirrors the former, consisting of a long bullish candle, a small-bodied candle, and a long bearish candle.
*Important: At FXOpen UK, Cryptocurrency trading via CFDs is only available to our Professional clients. They are not available for trading by Retail clients. To find out more information about how this may affect you, please get in touch with our team.
This article represents the opinion of the Companies operating under the FXOpen brand only. It is not to be construed as an offer, solicitation, or recommendation with respect to products and services provided by the Companies operating under the FXOpen brand, nor is it to be considered financial advice.
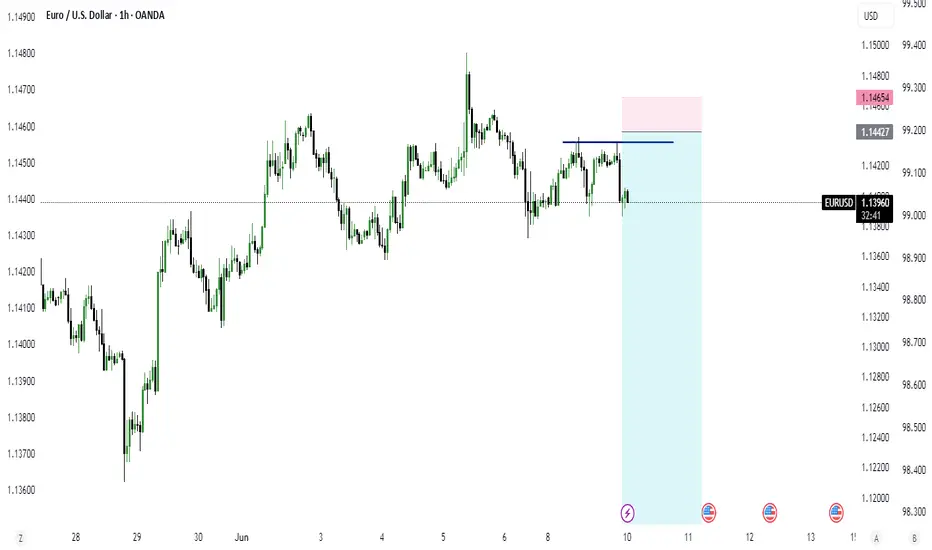
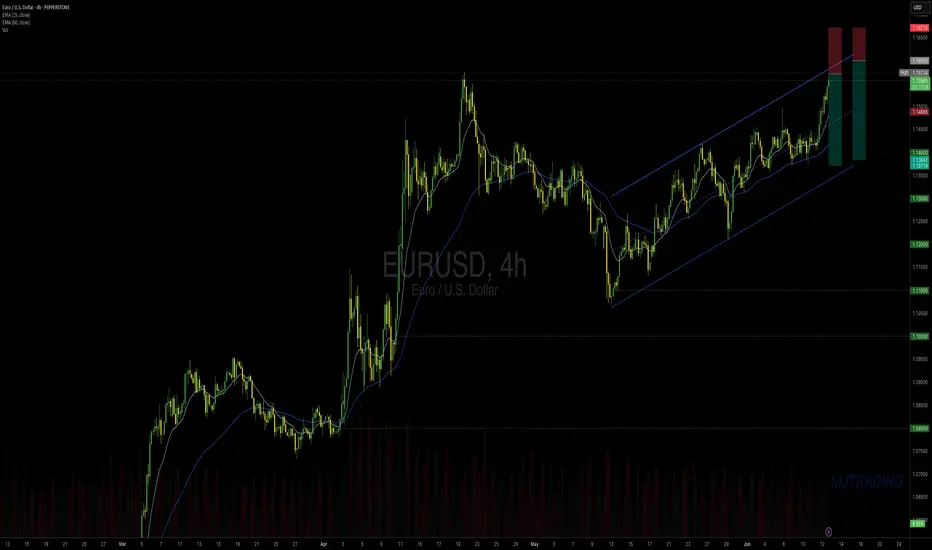
eurusd 1:35 short todayshorty entry today june10.
short swing trade
expect the entry above the noted highs
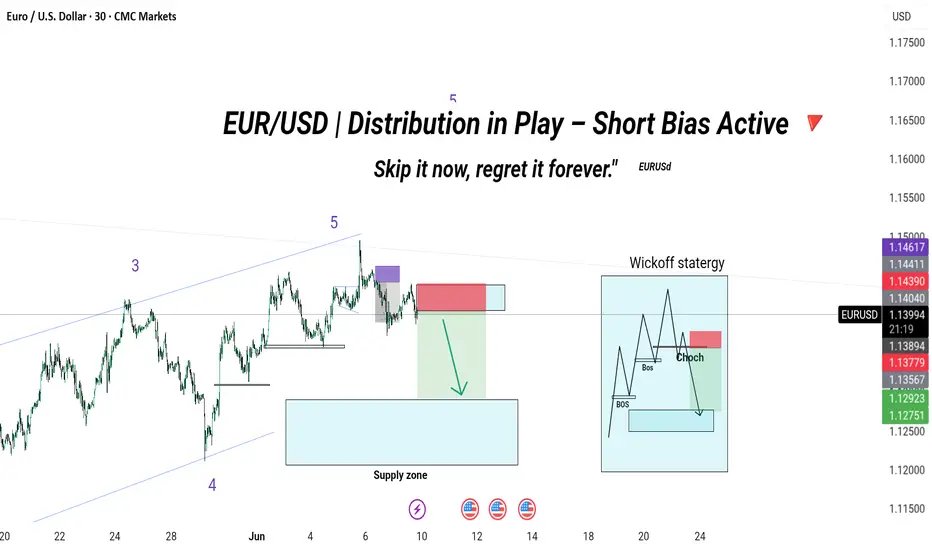
EUR/USD | Distribution in Play – Short Bias Active After completing a textbook Wave 5, price entered a premium supply zone and executed a clean liquidity sweep.
🔹 Confirmed Change of Character (ChoCh) signals the shift from bullish to bearish order flow.
🔹 Price is respecting the SMC structure:
📍 Liquidity grab
📍 Mitigation of bearish order block
📍 Distribution phase after impulsive rally
📉 Short-Term Bias: Bearish
🎯 Targeting the demand zone below near 1.1275–1.1292, where we may expect accumulation to begin again.
📌 Plan:
1. Short entries valid below 1.1439 supply.
2. Monitoring reaction at the blue zone for possible reversal next week.
⚙️ Strategy used:
SMC + Wyckoff Distribution + Elliott Wave (Top-down)
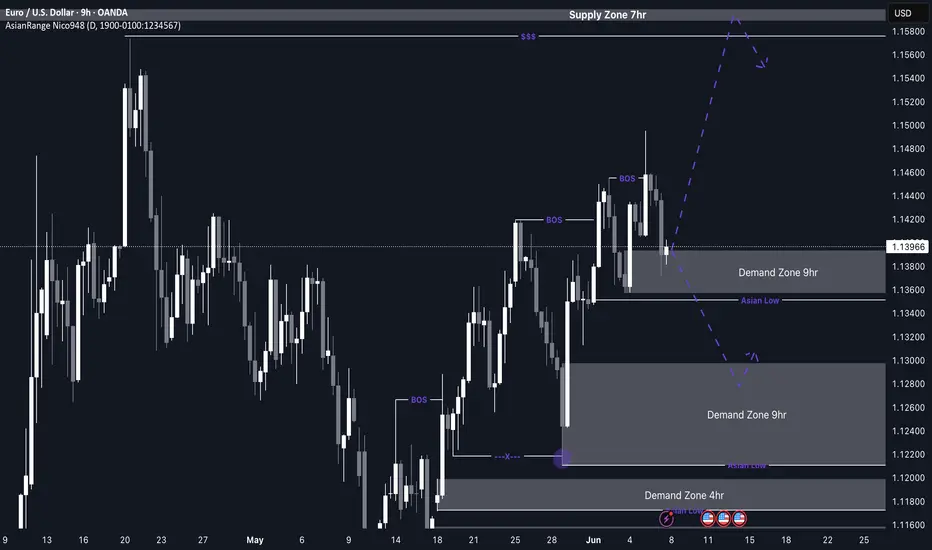
EUR/USD Potential buys from current zone or 1.12800My outlook for EU this week closely aligns with GU — both pairs are showing similar structure and direction. Price continues to form higher highs and higher lows, maintaining its bullish momentum.
Following the most recent break of structure to the upside, EU has now entered a 9H demand zone, where I’ll be watching for signs of accumulation and potential entry as the market opens on Monday.
If this current zone fails to hold, there’s a more discounted 9H demand zone just below, which could offer a cleaner long opportunity. Either way, both scenarios follow the pro trend, which adds conviction to the buy idea.
Confluences for EU Buys:
Price has broken structure to the upside and entered a clean 9H demand zone
There’s another refined 9H demand zone just below for additional confirmation
Plenty of upside liquidity remains untouched
Structure remains bullish on the higher timeframes, making this a pro trend setup
P.S. If price reacts well and continues pushing higher, I’ll be keeping an eye on the 7H supply zone above for any possible short-term bearish reaction.
Wishing everyone a successful and disciplined trading week ahead!
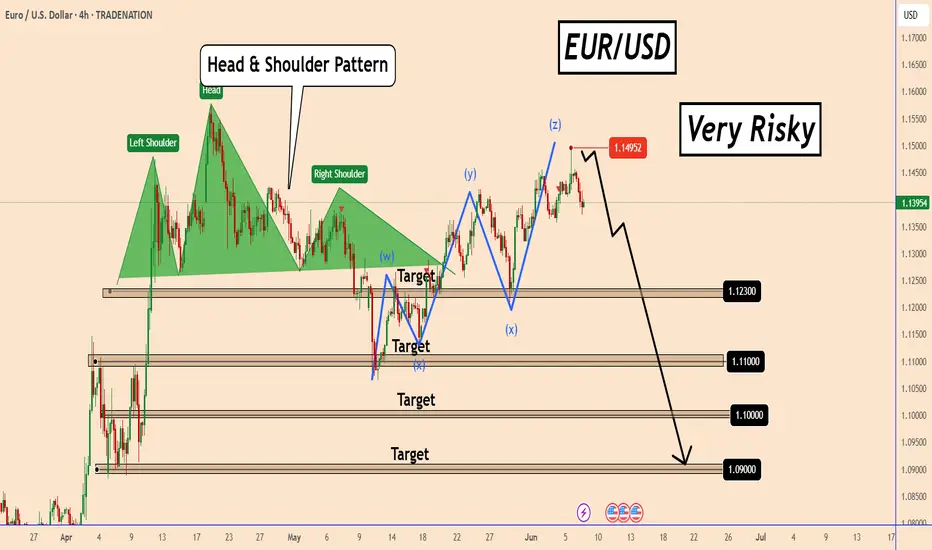
EURUSD: Bears May Regain Control of the PriceEURUSD: Bears May Regain Control of the Price
From our previous analysis, EURUSD extended the Z wave to 1.1495 due to high volatility and speculation related to Trump's comments against China and the old price theme.
However, nothing changed again. EURUSD found sellers near 1.1495 which had already rejected the price again and it seems that the downward movement may resume soon.
We do not have clear signs of a reversal yet, but as long as the price is holding and the patterns are valid, the chances are that EURUSD will fall as shown in the chart.
Bearish Targets:
1.1230 – First major support level
1.1100 – Possible second target
1.1000 – A deeper correction point
1.0900 – Strong structural support
You may find more details in the chart!
Thank you and Good Luck!
❤️PS: Please support with a like or comment if you find this analysis useful for your trading day❤️
Disclosure: I am part of Trade Nation's Influencer program and receive a monthly fee for using their TradingView charts in my analysis.
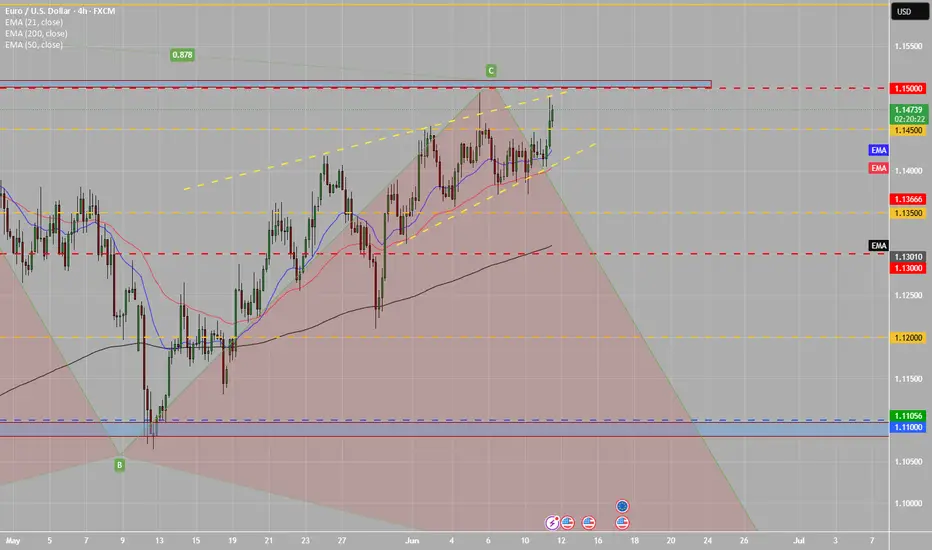
EU DEEP CRAB PATTERN C-D LEGPrice seems to be reaching the 88.8 FIB Level, this would cause major resistance to bullish trend, could possible start to see price retest lower support levels.
Testing Upper Channel Line || Eyes on 1.16 and Previous High📌 EURUSD 4H – Testing Upper Channel | Eyes on 1.1600-1.1666
🕓 June 12, 2025
👤 By: MJTrading
🔍 Technical Overview:
EURUSD continues its upward trajectory within a clean ascending channel, respecting both dynamic structure and EMA support zones. We're now retesting a key confluence area:
==============================================================
🔻 Bearish Setup Idea:
Entry Zone: 1.1570–1.1600
Stop Loss: Above 1.16666 (round number & psychological resistance)
Target: Channel midline (~1.1450) or lower band (~1.1380)
🧠 Why This Zone Matters:
🔺 Previous Swing Highs: Price is revisiting the April peak zone (~1.1570)
🧱 Round Number Confluence: 1.1600 & 1.1666
📉 Rising Channel Resistance: Upper boundary hit after extended leg
🔄 Potential Mean Reversion: EMAs are lagging behind price
⚠️ Invalidation:
A clean break and close above 1.1700 with follow-through may invalidate short bias and signal continuation toward 1.1800+
💬 Patience is power. Let the levels do the talking.
📎 #EURUSD #ForexAnalysis #TechnicalTrading #SmartMoney #PriceAction #RoundNumberLevels #MJTRADING
EURUSD: heading toward double-top?The jobs data were in the spotlight of the US market during the previous week. The JOLTs job openings in April reached 7,391M, a bit hotter from market forecast of 7,10M. The Non-farm Payrolls in May added 139K new jobs, which was modestly higher from the forecasted 130K. The unemployment rate remained unchanged in May at the level of 4,2%. The average hourly earnings were higher by 0,4% for the month and 3,9% for the year. As for other posted data, the US ISM Manufacturing PMI for May was standing at 48,5, modestly below market estimate of 49,5. The ISM Services in May were standing at 49,9, lower from estimated 52,3.
Previous week on the European market was marked with an eighth rate cut by 25bps, bringing the reference rate to 2%. Potential further rate cuts will continue to be data-driven. The ECB also cut its inflation forecast till the end of this year to 2%, from 2,3% forecasted previously. At the same time, the posted flash inflation rate in the Euro Zone in May is 1,9% on a yearly basis, which was below market estimate of 2%. The core inflation continues to be a bit elevated, standing at the level of 2,3% y/y in May. EuroZone inflation in May was 0% compared to the previous month. The Producers Price Index in the Euro Zone in May was down by -2,2% for the month, and 0,7% on a yearly basis. The balance of trade in Germany in April had a surplus of euro 14B, which was significantly lower from estimated euro 20,2B.
During the previous week the currency pair was moving relatively slowly, within a short range. Fundamentals were shaping the investors sentiment. One one side, the ECB new cut of reference rates, while on the other side were relatively stable jobs data for the US market. The eurusd spent the previous week in a range between 1,1340 and 1,1450. There was a short move toward the 1,1490 on Thursday, but the market was not willing to test the 1,15 level on this occasion. Based on moves, the market is still not ready to move away from 1,14 lines. The RSI continues to move above the level of 50, indicating again that the market is not ready to take the path toward the oversold market side. The MA50 continues to diverge from its MA200 counterpart, without an indication of a potential change of course in the coming period.
The week ahead is bringing US inflation data for May as well as inflation expectations from the University of Michigan survey. In case of some negative movements in this segment, the market reaction might be triggered. In this case it could be expected further weakening of the US Dollar against Euro, and a trigger for testing of the 1,15 level. Highs from April this year at 1,1570 might easily become the market target. However, if May inflation holds at levels expected by the market, which could be the most likely scenario, then some short term straightening of US Dollar might take place. The first stop would certainly be the 1,14 level, while the next one stands at 1,1275. It is interesting to mention higher potential for double top formation in the technical analysis, which eurusd is currently modestly forming. In case that the double top is triggered in the coming week or two, then the next level for eurusd could be 1,12 level, where highs from September 2024 stands. However, this scenario, if it occurs, could be revealed within the next few weeks.
Important news to watch during the week ahead are:
EUR: Industrial Production in April in the EuroZone, final inflation rate in May for Germany
USD: Inflation rate in May, Producers Price Index in May, University of Michigan Consumer Sentiment preliminary for June.
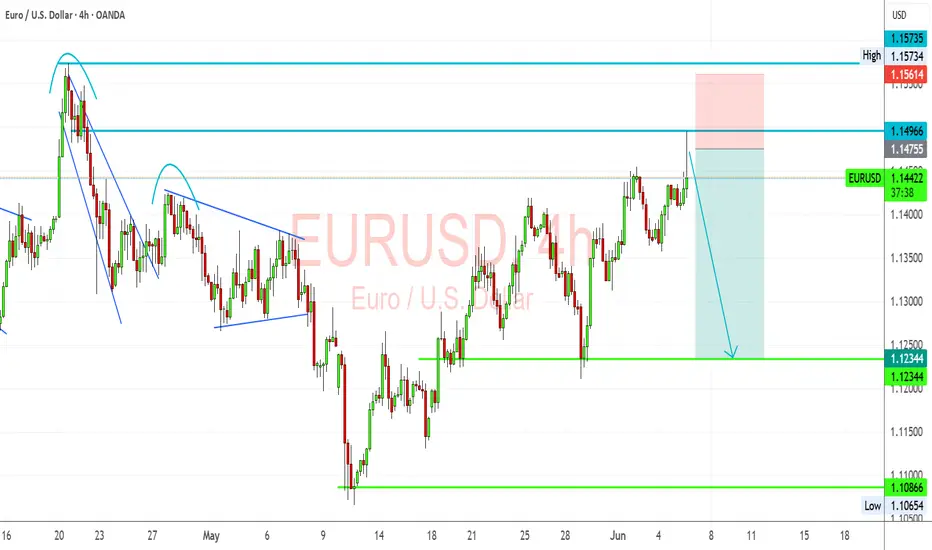
EURUSD Analysis – Short Bias Builds on Key Resistance RejectionEURUSD pair is currently testing a critical resistance zone around 1.1495–1.1500, with bearish rejection beginning to form on the 4H timeframe. The technical setup suggests a potential lower high forming within the context of a broader downtrend, supported by a confluence of horizontal resistance and bearish risk catalysts.
🔍 Technical Overview:
Resistance Zone: 1.1495–1.1575 (multi-timeframe key levels)
Support Levels to Watch: 1.1234 (range base) and 1.1086 (swing low)
Price Action: After a sustained rally, price is showing exhaustion near previous highs, and a rejection pattern is emerging, suggesting selling interest.
Risk Management: Stop placed above 1.1575 high, with downside targets near 1.1234 and extended toward 1.1086.
🧠 Fundamental Backdrop:
ECB Policy Outlook: Lagarde recently warned that a stronger euro and higher tariffs may hurt EU exports. This dovish tone could weigh on EUR sentiment in the medium term.
US Dollar Strengthening: The latest US labor market data (ADP, JOLTS) beat expectations, showing continued resilience in employment and wage growth. This supports the Fed's data-dependent approach, favoring a stronger USD.
Macro Tensions: Global trade concerns (Trump’s tariffs, weak China demand, Germany’s slowing job market) are adding pressure to EUR while supporting safe-haven USD flows.
ECB Consumer Expectations Survey (April): Highlights persistent inflation fears and deteriorating economic confidence.
⏳ Scenario Outlook:
✅ Bearish Bias Preferred below 1.1500 with confirmation of rejection.
🎯 Target Zone 1: 1.1234 – Strong structure & demand zone.
🎯 Target Zone 2 (Extended): 1.1086 – Major low from mid-May.
❌ Invalidation: A breakout and close above 1.1575 would neutralize the bearish outlook and open up higher targets toward 1.17.
Conclusion: The EURUSD pair presents a compelling short opportunity, with both technical resistance and macro pressure aligning for a retracement or reversal. Short setups are favored unless bulls reclaim and hold above the 1.1575 handle.
EURUSD likely to reach Level 1.13538EURUSD is in Bullish phase and has reached keylevels. EURUSD is likely to reverse and reachout level 1.13538.
This analysis is for educational purpose only. Not an investment or financial advise.
EURUSD Trade Signal – BUY NOW Entry Point: 1.14160EURUSD Trade Signal – BUY NOW
Entry Point: 1.14160
🎯 1st Target: 1.14500
🎯 Final Target: 1.14900
📈 EURUSD showing bullish potential
🔍 Strong support zone at 1.14000
📊 Clean price action setup on H1/H4
🟢 Buyers stepping in with volume
🧠 Risk Management is Essential
📉 Suggested Stop-Loss: Below 1.13900
⚖️ Risk 1–2% of total capital per trade
🛡️ Always secure your capital first
🧭 Stick to your trading plan
⏱️ Wait for a solid entry confirmation
📌 Patience pays in forex
📊 Set your TP & SL — then let it run
💬 Monitor news that may affect EUR/USD
✅ Trade with discipline, not emotion
📢 Smart risk, smart rewards
EURUSD: at key resistance: Will price rebound to 11300?Quick recap on EURUSD, seriously déjà vu of my previous analysis on EURUSD - once again we see the price coming towards the same resistance level. This is a level where it has struggled to break through and reversed nicely to the downside as expected. For me it's definitely one to monitor, especially for anyone considering short trades.
If we start seeing signs that the price is getting rejected here: like long wicks, bearish candles, or buyers starting to lose momentum, I think we could see a move down toward the 1.11300 level. I am targeting a slight bounce like before, nothing major. But if price cleanly breaks out, that would rule out the bearish outlook and suggest even further upside will follow.
This area is pretty important and could give us a better idea of where price is headed next.
Just sharing my thoughts on support and resistance, this isn’t financial advice. Always confirm your setups and manage your risk properly.