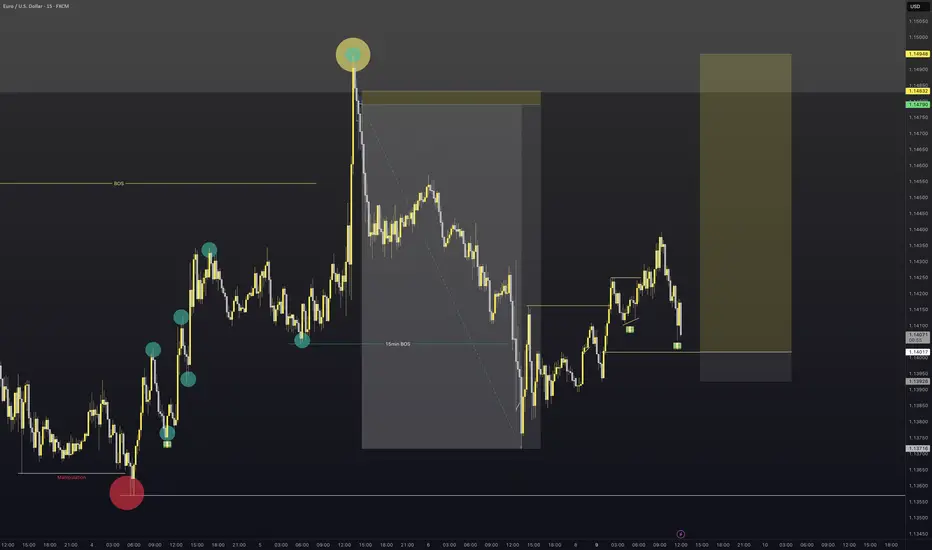
EURUSD - Long 15min orderflow changeI have set a pending order on EURUSD based on the structure shift and liquidity left behind to the left and now the right.
Entry order placed. lets see what happens on this position.
USDEUX trade ideas
The surge in the euro was expected
💡Message Strategy
Since the beginning of this trading week, a number of economic data released by the United States have been weak. Following the decline in the manufacturing PMI, the ISM service PMI for May released on Wednesday fell to 49.9, the first contraction in nearly a year. In addition, the ADP employment data was also far below expectations, with only 37,000 new jobs, far below the expected 115,000, which strengthened the market's concerns about the risk of a US recession, thereby dragging down the US dollar.
At the same time, risk aversion and uncertainty in the United States have not improved significantly, and trade tensions, debt prospects and weak US bond yields have put pressure on the US dollar. Obviously, in the game between eurozone monetary policy and US economic data, the euro wins.
📊Technical aspects
From the daily chart, the exchange rate has maintained a strong oscillation pattern since mid-April, and has generally been running between the middle and upper tracks of the Bollinger Bands. The upper track of the Bollinger Bands is currently at 1.1471, and the lower track is at 1.1118. The Bollinger Bands are slightly open, indicating a rebound in volatility.
The MACD indicator shows that the double lines form a golden cross, and the bar chart turns from green to red, suggesting that the downward momentum is weakening; the RSI indicator remains near 57, slightly in the neutral to bullish area, and has not yet reached the overbought level. The overall technical pattern tends to fluctuate upward. If it breaks through the 1.1500 area, it will continue to rise.
At present, the main idea is still to do more on the callback, and do not blindly chase the short.
Long Position: 1.14450-1.14650
Short signal Sell signal in these zones, targeting the initial move points and liquidity levels at
1.13821 and 1.13275.
Waiting for a great profit opportunity.
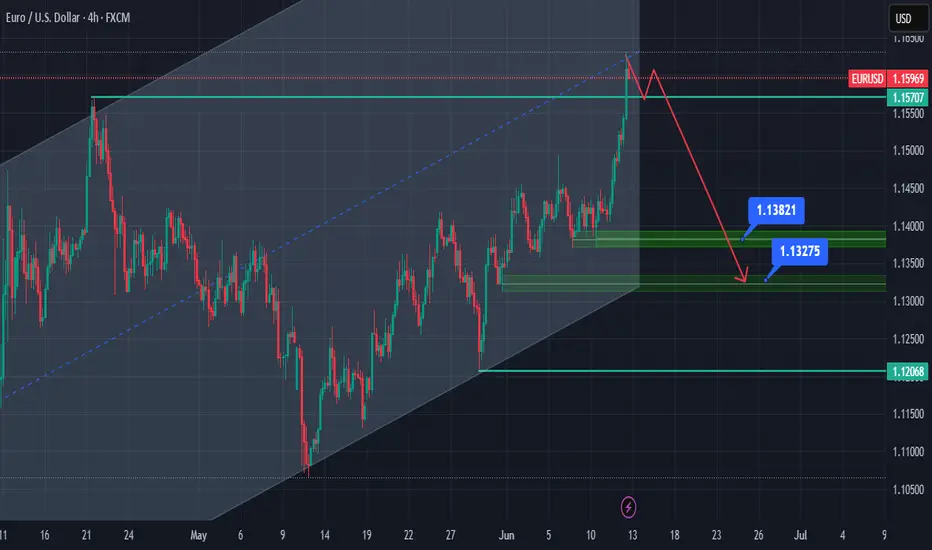
EURUSD-SELL strategy 6 Hourly chart GANNThe pair is on a positive note, i.e. weakness USDX but is starting to become very overbought. We may see slightly higher levels near 1.1650 area before we start our corrective action.
Strategy SELL @ 1.1645-1.1675 and take profit near 1.1427 for now.

#EURUSD Buy 1.15265#EURUSD Buy 1.15265
SL 1.14665
TP 1.15465
TP 1.16265
TP 1.17665
Trade at your own risk
Protect your capital
The Wizard 🧙♂️ SWFX

EURUSD Outlook – Long, Medium & Short-Term Analysis🔹 Weekly Chart:
The broader structure remains technically bearish. We've recently seen a trend reset, which could mark the beginning of a fresh downside leg.
🔹 Daily Chart:
A clear bearish trend reversal pattern has formed, accompanied by a manipulation phase. A confirmed break structure is now in place. As long as price remains below 1.15734, short positions remain valid.
🔹 4H Chart:
Currently in a range-bound phase. A confirmed break below 1.1371 will be a key bearish trigger for potential selling opportunities.
🔹 1H Chart:
Still ranging, but a valid Lower Low (LL) has already printed. A second LL below 1.1371 would confirm a short-term bearish continuation.
On the flip side, a break above 1.1495 would open the door for a bullish move in the short term.
📌 Key Levels to Watch:
Bullish above: 1.1495
Bearish below: 1.1371
Critical invalidation: 1.15734
Trade safe and stay disciplined.

EURUSD Interim Short Active, Looking for the LongInterim short active from our analysis posted last night, rejected off the lower end of the supply zone highlighted. Looking for the trade to trade down to a good Demand level to then take this trade up to the higher levels of the supply zone. Targeting the 1.1500 region. This will be all dependent on price action. If price moves to plan and 1.1500 is achieved we then can look for the original short position highlighted in last nights analysis.
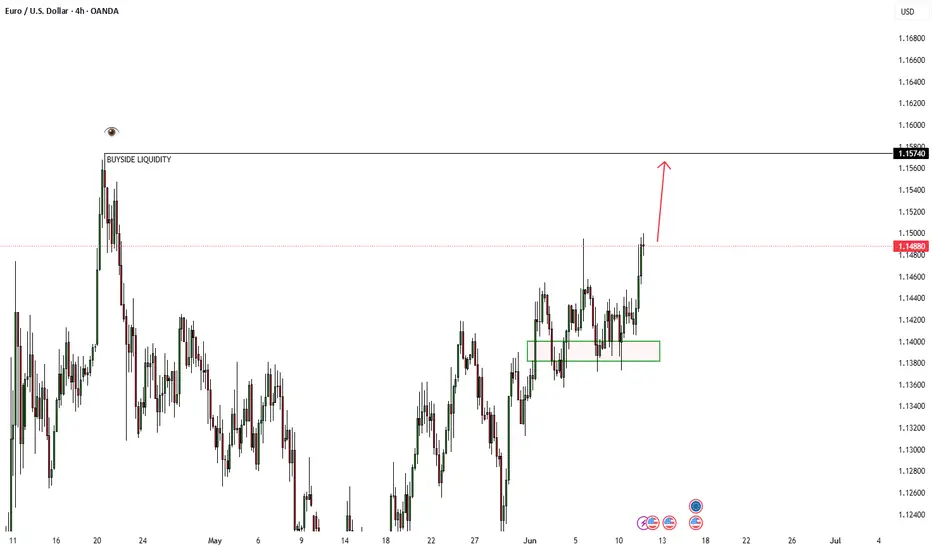
EURUSD 11/06/2025 - 4HR Buyside LiquidityEURUSD 11/06/2025 - 4HR Buyside Liquidity
Bearish on DXY, same story as USDJPY, looks very promising for 4HR buyside to be taken.
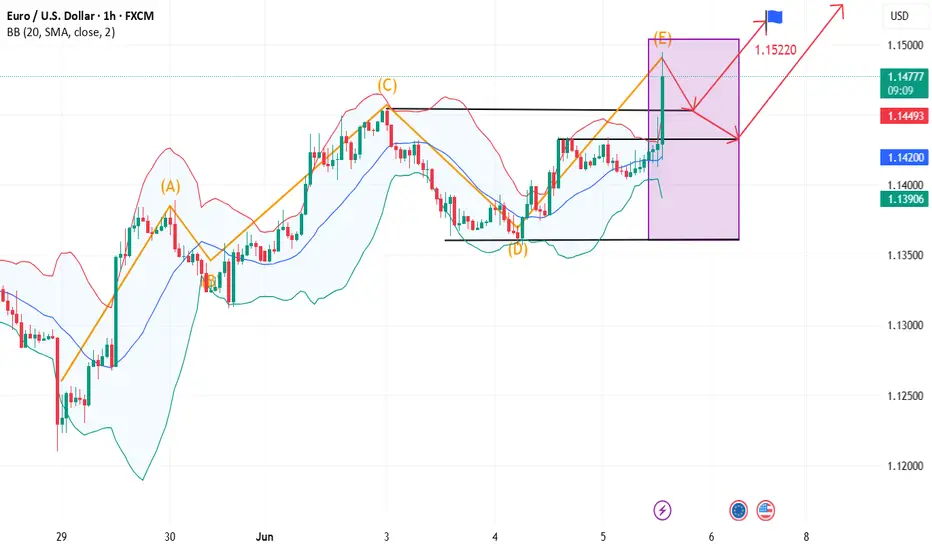
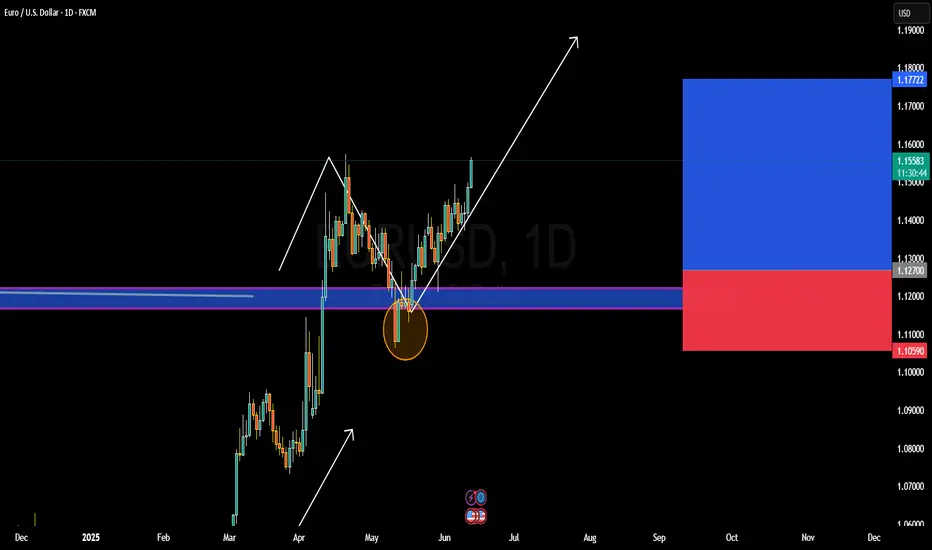
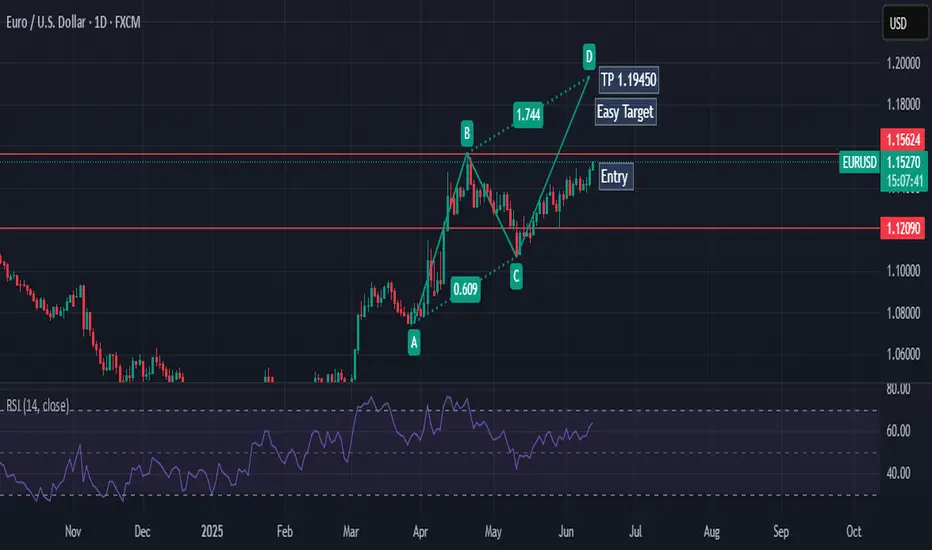
EURUSD BULLISH OR BARISH DETAILED ANALYSISEURUSD is showing strong bullish momentum after a clean bounce from the key support zone around 1.12. Price structure confirms higher lows and strong bullish candle formations on the daily chart, suggesting the bulls are in control. This recent move is backed by a textbook retest and rejection from the previous resistance-turned-support zone, giving confidence in a potential continuation toward the 1.19 level. With the current price trading near 1.15 and pushing higher, the market is positioned for a strong bullish wave in the coming sessions.
From a fundamental perspective, the Euro has gained fresh support after the ECB’s decision last week to proceed with a measured and data-dependent rate cut cycle. While the ECB delivered its first cut, the tone was cautious and far less dovish than anticipated, which kept EUR strength intact. On the USD side, traders are pricing in a more dovish outlook for the Federal Reserve, especially with recent CPI and PPI data pointing toward cooling inflation. This divergence in policy outlook continues to favor EURUSD upside in the medium term.
Technical indicators are also confirming the bullish bias. The pair is riding an ascending trendline, and momentum indicators like RSI remain in bullish territory without yet being overbought. A daily close above the 1.1550 area strengthens the case for a continuation move. The price is aiming for the next major resistance around 1.1770–1.19, where bulls are likely to take profit or scale out. Until then, dips are likely to be bought aggressively, as long as the 1.12 support remains intact.
This setup presents a high-probability opportunity in a trending market backed by both fundamentals and technical confluence. As long as the bullish structure holds, I remain long-biased on EURUSD with eyes on the 1.19 zone as the next key level. With increasing market interest, low volatility on the downside, and strong trend-following signals, this pair is set for a continued rally.
EURUSD SHORTAccording to natural market structure theory, I observed a gradual increase in volume starting from May 29, which led to a rebound around June 5. However, the uptrend has since lost momentum.
The recent price action has approached the zero line of the descending Fibonacci retracement. This movement, combined with a possible liquidity grab, suggests that the market may shift downward. The target price area is near the 0.5 Fibonacci level, but further observation is needed to confirm this scenario. OANDA:EURUSD

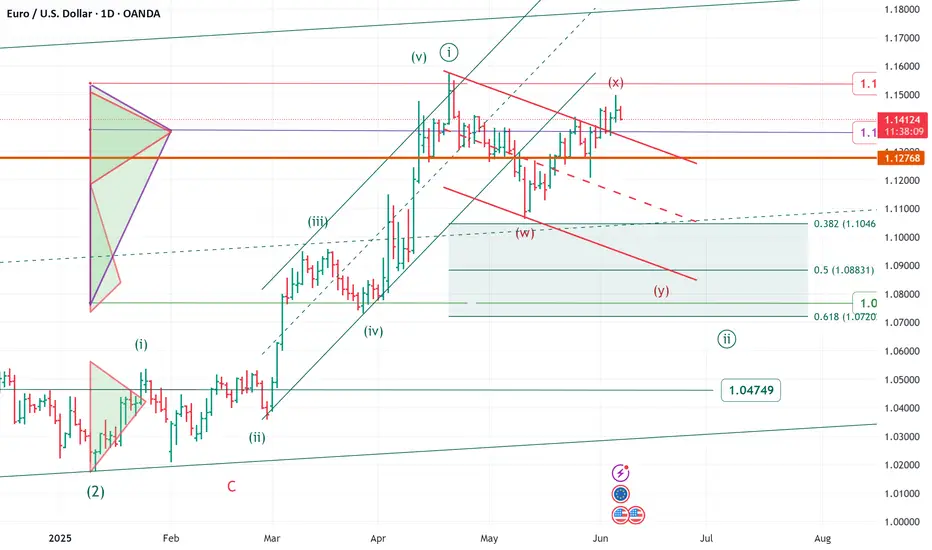
Elliott wave daily EURUSD update
Elliott wave daily EURUSD update
The price movement of the last few weeks requires a change
and update of the wave count
______________________________________
upward movement from area 1.018/genuary 2025 to area 1.1580/april 2025
looks impulsive - minute wave ((i)).
we are now in a corrective minute wave ((ii))
zigzag or flat or any double
target area 1.1040/1.0800 area
in the very short term level to monitor 1.1500 area
over 1.1500 area a flat correction more likely ( to area 1.1570)
note
FX option expiries for 6 June 10am New York cut
1.1500 (EUR 3.19bn)
1.1400 (EUR 2.38bn)
1.1300 (EUR 1.28bn)
FOREXLIVE
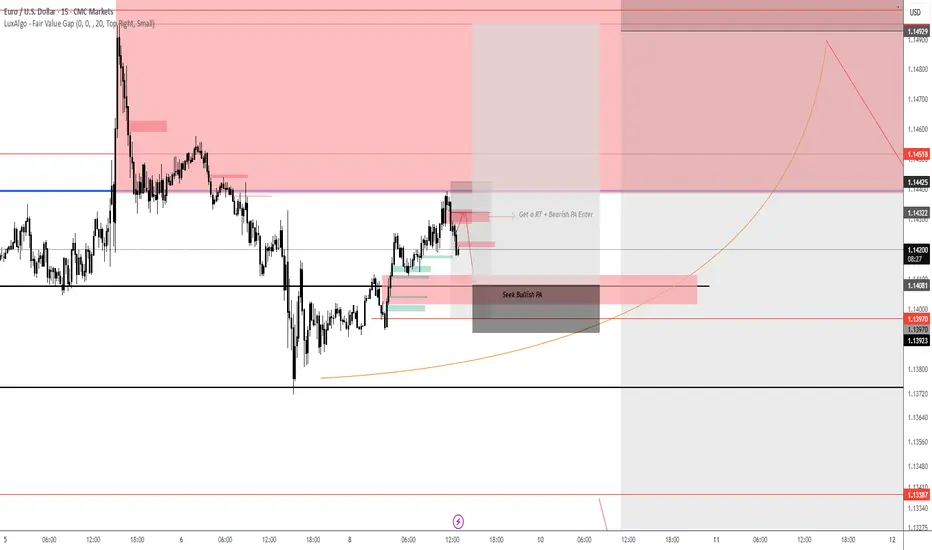
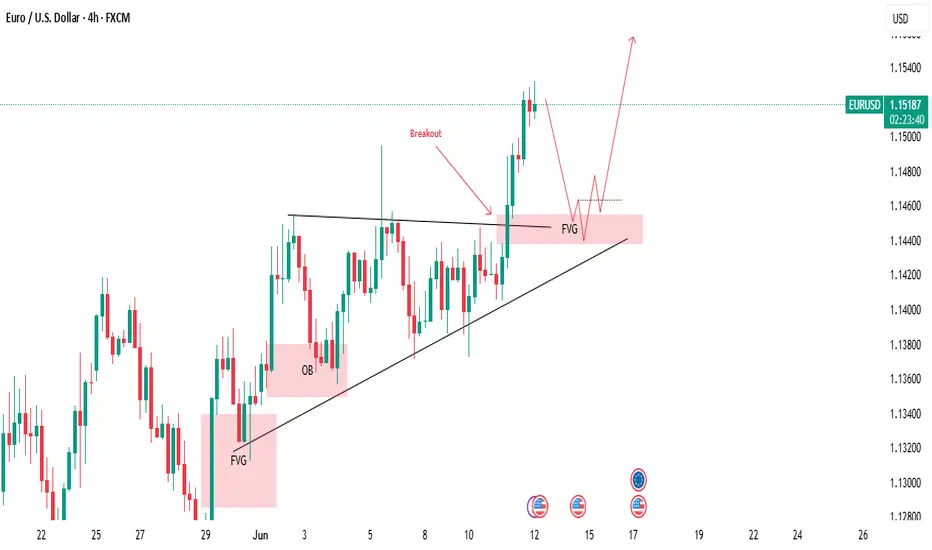
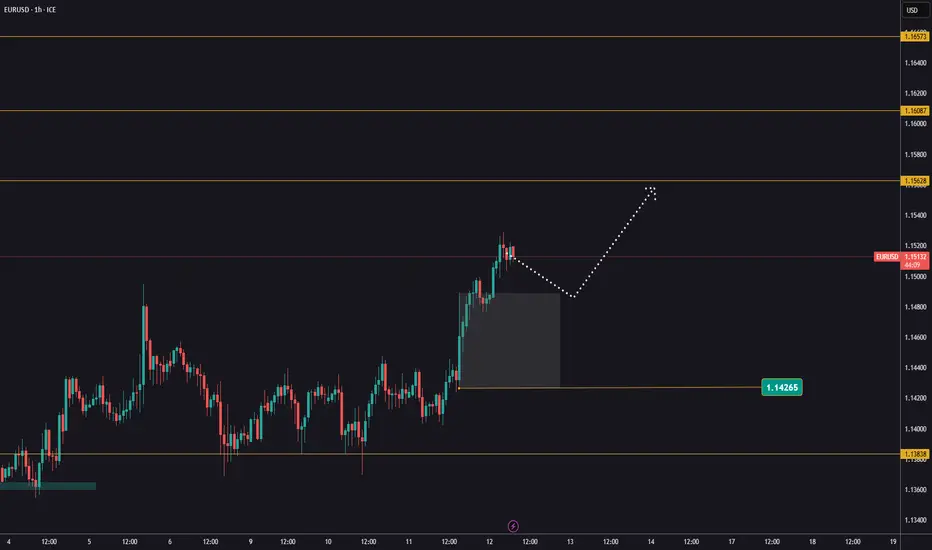
Let the market pull back toward the marked FVG.🚨 EUR/USD Traders – Eyes on This Setup! 💹
The market has been respecting a trendline over the past few days, bouncing off support and climbing steadily. 🧗♂️ While doing so, it’s also been tapping into Fair Value Gaps (FVGs)—a clear sign of smart money interest. 📊
🔥 And guess what? We’ve just seen a breakout above the trendline resistance! This could be the beginning of a strong bullish move. BUT… patience is key! 🕰️
📉 Let the market pull back toward the marked FVG zone. If it does, that could give us a golden buy opportunity with high potential upside! 🚀
🧠 Always remember: Do Your Own Research (DYOR)
📛 Not Financial Advice – Trade Smart!
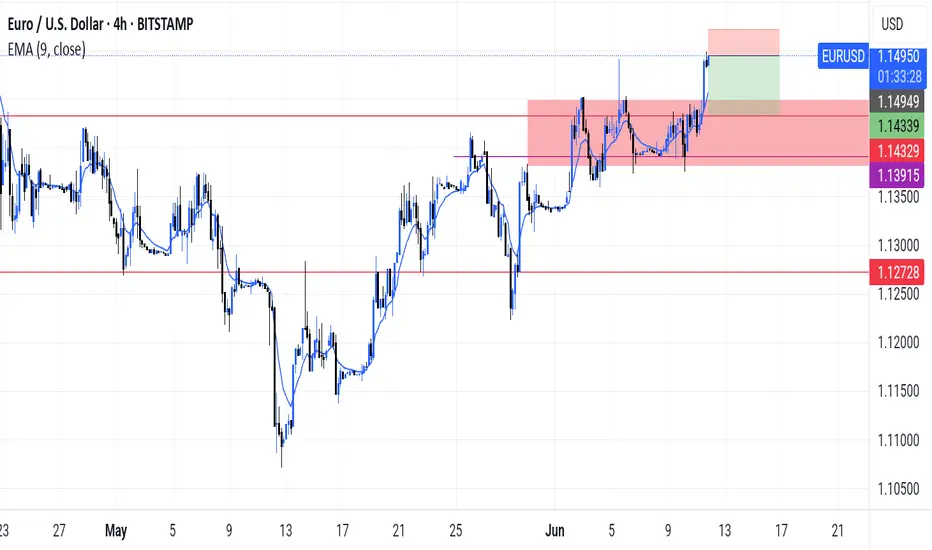
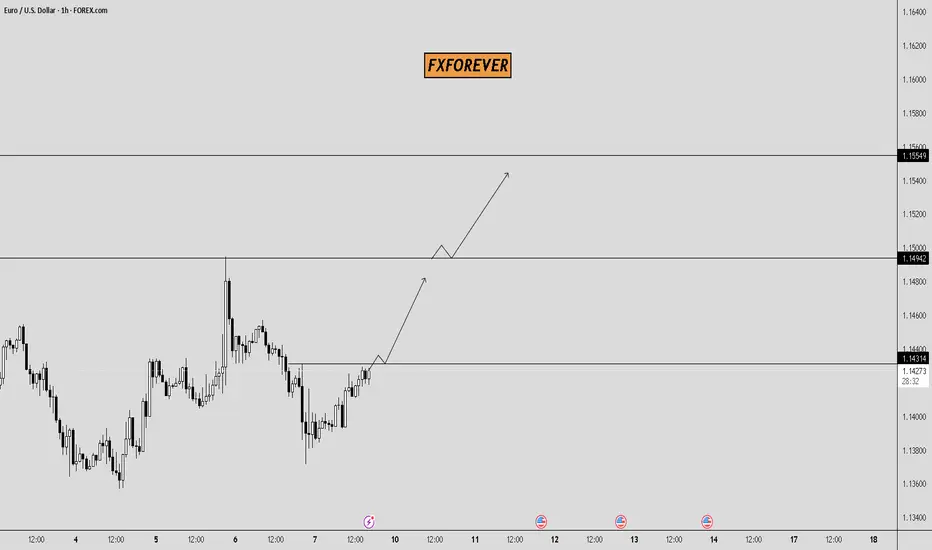
EUR/USD – Bullish Outlook (1H Chart)📈 EUR/USD – Bullish Outlook (1H Chart)
The pair is forming higher lows and pushing toward key breakout levels. Current structure supports a bullish scenario with clean targets ahead:
🔹 Key Breakout Zone: 1.14314
🔹 Next Target: 1.14942
🔹 Final Target: 1.15549
📍 Price is showing bullish momentum after reclaiming structure — if 1.14314 holds as support, we may see continuation toward the upper liquidity zones.
⚠️ Wait for confirmation on retest zones before entry.
#EURUSD #ForexForecast #FXFOREVER #PriceAction #BreakoutTrading #MarketStructure #BullishBias
USD/JPY Short, AUD/NZD Short, AUD/JPY Neutral and EUR/USD ShortUSD/JPY Short
Minimum entry requirements:
- If tight non-structured 5 min continuation forms, reduced risk entry on the break of it.
- If tight structured 5 min continuation forms, reduced risk entry on the break of it or 5 min risk entry within it.
- If tight non-structured 15 min continuation forms, 5 min risk entry within it if the continuation is structured on the 5 min chart or reduced risk entry on the break of it.
- If tight structured 15 min continuation forms, reduced risk entry on the break of it or 15 min risk entry within it.
AUD/NZD Short
Minimum entry requirements:
- If tight non-structured 15 min continuation forms, 5 min risk entry within it if the continuation is structured on the 5 min chart or reduced risk entry on the break of it.
- If tight structured 15 min continuation forms, reduced risk entry on the break of it or 15 min risk entry within it.
AUD/JPY Neutral
Minimum entry requirements:
- If structured 1H continuation forms, 1H risk entry within it.
Minimum entry requirements:
- 1H impulse down below area of value.
- If tight non-structured 5 min continuation follows, reduced risk entry on the break of it.
- If tight structured 5 min continuation follows, reduced risk entry on the break of it or 5 min risk entry within it.
- If tight non-structured 15 min continuation follows, 5 min risk entry within it if the continuation is structured on the 5 min chart or reduced risk entry on the break of it.
- If tight structured 15 min continuation follows, reduced risk entry on the break of it or 15 min risk entry within it.
EUR/USD Short
Minimum entry requirements:
- Tap into area of value.
- 1H impulse down below area of value.
- If tight non-structured 15 min continuation follows, 5 min risk entry within it if the continuation is structured on the 5 min chart or reduced risk entry on the break of it.
- If tight structured 15 min continuation follows, reduced risk entry on the break of it or 15 min risk entry within it.

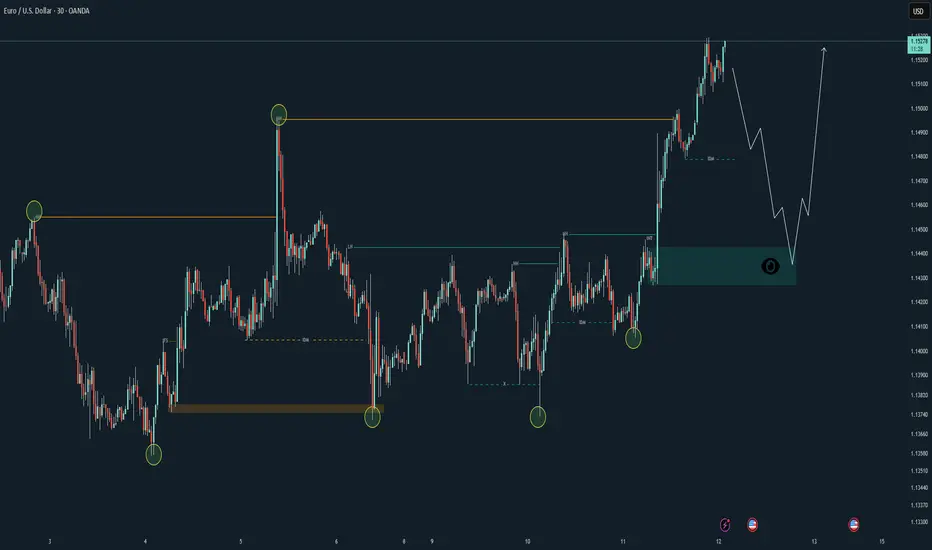
EURUSD| Riding the Real FlowInitially waited for price to return to my first POI — didn’t happen. Instead, price BOS’d and unlocked fresh liquidity. No panic. I’m not here to force old zones — I follow structure.
Now we’ve got:
✅ 4H bullish momentum still active
✅ Fresh BOS creating new intent + liquidity
✅ 30M heavy bullish push showing strength
✅ Top-down alignment from 4H → 30M → 5M
✅ Mitigation + sweep + OB entry on deck
That clean demand zone is holding value — I’m just staying patient, letting price do its thing. As always: “We sit. We wait. We strike.”
When it aligns — I’m in. Until then, I’m chilling like the sniper I am.
#SMC #JuicemannnFlow #TopDownMastery #ForexSniper #StructureTalks #InducementKing #EURUSD #RideTheMomentum #4HTo5M #LiquidityReads #FundedTraderMoves
Bless Trading!
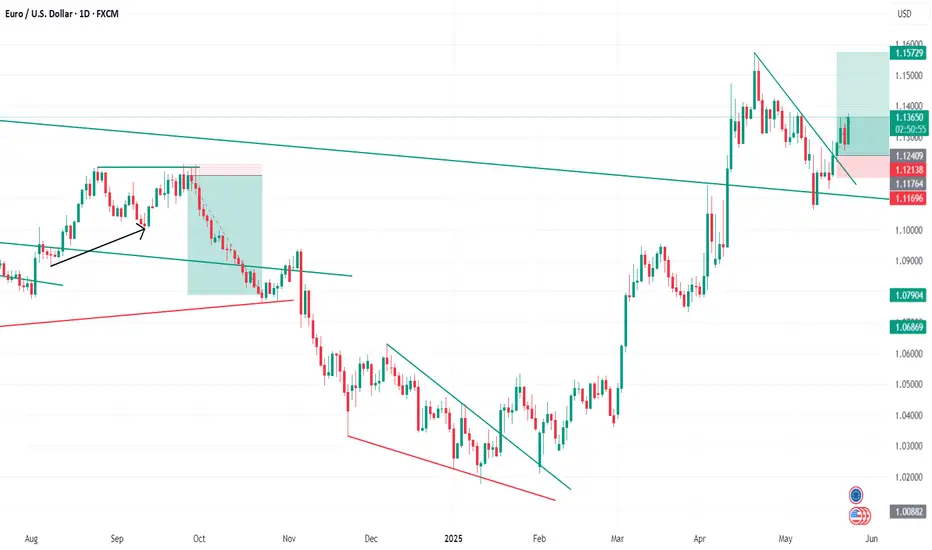
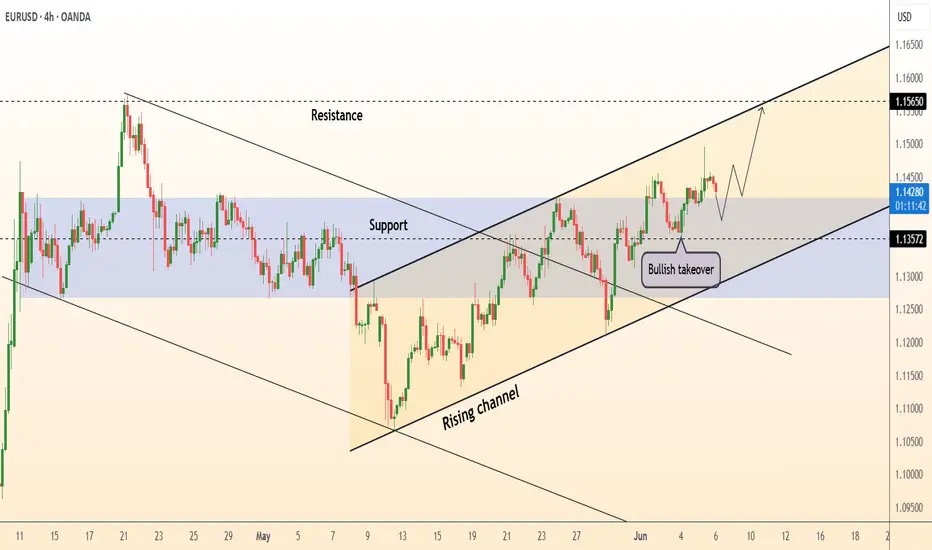
DeGRAM | EURUSD formed a bullish takeover📊 Technical Analysis
● A bullish engulfing on the grey 1.135-1.139 demand band reclaimed the inner trend-median and confirmed the base of the rising 2-month channel.
● The pull-back has just retested the broken wedge top (~1.140) as support; pattern height projects a grind to the channel mid-rail / horizontal cluster at 1.1565.
💡 Fundamental Analysis
● Ahead of the ECB’s expected “one-and-pause” 25 bp cut, EZ core CPI stayed stuck at 2.9 % y/y while soft US job-openings and lower T-bill yields narrowed the 2-yr spread, helping bids return to the euro.
✨ Summary
Long 1.137-1.140; hold above 1.135 seeks 1.156 ➜ 1.160. Invalidate on H4 close < 1.126.
-------------------
Share your opinion in the comments and support the idea with like. Thanks for your support!
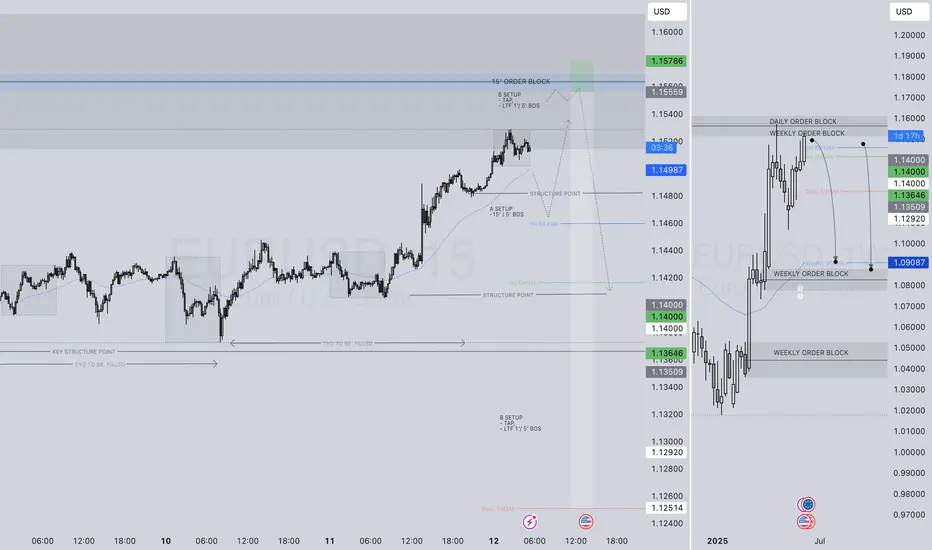
EURUSD SHORT FORECAST Q2 W24 D12 Y25EURUSD SHORT FORECAST Q2 W24 D12 Y25
Professional Risk Managers👋
Welcome back to another FRGNT chart update📈
Diving into some Forex setups using predominantly higher time frame order blocks alongside confirmation breaks of structure.
Let’s see what price action is telling us today!
💡Here are some trade confluences📝
✅Weekly order block
✅15' order block
✅4 hour order block
✅Tokyo ranges to be filled
🔑 Remember, to participate in trading comes always with a degree of risk, therefore as professional risk managers it remains vital that we stick to our risk management plan as well as our trading strategies.
📈The rest, we leave to the balance of probabilities.
💡Fail to plan. Plan to fail.
🏆It has always been that simple.
❤️Good luck with your trading journey, I shall see you at the very top.
🎯Trade consistent, FRGNT X
EURUSD After the NewsEURUSD continues its bullish trend, posting new gains following yesterday’s important news.
The next resistance levels are at 1,1562, 1,1608, and 1,1657.
Watch for a potential continuation of the trend and buying opportunities after a pullback.
The next key news events that could impact the market are scheduled for June 18th.
EURUSD - TECH. 2Hello Traders! It's Nika.
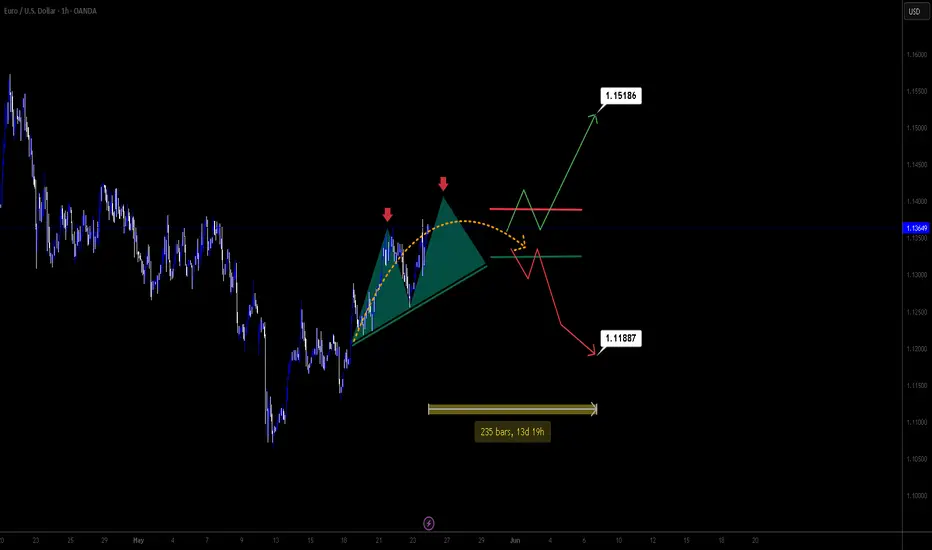
In this technical work, as we see here, there is a few things happening at the same moment.
First thing to focus on is that we have formatting double double-head acceding triangle.
We need wait or also go short for that with small time period. After that my prediction is the price will enter that channel in price range 1.13917 - 1.13247. So, after that we can wait for the market price confirmation and only after going Buy or Sell.
After all, what we got here is two good options.
1. Open short when market will open until the price will hit "Double-head acceding triangle" bottom.
2. Go into the position after a few days, when the price will enter & left channel range 1.13917 - 1.13247.
In long time period sell and buy probability, there is price marks on chart! So, you can use it as your TP.
Thank you!
Have a profitable day. :)
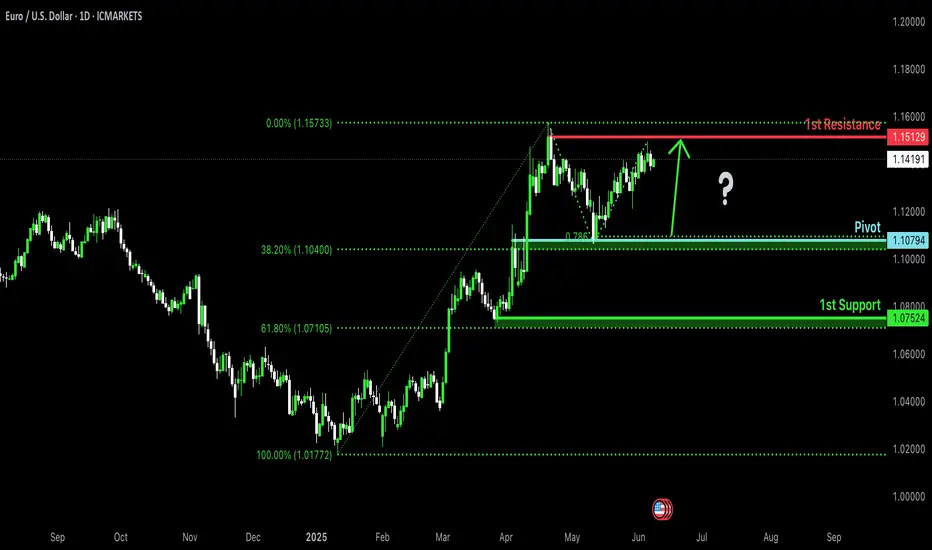
Bullish momentum to extend?The Fiber (EUR/USD) is falling towards the pivot which is a pullback support and could bounce to the 1st resistance which is also a pullback resistance.
Pivot: 1.1079
1st Support: 1.1075
1st Resistance: 1.1512
Risk Warning:
Trading Forex and CFDs carries a high level of risk to your capital and you should only trade with money you can afford to lose. Trading Forex and CFDs may not be suitable for all investors, so please ensure that you fully understand the risks involved and seek independent advice if necessary.
Disclaimer:
The above opinions given constitute general market commentary, and do not constitute the opinion or advice of IC Markets or any form of personal or investment advice.
Any opinions, news, research, analyses, prices, other information, or links to third-party sites contained on this website are provided on an "as-is" basis, are intended only to be informative, is not an advice nor a recommendation, nor research, or a record of our trading prices, or an offer of, or solicitation for a transaction in any financial instrument and thus should not be treated as such. The information provided does not involve any specific investment objectives, financial situation and needs of any specific person who may receive it. Please be aware, that past performance is not a reliable indicator of future performance and/or results. Past Performance or Forward-looking scenarios based upon the reasonable beliefs of the third-party provider are not a guarantee of future performance. Actual results may differ materially from those anticipated in forward-looking or past performance statements. IC Markets makes no representation or warranty and assumes no liability as to the accuracy or completeness of the information provided, nor any loss arising from any investment based on a recommendation, forecast or any information supplied by any third-party.
euro/usdtrade 5 entry point i belive a reversal is in order if its not it will break the stoplloss and use the resitance as surport and we will then jump on for the bullish but my eye is for it to be bearish right now