Eurusd Buyprice is bullish on the Daily and 4hr tf. on the 1hr it is exiting the Daily demand zone and recently bounced off the 1hr trendline. price is currently around 4hr poi which may help give us fuel to move to the 1hr poi and above targeting next Daily key level.
USDEUX trade ideas

EURUSD - Mark up for the rest of the weekAfter the CPI data was released today we had a lovely upside move. The move has caused us to trade into the previous weak higher timeframe high which I am hoping we can break and close above before the day is out.
I am now focusing on what kind of pullback we may get into out POI's. Because there is no buy side liquidity on the first POI I will need to see a structural shift on the 15min TF to confirm that internal structure swing to move back towards the upside.
If the 1st POI fails to hold I will be more aggressive with my secondary POI as that will be the premium discount price in order for us to move higher.
If that POI fails and we break the 4H structure swing then this could signal we are about to move lower.
If I can be of any assistance to anyone don't be shy to give me a message

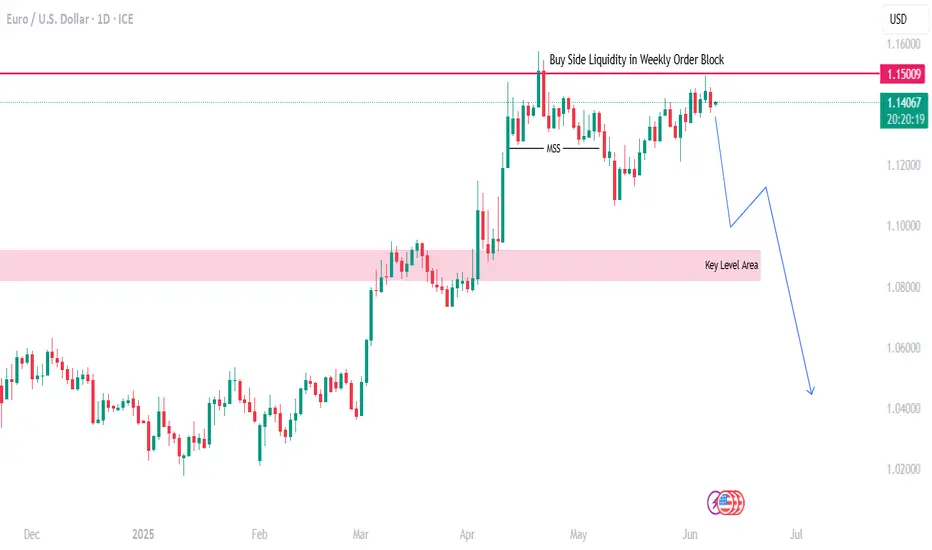
EUR USD Daily TF Bearish MovementBased on Weekly Time Frame it's time to EURUSD for bearish movement after weekly candlestick reject on Weekly OB after making Buy side Liquidity.
EURUSD: Will Go Up! Long!
My dear friends,
Today we will analyse EURUSD together☺️
The in-trend continuation seems likely as the current long-term trend appears to be strong, and price is holding above a key level of 1.14821 So a bullish continuation seems plausible, targeting the next high. We should enter on confirmation, and place a stop-loss beyond the recent swing level.
❤️Sending you lots of Love and Hugs❤️
Important EURUSD UpdateYesterday, EURUSD continued to move sideways, with the market waiting for key news.
Today at 1:30 p.m. (London time), U.S. inflation data will be released.
This report has a strong impact and is likely to determine the next major move.
It is advisable not to open any new positions before the news is published.
Fiber holds Bullish (but not for long)## 1 Hour (Intraday)
!
1. **Order-block / Fair-Value Gap**
* The small 1H consolidation you’ve boxed (roughly 1.1420–1.1450) is a late-hour fair-value gap (FVG) that often resolves with a quick run to its edge.
* A drop into the lower end (1.137–1.138) gives you liquidity for your long and aligns with the 1D 50 % retrace (1.13475).
2. **Pending Entries**
* **Buy-limit @ 1.1300**: Still unfilled. If price dips there, it converges the 1D 62 %–70.5 % zones (1.1312–1.1287) plus the old daily high → high-probability long.
* **Sell-limit @ 1.1600**: Above today’s high, overlapping the 6 M FVG at 1.1575 and the 3 M opposing block.
3. **Probability & Timeline**
* **To 1.1300**: \~30 % shot over the next 24–48 h as banks chase stops under 1.135.
* **To 1.1600**: \~25 % chance intraday if FOMC jitters push USD weaker post-June 18.
---
## 1 Month (Position)
!
1. **Longer-term Fib & Time-zones**
* The full trough-to-peak fib (0 %→100 %) defines the 127 % extension at \~1.310, 227 % at \~1.214, 327 % at \~1.246.
* Your current clip sits just above the 127 % (1.310) retracement zone on a mini scale; the next *real* hurdle is the 227 % zone near 1.214/1.234 (old highs).
2. **Macro-Blocks**
* **3-month OB @1.1600**, **6-month FVG @1.1575**: your first “stop‐runs” on the way to the big opposing block at 1.2750 (500 %).
* Seasonal tailwinds tend to kick in around July–August as EU carry trades re-enter.
3. **Timeline & Odds**
* **Lift into 1.1575–1.1600**: \~60 % chance by late June → early July.
* **Extension toward 1.214–1.234** (long-term target): \~30 % chance by Q4 2025, assuming US yields peak and EUR carry resumes.
---
### Live-Data Check (Today ≈ 1.1415)
* **Above 1.1375** (daily 50 %) → bullish tilt until proven otherwise.
* **Below 1.1450** (1H FVG top) → still in consolidation zone; gives you a low-risk long if you see a wick down to 1.137–1.138.
* **No invalidation**: you’ve got room to run both your buy and sell limits without being stopped out today.
---
## Overall Probability & Path
| Leg | Zone | Prob. | Target Window |
| -------------- | --------------------------- | ----- | -------------- |
| Intraday sweep | 1.137→1.145 consolidation | 70 %↑ | next 1–2 days |
| Buy-zone test | 1.1300 (62–70 % daily fib) | 30 % | next 24–48 h |
| Swing rally | 1.1575–1.1600 (6 M FVG/OB) | 55 % | June 18–July 5 |
| Position drive | 1.214–1.234 (227–327 % fib) | 30 % | Q3–Q4 2025 |
1. **Catalysts**:
* **June 18 FOMC** (watch the red line) will likely ignite the swing leg.
* **July seasonal flows** (month-end rebalancing) give the first bump into your fair-value blocks.
2. **Risk management**:
* Keep your stops below 1.1340 for intraday longs, or below 1.1250 for the monthly swing.
* Scale out 50 % at 1.1575, trail the rest into the big opposing block.
---
— S.Atrial

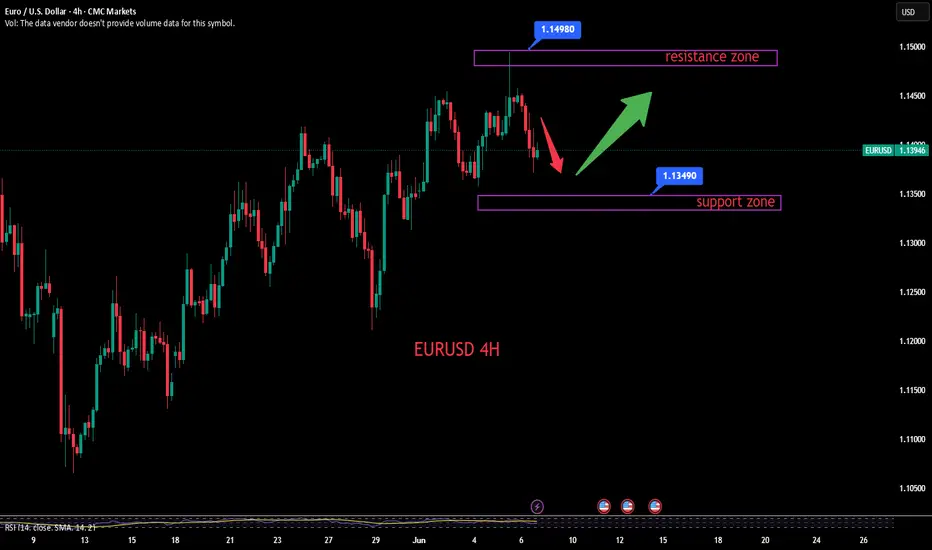
EURUSD:Sharing of the Trading Strategy for Next WeekAll the trading signals this week have resulted in profits!!! Check it!!!👉👉👉
Fundamental Analysis:
Easing EU-U.S. trade tensions have provided support for the euro, though the stability of the eurozone's economic recovery remains uncertain—subsequent economic data will influence EUR dynamics. Markets are closely monitoring U.S. economic indicators and Federal Reserve policy: weak data or dovish signals could weaken the USD, benefiting EUR/USD.
Technical Analysis (4-Hour Chart):
MACD: Positive histogram shrinking, indicating diminishing bullish momentum and a non-trending market environment.
Price-Volume Divergence: Rising prices accompanied by declining trading volumes signal insufficient upward momentum.
KDJ: Reading of 95 suggests overbought conditions.
Key Levels: Resistance at 1.1461 (upper Bollinger Band), support at 1.1300.
Trading Recommendation:
Consider light long positions near 1.1350 on price retracement.
Trading Strategy:
buy@1.13500-1.13550
TP:1.14500-1.15000
Share accurate trading signals daily—transform your life starting now!
👇 👇 👇 Obtain signals👉👉👉
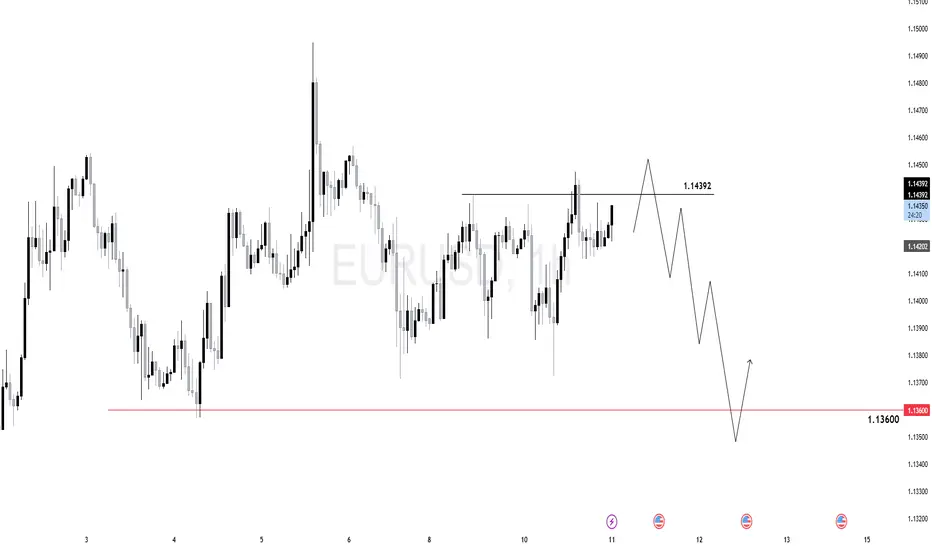
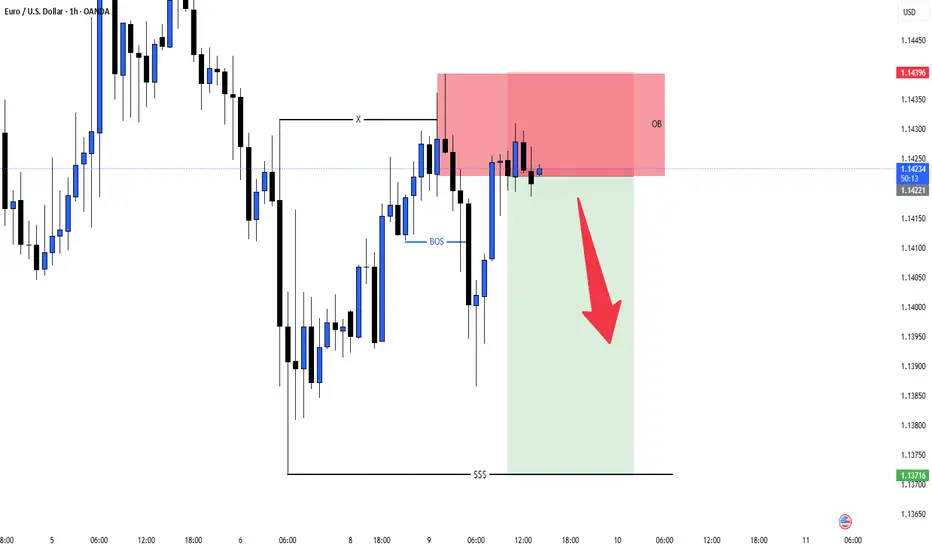
$EU (EURUSD) 1H AnalysisBias: Bearish after liquidity grab at 1.14392
Setup: Wait for the sweep ➤ BOS ➤ Enter short
Target: 1.13600
Price is forming a range-bound consolidation, but the internal structure shows liquidity building below and above.
The market seems poised to run the 1.14392 high, grabbing buy stops above the short-term high.
After that sweep,i see a rejection and shift in order flow, setting up a bearish leg.
Key POIs :
Sweep Zone: 1.14392 (Buy-side liquidity)
Sell Target: 1.13600 zone – a clear sell-side liquidity draw
The red line marks an untapped liquidity pool, aligning with a previous support level.
Trade Idea (Short Bias) :
Let price sweep the 1.14392 high, form a bearish shift (change of character).
Ideal entry after confirmation of rejection.
Target: 1.13600
Invalidation: Clean break and close above 1.14500
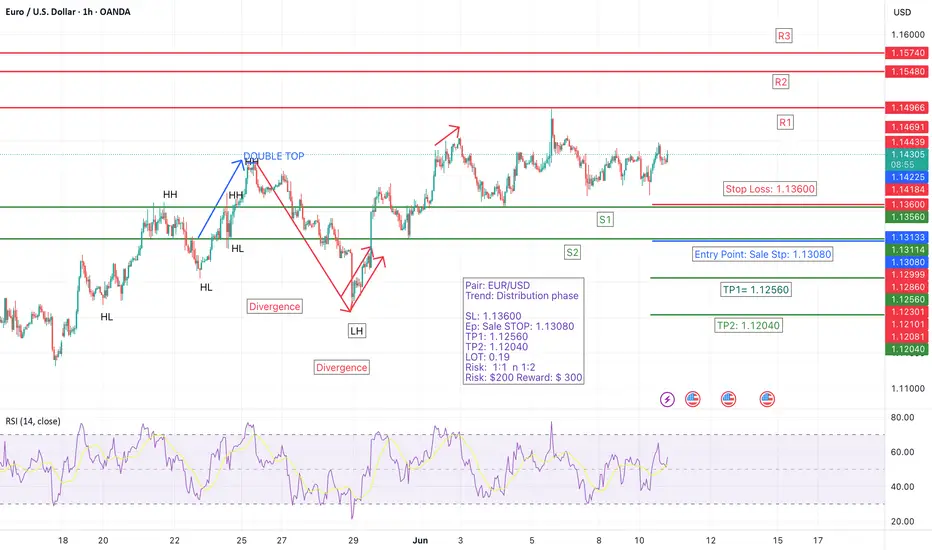
EUR/USD – 1H Chart SetupMarket Phase: Distribution
Trade Bias: Bearish Breakdown
We’re currently observing a distribution phase on EUR/USD, with well-defined support and resistance levels. A breakdown below Support Level 2 will trigger our short entry, confirming bearish momentum.
📌 Trade Setup Details:
🔹 Entry (Sell Stop): 1.13080
🔹 Stop Loss (SL): 1.13600 (above Support Level 1)
🔹 Take Profit 1 (TP1): 1.12560
🔹 Take Profit 2 (TP2): 1.12040
🔹 Lot Size: 0.19
🔹 Risk/Reward Ratios: 1:1 and 1:2
🔹 Risk: $200 💸
🔹 Reward: Up to $300 💰
This setup is based on a clean structure break, expecting downside continuation after the distribution completes. We’ve marked the key zones on the chart and are waiting for confirmation through a support break.
Keep an eye on price action and volume near the entry to validate the breakdown.
#EURUSD #ForexTrading #BearishSetup #DistributionPhase #PriceAction #SupportResistance #TradeSetup #RiskReward #BreakdownTrade #ForexSignals #1HChart
Unlock more with Plus
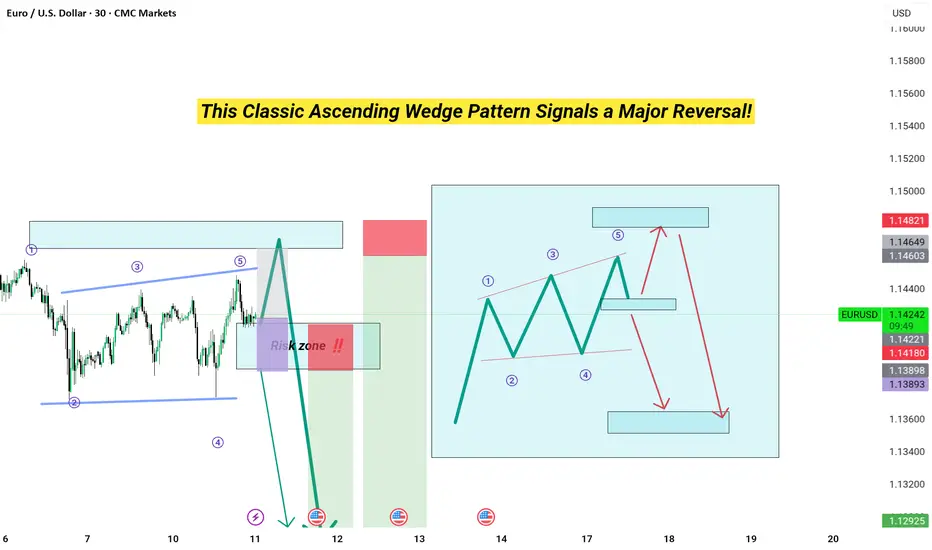
Eurusd !!! Ascending Wedge Pattern Signals a Major Reversal! Time': 30 min
Technical analysis:
Ascending Wedge Pattern 📈: A clear ascending wedge signals a potential bearish reversal. The price has just completed Wave ⑤ at the top trendline, a classic trigger point for sellers.
* Elliott Wave Confirmation 🖐️: The wedge contains a perfect 5-wave Elliott structure, reinforcing our bearish bias as the final impulse wave concludes.
* Live vs. Textbook 👨🏫: Our live chart is mirroring the ideal "textbook" example shown, increasing confidence in the setup's validity.
The Trade Plan 🎯
* Entry ▶️: Short position initiated in the "Risk Zone" after rejection from the wedge resistance.
* Stop Loss ⛔️: Placed tightly above the Wave ⑤ high at ~1.14821.
* Take Profit 💰: Targeting the major support level at ~1.12925.
Conclusion ✨
This setup presents an exceptional risk-to-reward ratio. The combination of a reliable chart pattern and Elliott Wave count gives us a high-conviction bearish outlook for EUR/USD.
Disclaimer ⚠️: This is a technical idea, not financial advice. Always use proper risk management. Trade safe!
EURUSD: Bears Are Winning! Short!
My dear friends,
Today we will analyse EURUSD together☺️
The recent price action suggests a shift in mid-term momentum. A break below the current local range around 1.14198 will confirm the new direction downwards with the target being the next key level of 1.13966.and a reconvened placement of a stop-loss beyond the range.
❤️Sending you lots of Love and Hugs❤️
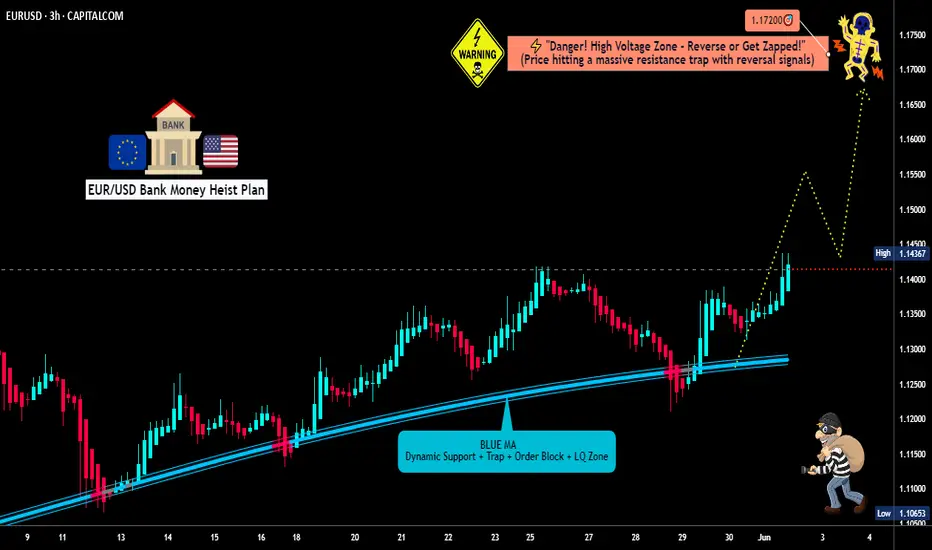
SNATCH & RUN: EUR/USD Long Setup (High-Risk Loot Zone)🔥 EUR/USD Heist: Bullish Loot Before the Trap! (Thief Trading Strategy) 🔥
🌟 Hi! Hola! Ola! Bonjour! Hallo! Marhaba! 🌟
Attention, Money Makers & Market Robbers! 🤑💰💸✈️
Based on the 🔥Thief Trading Style🔥, here’s our master plan to loot the EUR/USD "The Fiber" Forex Market! Follow the strategy on the chart—Long Entry is key. We’re targeting the high-risk Red Zone: overbought, consolidating, and primed for a reversal. Beware the trap—bulls must strike fast before bears ambush! 🏆💸
"Take the profit and treat yourself, trader. You deserve this heist!" 💪🎉
🚪 Entry Point (The Vault is Open!)
📈 "Swipe the bullish loot at any price—the heist is LIVE!"
Pro Tip: Use Buy Limit orders within a 15-30 min timeframe (recent swing low/high). ALERTS ARE A MUST!
🛑 Stop Loss (Escape Route)
Thief SL at nearest swing low (1.12500) on the 3H timeframe (Day/Swing trade).
Adjust based on your risk, lot size, and multiple orders.
🎯 Target (Loot & Scoot!)
🎯 1.17200 (or escape earlier if the cops show up!)
⚡ Scalpers’ Quick Grab
👀 Only scalp LONG!
Big wallets? Raid straight in.
Small stacks? Join swing traders for the robbery.
Use Trailing SL to protect your stolen cash! 💰
📢 Why This Heist? (EUR/USD Bullish Momentum)
"The Fiber" is heating up! Key drivers:
Fundamentals (COT Reports, Macro Data)
Sentiment & Intermarket Trends
Future Targets & Score Outlook
🔗 Want the full intel? Check our bio0 for linkks! 👉👉
⚠️ Trading Alert: News = Danger! 📰🚨
News releases = volatility spikes! Protect your loot:
❌ Avoid new trades during news.
🔒 Use Trailing SL to lock profits.
💖 Support the Heist Crew!
💥 Smash the Boost Button! 💥
More boosts = easier money steals!
Strengthen our robbery squad!
Every day is a heist—profit with Thief Trading Style! 🏆🚀
Stay tuned for the next robbery plan! 🤑🐱👤🤩
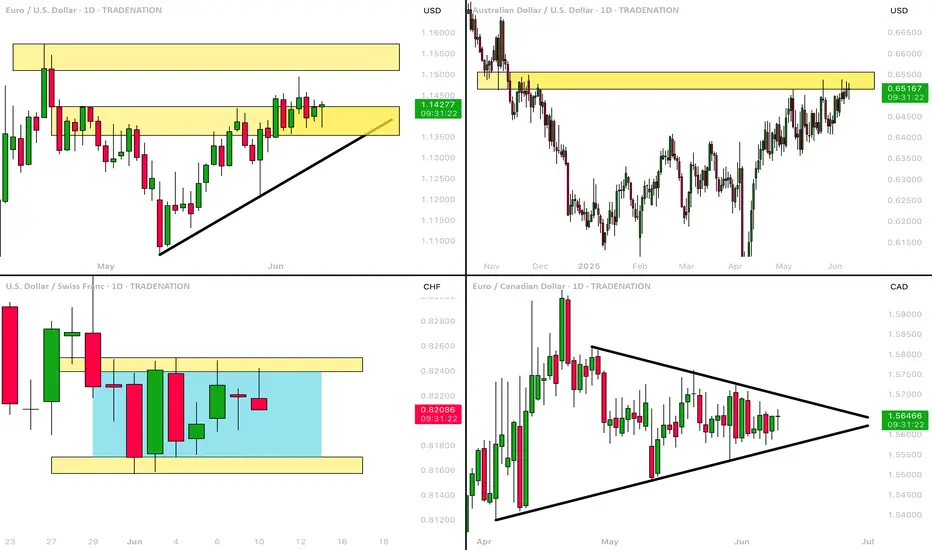
MarketBreakdown | EURUSD, AUDUSD, USDCHF, EURCAD
Here are the updates & outlook for multiple instruments in my watch list.
1️⃣ #EURUSD daily time frame 🇪🇺🇺🇸
Though the pair remains quite weak for the last few days,
I strongly believe that bulls have unrealized potential.
The pair may continue rising and reach the underlined yellow resistance soon.
2️⃣ #AUDUSD daily time frame 🇦🇺🇺🇸
The price is testing a significant horizontal resistance.
Its bullish breakout will provide a strong bullish signal.
The pair will go way higher then.
3️⃣ #USDCHF daily time frame 🇺🇸🇨🇭
The price is stuck within a narrow consolidation range.
I think that a sideways movement is going to continue
and the price will drop to the support of the range soon.
4️⃣ #EURCAD daily time frame 🇪🇺🇨🇦
The price action is contracting within a symmetrical triangle pattern.
Such a pattern signifies a deep indecision.
A breakout of one of its boundaries will indicate the side of the next market move.
Do you agree with my market breakdown?
❤️Please, support my work with like, thank you!❤️
I am part of Trade Nation's Influencer program and receive a monthly fee for using their TradingView charts in my analysis.
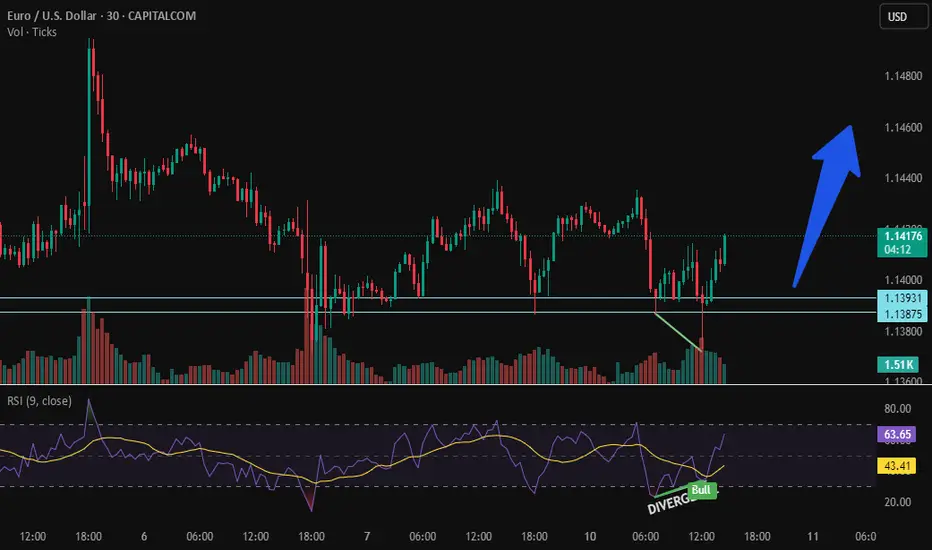
EURUSD - Bulls LoadingEURUSD has printed solid divergence on RSI. A volume supported pin bar and order block at support suggests bullish reversal has taken place. Fundamentally too fiscal stimulus package in euro zone might prevent EUR from falling further.
EURUSD SHORTeurusd short bearish price action.price rejected from the resistance thrice and continue pushing bearish.expecing more continuation of the bearish movement

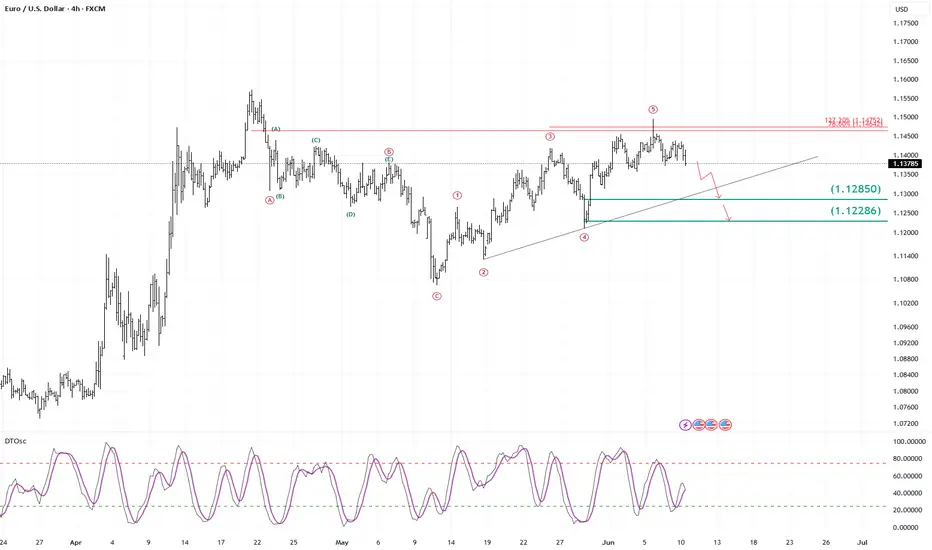
EUR/USD – Bearish Setup with Potential Drop Toward 1.1285 and 1.EUR/USD is showing signs of exhaustion near the 1.1475 Fibonacci extension level (127.2%), with a completed five-wave impulse pattern likely followed by an ABC correction.
🔻 Bearish Scenario:
A clear 5-wave Elliott structure suggests a top might be in.
Price is now losing momentum, indicating the start of a corrective move.
If selling continues, 1.12850 will be the first key level to watch.
A break below that could open the door for a deeper correction toward 1.12286.
📉 Momentum Support:
The Detrended Oscillator shows a loss of bullish momentum, aligning with the corrective structure expectation.
🔴 Invalidation:
A break back above 1.1475 would invalidate the bearish count and suggest trend continuation.
This setup favors short opportunities on breakdown confirmation with targets at the next major supports.
Based on the provided EURUSD 4-hour chart, here's a simple tradeCurrent Situation:
The price is currently at 1.13869, trading within a resistance zone (indicated by the pink shaded area around 1.13700 - 1.14000).
Previously, the price reacted strongly to this area, leading to a significant drop.
There's a clear upward trend leading into this resistance zone.
Potential Trade Scenarios:
1. Short Entry (Bearish Reversal):
Rationale : The price is at a significant resistance level that has caused a strong bearish reaction in the past. If this resistance holds, we could see a repeat of the previous downtrend.
Entry Signal: Look for clear bearish candlestick patterns (e.g., engulfing pattern, pin bar, or rejection candle) forming within or just below the resistance zone (around 1.13700 - 1.14000) . A break and retest of the lower boundary of this resistance could also be an entry.
Target: The next major support zone appears to be around 1.11748 - 1.12000.
Stop Loss: Place the stop loss just above the current resistance zone, perhaps around 1.14200 - 1.14500 , to account for potential false breakouts.
2. Long Entry (Bullish Breakout Continuation):
Rationale: If the current bullish momentum is strong enough to break through this resistance, it could signal a continuation of the upward trend.
Entry Signal: Wait for a confirmed breakout above the resistance zone (e.g., a 4-hour candle closing clearly above 1.14000 - 1.14200). A retest of the broken resistance as new support would offer a higher-probability entry.
Target: The next major resistance level is not immediately visible on this chart, but you would look for the next supply zone or previous swing highs.
Stop Loss: Place the stop loss below the broken resistance, which would now act as support, perhaps around 1.13500.
Key Considerations Before Entry:
Confirmation: Do not enter solely based on the price reaching the zone. Always wait for a clear candlestick confirmation or a break and retest.
Volume (if available): Higher volume on a breakout or rejection can add conviction to the move.
News Events: Be aware of any upcoming high-impact news events that could affect EURUSD.
Risk Management: Always define your stop loss and position size before entering any trade.

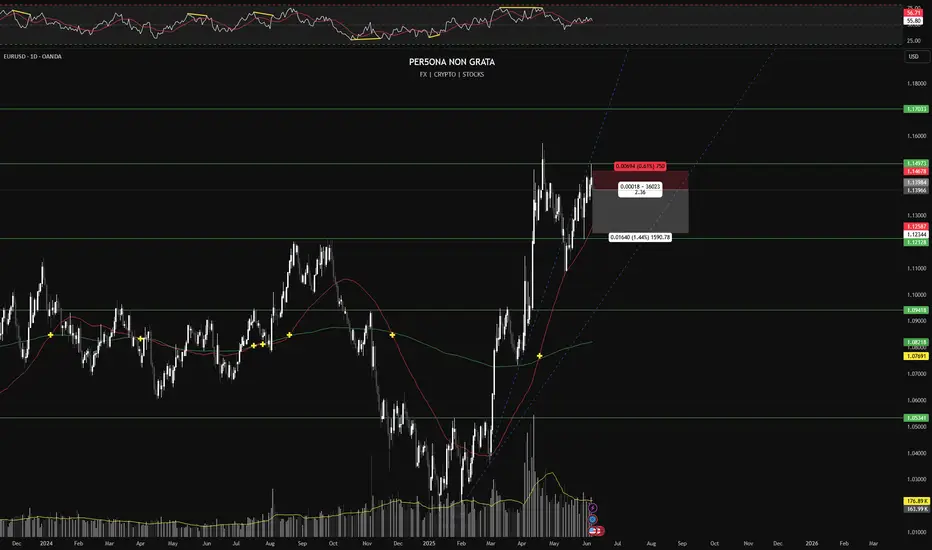
SHORT | EUR/USD | 1DMacro: Dollar strength likely as uncertainty grows from USD economic data; ECB expected to trim dovish tone next week.
Structure: In consolidation after reaching envelope top (~1.1494); forecasting downside to 1.1387–1.1400.
Trigger & Execution:
• Entry: Short on break below 1.1380
• Stop: 1.14678
• Target: 1.12344
• R:R: ~1:2.36
Rationale: Profit-taking above envelope top supports pullback; structural risk limit remains.
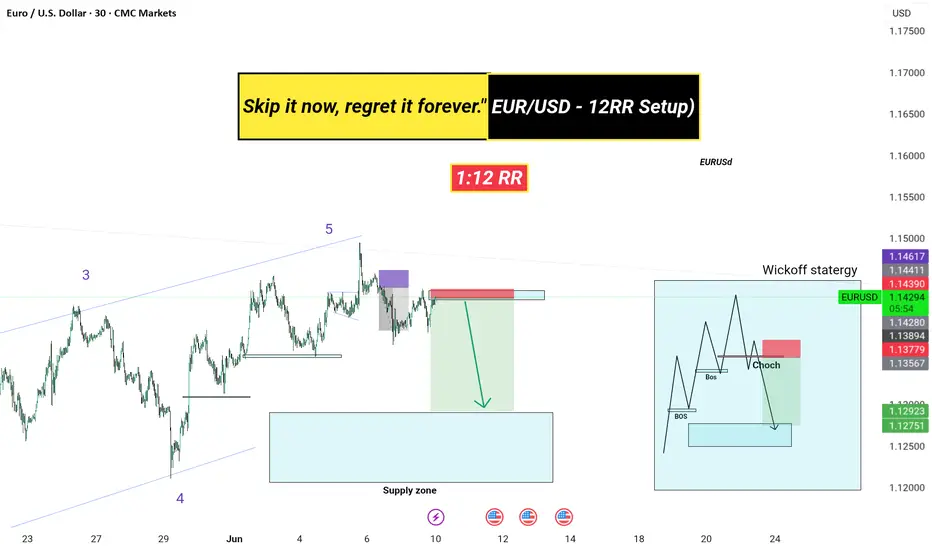
EUR/USD !!! ( 12RR Setup) Once in while opportunity : EUR/USD
Timeframe: 30M
Strategy: Elliott Wave + Wyckoff Structure
Risk-Reward: 1:12
Toolset: Supply Zone, Change of Character (ChoCh), Break of Structure (BoS), Entry Refinement
📈 Analysis Summary:
Price completed Wave 5 of the Elliott Wave structure.
Clear supply zone rejection near previous high – strong confluence.
Break of structure (BoS) confirms bearish bias.
A clean ChoCh (Change of Character) signals the shift from bullish to bearish.
Perfect Wyckoff schematic distribution playing out.
Entry taken from mitigation block with tight SL above zone.
Targeting higher-timeframe demand zone (highlighted in blue box).
💡 Key Zones:
Entry: Red mitigation zone
SL: Above local high
TP: Demand zone zone (RR 1:12)
📅 Watch this level around June 10–14 — expecting a strong impulsive move downward.
Comment ‘🔥’ if you caught this early.
EURUSD: Local Bullish Bias! Long!
My dear friends,
Today we will analyse EURUSD together☺️
The recent price action suggests a shift in mid-term momentum. A break above the current local range around 1.14158 will confirm the new direction upwards with the target being the next key level of 1.14327 and a reconvened placement of a stop-loss beyond the range.
❤️Sending you lots of Love and Hugs❤️
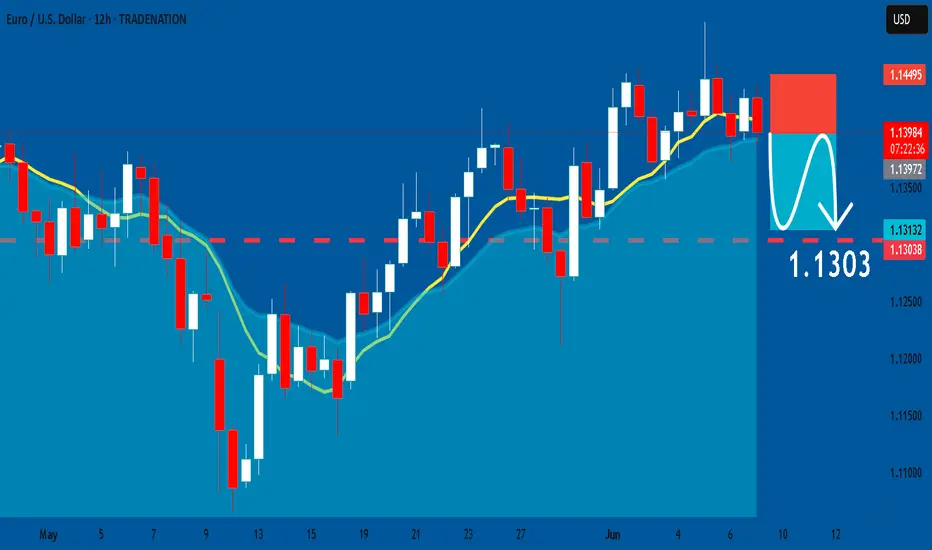
EURUSD: Short Trade Explained
EURUSD
- Classic bearish pattern
- Our team expects retracement
SUGGESTED TRADE:
Swing Trade
Sell EURUSD
Entry - 1.1398
Stop - 1.1449
Take - 1.1303
Our Risk - 1%
Start protection of your profits from lower levels
Disclosure: I am part of Trade Nation's Influencer program and receive a monthly fee for using their TradingView charts in my analysis.
❤️ Please, support our work with like & comment! ❤️