EURUSDEURUSD,the structure is showing a buy trend and traders will have to follower the price action on day to day bases .
USDEUX trade ideas

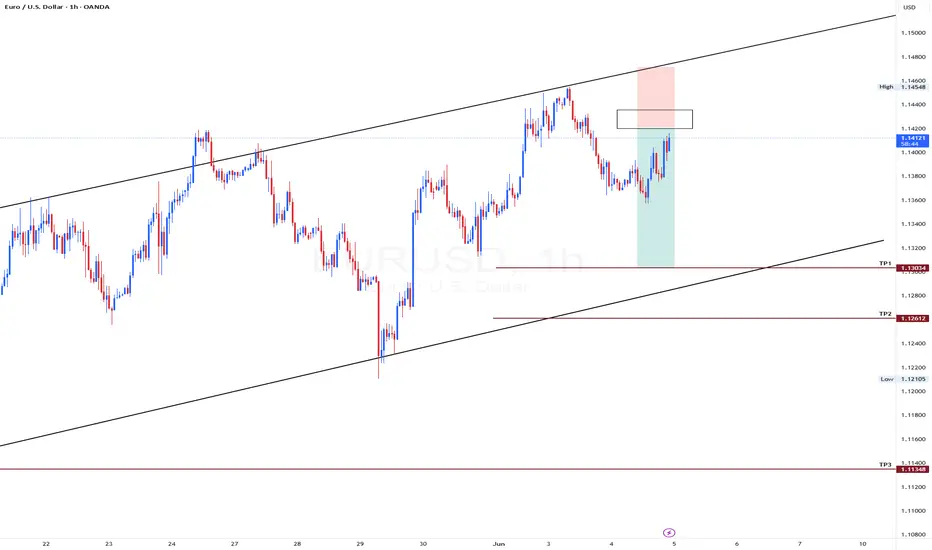
EURUSD - Look for Short (SWING) 1:2.5!Price has formed an ascending channel on the higher time frame, currently consolidating before potentially entering a distribution phase. A breakout could occur in either direction, but if the chart pattern plays out as expected, we may see a break below the key support level. Let’s aim for at least TP1.
Disclaimer:
This is simply my personal technical analysis, and you're free to consider it as a reference or disregard it. No obligation! Emphasizing the importance of proper risk management—it can make a significant difference. Wishing you a successful and happy trading experience!
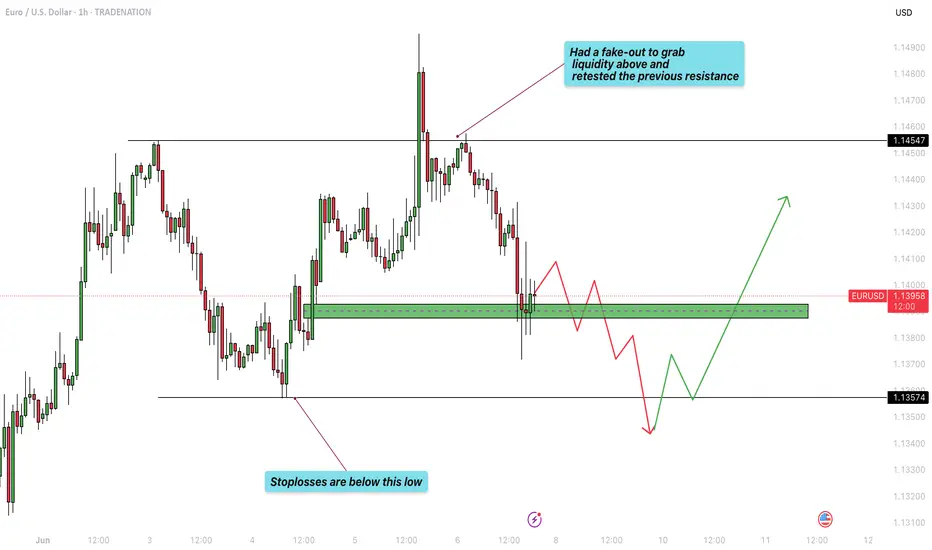
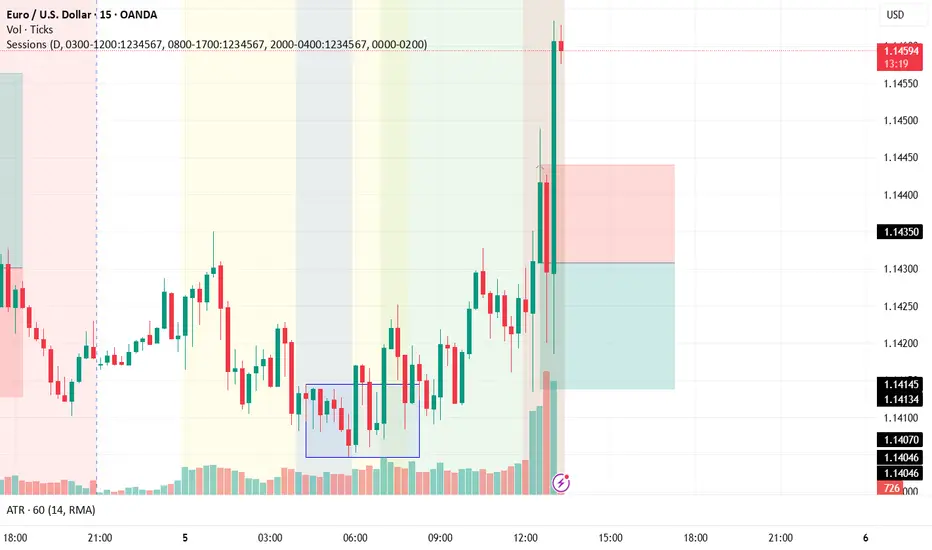
EUR/USD - After taking the highs, are the lows next?The EUR/USD currency pair is moving between two important price levels. The top level is 1.1454 and the bottom level is 1.1357. This means the price is staying inside a range. Yesterday, the price of EUR/USD went above the top level of 1.1454. By doing this, it triggered many stop-loss orders from traders who were expecting the price to go down. These traders had placed their stop-losses just above this level, and the market moved up to take them out.
Current support of the 1H FVG
Now, the price is starting to go down again. It is getting closer to the lower level of the range, which is around 1.1357. There is a chance that the market will go below this level as well. If that happens, it may take out the stop-loss orders of traders who are expecting the price to go up. These traders often place their stop-losses just below the low point of the range. When the market goes below the low, it collects liquidity. In simple words, it grabs the orders that are waiting there.
Looking at the chart, we can see that EUR/USD has found some support at the 1-hour Fair Value Gap (1H FVG). This area is acting like a short-term floor for the price. If a full 1-hour candle closes below this support area, then the price will likely fall further. In that case, it may reach the bottom of the range and possibly move below it to take out more stop-losses.
Why below support?
But why would the market go below the low on purpose? The reason is that many retail traders, those are small traders who trade from home, often put their stop-losses just below the recent low. If the market moves there, it activates those stop-losses. These stop-losses are usually sell orders, and when they get triggered, it gives the market extra selling power. After collecting this liquidity, the market often uses the new buying interest (from other traders entering long positions) to push the price back up again.
Conclusion
So in summary, the EUR/USD is still inside a range. It has already moved above the top to take out stop-losses, and now it might go below the bottom to do the same. After that, there could be a strong move upward, powered by the new liquidity in the market.
Disclosure: I am part of Trade Nation's Influencer program and receive a monthly fee for using their TradingView charts in my analysis.
Thanks for your support.
- Make sure to follow me so you don't miss out on the next analysis!
- Drop a like and leave a comment!
EUR/USD Bulls Fail to Press 1.1500 - Builds Possible Lower-HighFor EUR/USD it's what didn't happen this week...
Despite a seemingly open door for bulls to run a breakout, helped along by a Christine Lagarde that sounded less dovish than usual at Friday's rate cut, the pair put in a hard charge towards the 1.1500 handle but interestingly fell just about 5 pips short of the big figure. That's the same price that helped to bring a pullback back in April but in that instance, bulls were able to force a test above - and this time, it's as if sellers were waiting at the ready - and unwilling to miss the shot to get short. This can be read as bearish anticipation and while it's not an automatic indication of reversal, it can be an attractive first step towards that.
So far there remains bullish potential on the daily chart as the past week has produced both a higher-low and a higher-high. But from the four hour, deeper pullback potential appears as a breach of the 1.1400 level shows a shorter-term lower-low. And that, combined with the failure to test 1.1500, makes EUR/USD an attractive venue if looking for USD-strength. And if looking for USD-weakness it seems that there are more attractive options out there, such as GBP/USD which did set a fresh three-year-high this week even as EUR/USD held at a lower-high. - js
EURUSD vs USDCAD: Mirror Reversal Wedgesand FRL ConfirmationsTwo major FX pairs — EURUSD and USDCAD — are currently forming highly symmetrical, yet opposite structures across multiple timeframes. Each pair reflects the logic of the Fractal Reversal Law (FRL), where every phase of market movement is concluded by a reversal figure, and the neckline of that figure aligns precisely with the MA100.
EURUSD:
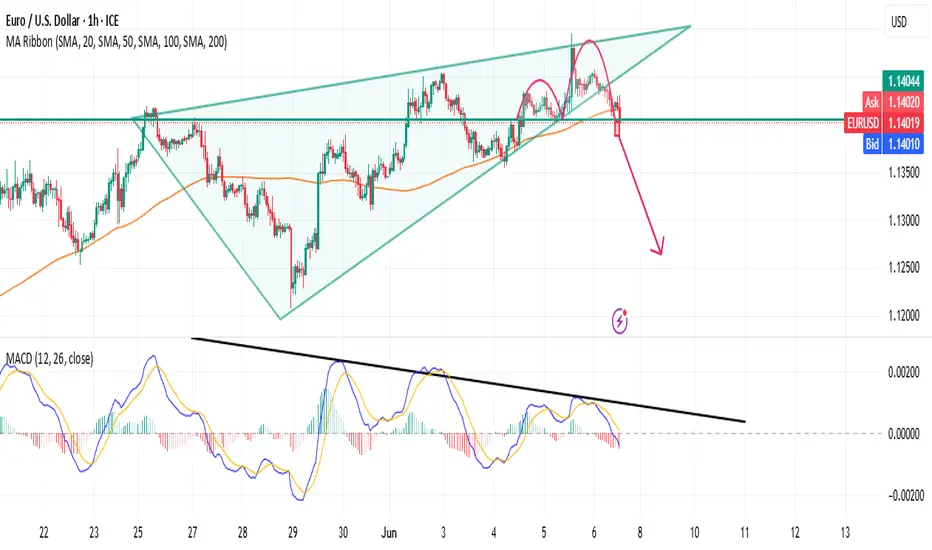
– Rising wedge on the H4 timeframe
– Bearish divergence on MACD
– Multiple double tops detected, necklines aligning with MA100 on H1 and H4
– Potential targets: 1.1355, 1.1300
– FRL context: structure of the uptrend is completing, neckline is acting as a phase boundary — possible reversal to the downside
USDCAD:
– Falling wedge visible on H1, H4, and D1
– Bullish divergence on MACD across all timeframes
– At least 3 nested double bottoms, with necklines exactly matching MA100
– Potential targets: 1.3750, 1.3860, 1.4020
– FRL context: the bearish phase is structurally complete; price is testing the neckline — signaling a likely reversal upward
Why this setup is special:
This is a rare mirror formation. Both pairs are building reversal figures that “rhyme” across timeframes, validated by strong divergence and neckline confluence with MA100. According to FRL, this kind of structure often marks the start of a new phase — and when mirrored across instruments, the probability increases dramatically.
Conclusion:
This setup illustrates the core of the FRL framework: price doesn’t reverse randomly — it completes a structure, prints a reversal figure, and challenges a horizontal neckline (often aligned with MA100). If confirmed, these trades could be textbook examples of structural phase shifts in the market.
Short summary (optional for the top of the idea):
EURUSD and USDCAD form opposite wedge patterns, with clear divergences and neckline-MA100 alignment across H1–D1. Textbook FRL symmetry — high probability of reversal on both ends.
EUR/USD – Bearish OutlookThe trap has been set.
EUR/USD swept the highs — and now the war begins.
This isn’t just price action.
It’s a precision strike based on structure, liquidity, and fundamentals.
ECB cut rates.
The dollar’s ready to fight.
The weekly candle? A sword slash straight through the bulls.
I’m not predicting — I’m preparing.
Watch the zone. Mark the levels.
We trade with vision.
We strike with discipline.

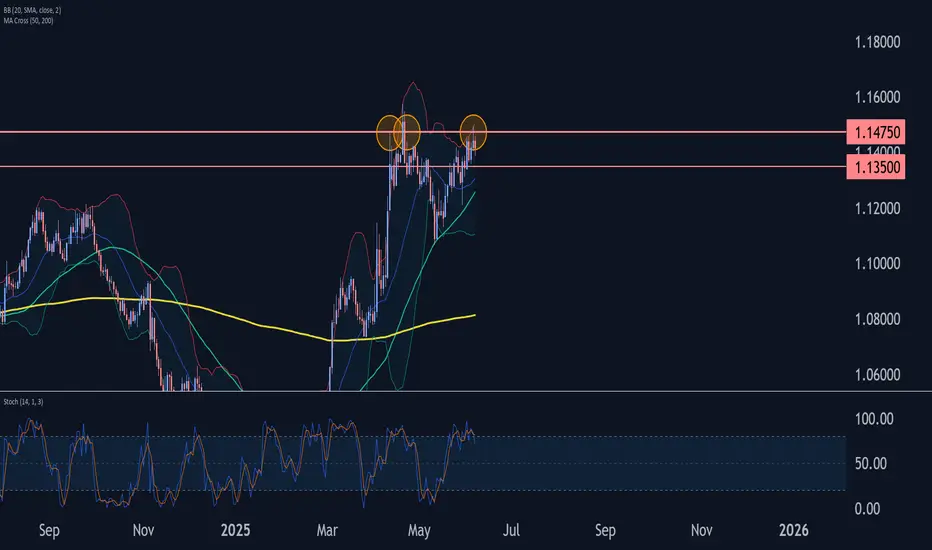
EURUSD Wave Analysis – 6 June 2025
- EURUSD reversed from the resistance zone
- Likely to fall to support level 1.1350
EURUSD currency pair recently reversed down from the resistance zone located between the key resistance level 1.1475 (which has been reversing the price from the start of April) and the upper daily Bollinger Band.
The downward reversal from this resistance zone created the daily Japanese candlesticks reversal pattern Shooting Star,
Given the overbought daily Stochastic, EURUSD currency pair can be expected to fall to the next support level 1.1350.
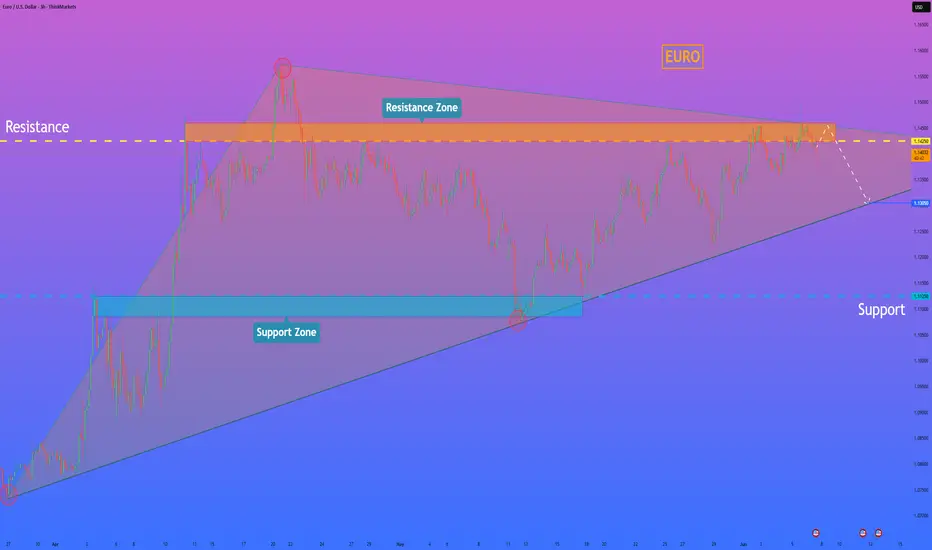
HelenP. I Euro may continue to decline to trend lineHi folks today I'm prepared for you Euro analytics. In this chart, we can see how the price reached the trend line and then started to grow inside a triangle pattern. Price some time traded near the trend line and then made an impulse up to the support level, which coincided with the support zone, and then made a correction, after which it turned around and made an impulse up one more time, breaking the support level. The euro reached the resistance level, which coincided with the resistance zone, and then made a small correction, after which it continued to move up and rose to the resistance line of the triangle. But then the Euro dropped below the resistance level, breaking it, and then continued to decline, after a retest. Price fell to the support zone, where it rebounded from the trend line, which is the support line of the triangle as well, and then started to grow. The euro has grown to a resistance zone, but recently it started to fall and now trades below the 1.1425 resistance level. So, I think that EURUSD will enter to resistance zone one more time and then continue to fall to the trend line. For this case, I set my goal at 1.1305 points, which coincided with this line. If you like my analytics you may support me with your like/comment ❤️
Disclaimer: As part of ThinkMarkets’ Influencer Program, I am sponsored to share and publish their charts in my analysis.

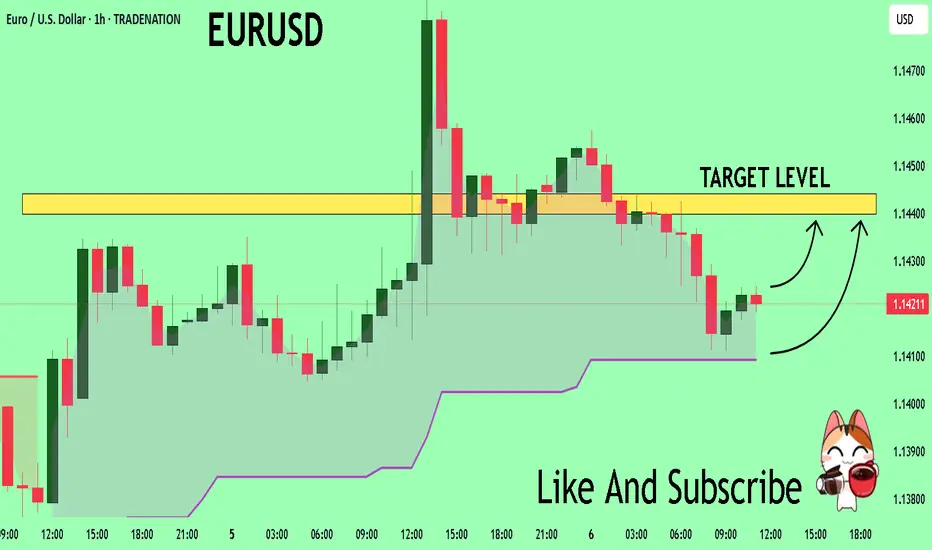
EURUSD Set To Grow! BUY!
My dear friends,
My technical analysis for EURUSD is below:
The market is trading on 1.1420 pivot level.
Bias - Bullish
Technical Indicators: Both Super Trend & Pivot HL indicate a highly probable Bullish continuation.
Target - 1.1439
About Used Indicators:
A pivot point is a technical analysis indicator, or calculations, used to determine the overall trend of the market over different time frames.
Disclosure: I am part of Trade Nation's Influencer program and receive a monthly fee for using their TradingView charts in my analysis.
———————————
WISH YOU ALL LUCK
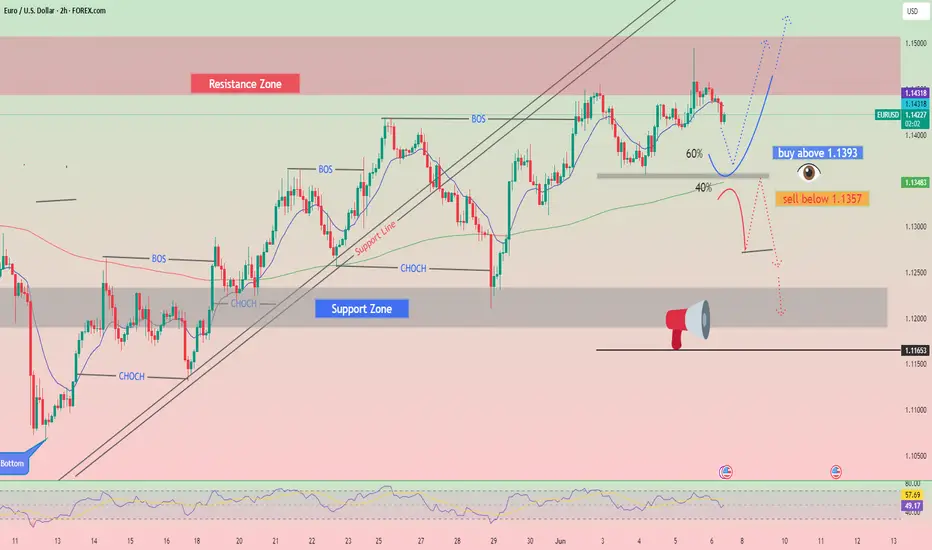
Trading Signals for EUR/USD buy above 1.1393 (200 EMA - 6/8 Early in the European session, the euro is trading around 1.1422, undergoing a technical correction after reaching the psychological level of 1.15.
The US Non-Farm Payrolls dat will be released in the American session, and strong volatility will hit the market. If the market reacts favorably to the US dollar, it could continue to pressure the EUR/USD pair.
On the other hand, if the data comes out negative for the US dollar, we could expect the to recover and could reach the 7/8 Murray level at 1.1596.
The indicator is showing a negative signal, so we believe that if the euro falls below the 6/8 Murray level in the coming hours, it will be seen as an opportunity to sell, with targets at the 200 EMA around 1.1290.
In the past, 1.1470 has acted as strong resistance, so we believe a technical correction could occur below this area this time. Therefor, we should be alert to see if the price consolidates below this level in order to sell.
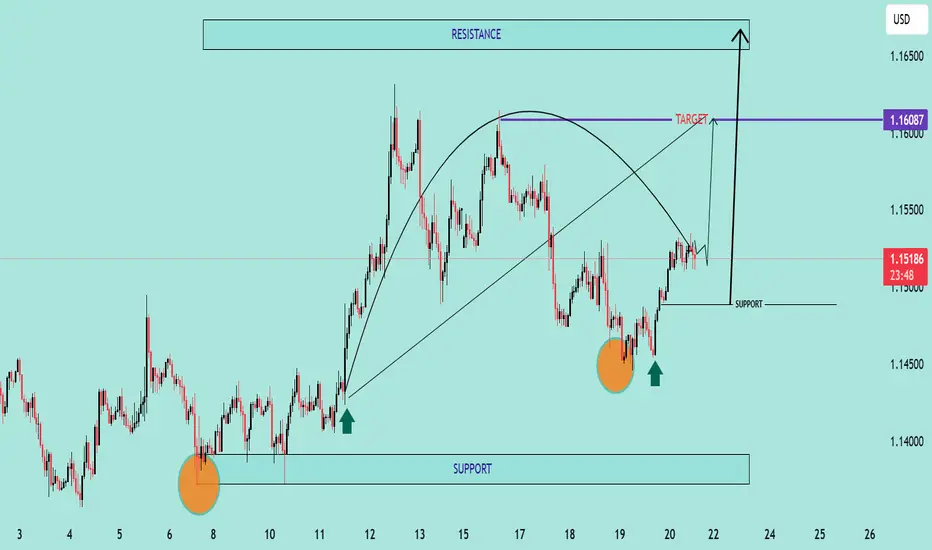
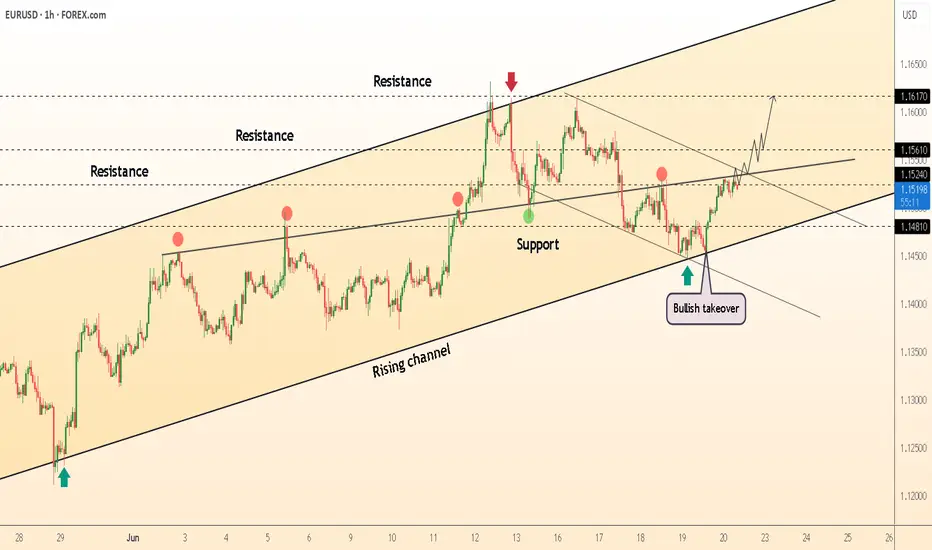
EUR/USD Bullish Reversal Breakout Pattern Technical Analysis Summary:
The chart illustrates a strong bullish reversal pattern forming on the EUR/USD pair:
🔹 Double Bottom Formation (🔶🔶):
Two clear bottom zones are marked with orange circles near the 1.14400–1.14500 area, indicating strong buying interest and support.
The second bottom confirms the double bottom pattern, often a precursor to an upward trend.
🔹 Support Zone (📉):
Firm support around 1.14450, as highlighted on the chart.
Price has respected this zone twice, bouncing back with bullish momentum each time.
🔹 Neckline Breakout (🔼):
Price is approaching the neckline zone at 1.16087, which acts as the bullish target.
A break and close above this neckline will confirm the reversal and open the way toward the resistance zone around 1.16500.
🔹 Projected Move (🎯):
If the neckline breaks, price is expected to surge towards 1.16500, aligning with the historical resistance.
This move completes the measured target projection from the double bottom structure.
🔹 Bullish Structure:
Higher lows and strong bullish candles are reinforcing the uptrend momentum.
Curved trajectory shows accumulation followed by a breakout phase.
📌 Key Levels to Watch:
Support: 1.14450 – 1.14500
Neckline/Target: 1.16087
Resistance: 1.16500
🛑 Invalidation:
A strong breakdown below support (1.14450) would invalidate this bullish setup.
EUR/USD analysis and pending orderTwo days ago, there was a FED meeting, where it was stated that the benchmark interest rate will be kept at 4.25-4.50% level.
What is important is what they told - the expectations - economicp rojections are lower, and inflation is higher.
Maybe they’ll decrease rates in future?
Right now, it’s not so important. It’s summer already, and by the old “Sell in May, and go aways” mentality, I don’t expect some huge impact on the market.
I know… Iran, Israel, Trump, maybe even Putin? Anybody can do some stupit stuff and everything can go to Hell.
And it’s Friday, not very smart time to open trades, so I’m putting pending order.
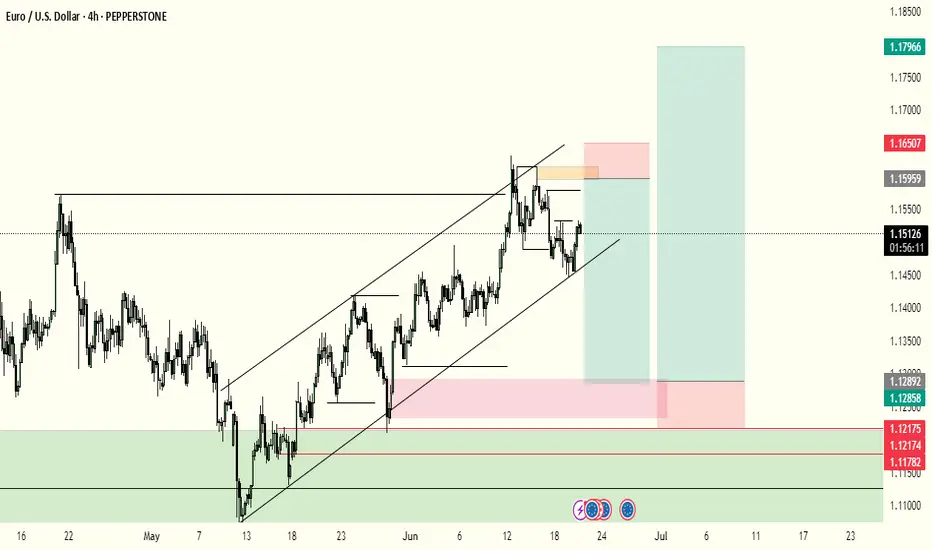
I decided for EUR/USD.
Timeframe is 4h.
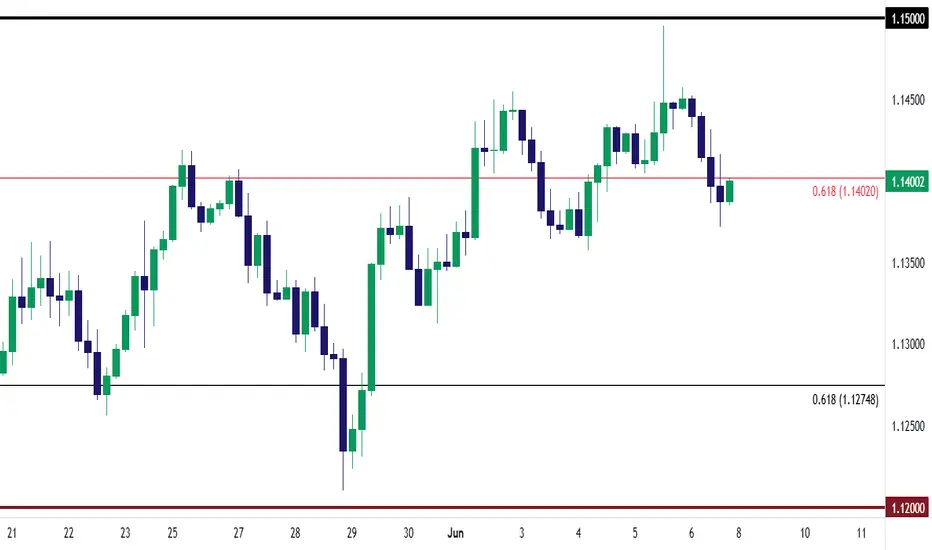
On my chart I can see clear uptrend in the last couple of weeks, especially in the last 3 months.
Also, I see lower highs.
Upward trend is breached… Where it could stop?
Overall, I don’t expect the pair will come near parity, even though ECB lowered rates before FED did.
But some “selloff”, probably.
I used good old Fibonacci, draw it, and the price could potentialy drop to 50% level or even ideal 61…8%-78.6% zone.
Pending entry: 1.15577
TP: 1.12645
SL: 1.1671
If it activates today, I’ll leave it over the weekend.

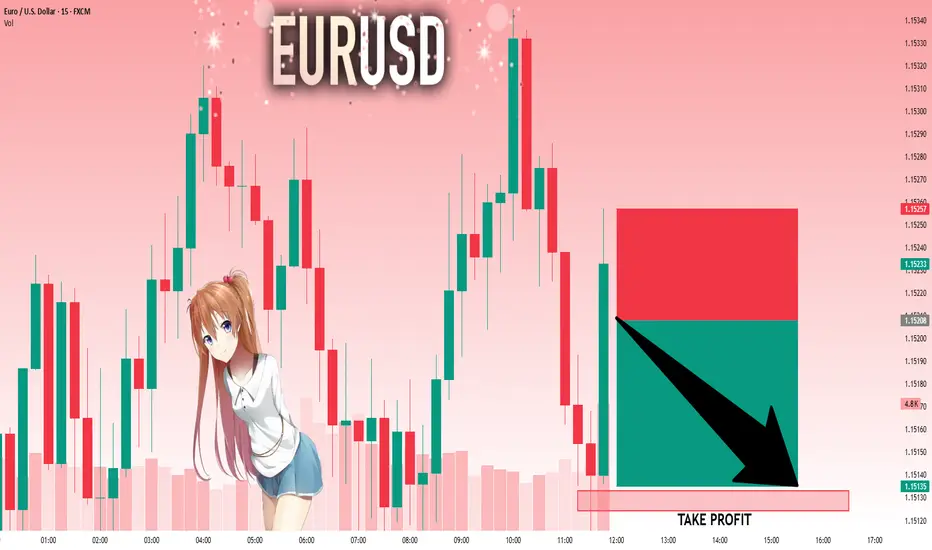
EURUSD: Move Down Expected! Short!
My dear friends,
Today we will analyse EURUSD together☺️
The market is at an inflection zone and price has now reached an area around 1.15208 where previous reversals or breakouts have occurred.And a price reaction that we are seeing on multiple timeframes here could signal the next move down so we can enter on confirmation, and target the next key level of 1.15133..Stop-loss is recommended beyond the inflection zone.
❤️Sending you lots of Love and Hugs❤️
EUR/USD Slips as Fed Stays HawkishEUR/USD hovered near 1.1520 during Friday’s Asian session, extending gains for a third day as the US dollar weakened, likely due to a technical pullback. However, the greenback may rebound as safe-haven demand grows amid rising tensions between the US and Iran.
Citing senior US intelligence, The New York Times reported that Iran hasn’t yet decided to pursue nuclear weapons, despite having enriched uranium reserves. Meanwhile, the Senate Intelligence Committee Chair said President Trump is set to offer Iran one final window to negotiate before considering military action, potentially delaying any decisions for up to two weeks.
Markets are also awaiting Friday’s Monetary Policy Report from the Federal Reserve, which will provide fresh insights into the Fed’s stance. On the Euro side, the ECB’s hawkish outlook offered additional support, with President Christine Lagarde suggesting rate cuts may soon end as the central bank remains “well positioned” to handle persistent risks.
Resistance is located at 1.1530, while support is seen at 1.1450
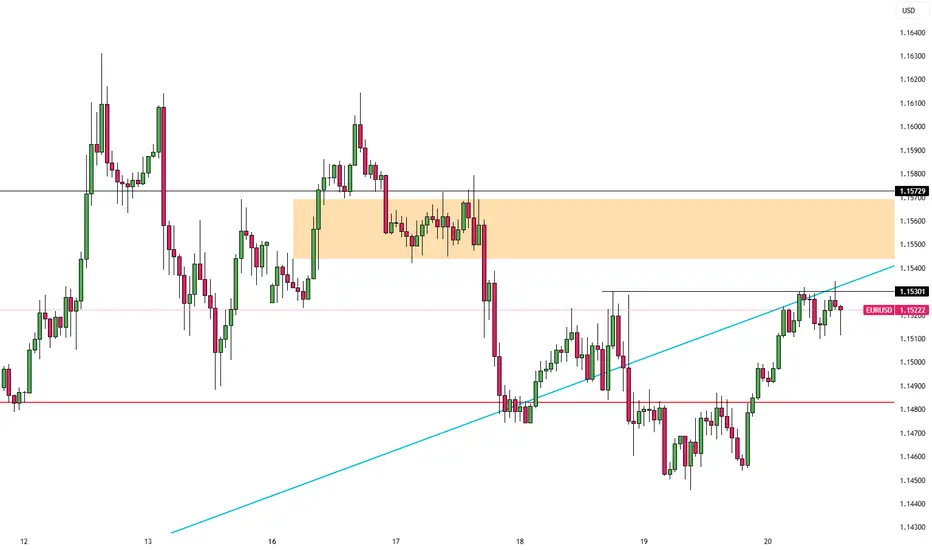
DeGRAM | EURUSD reached the resistance level📊 Technical Analysis
● Bulls defended the rising-channel mid-line (≈1.1480), turning it into support and snapping the intraday falling wedge; hourly closes now print higher highs above the reclaimed 1.1520 pivot.
● A tight bull flag is forming against 1.1560; its 1.618 swing coincides with the upper rail / 1.1617 resistance, keeping the channel’s momentum bias pointed north.
💡 Fundamental Analysis
● Softer US housing starts and a slide in 2-yr yields pulled the DXY to two-week lows, while ECB’s Knot warned “premature cuts risk inflation flare-ups,” widening the short-rate gap in the euro’s favour.
✨ Summary
Long 1.1515-1.1530; flag break >1.1560 targets 1.1617, stretch 1.1670. Bias void on an H1 close below 1.1480.
-------------------
Share your opinion in the comments and support the idea with a like. Thanks for your support
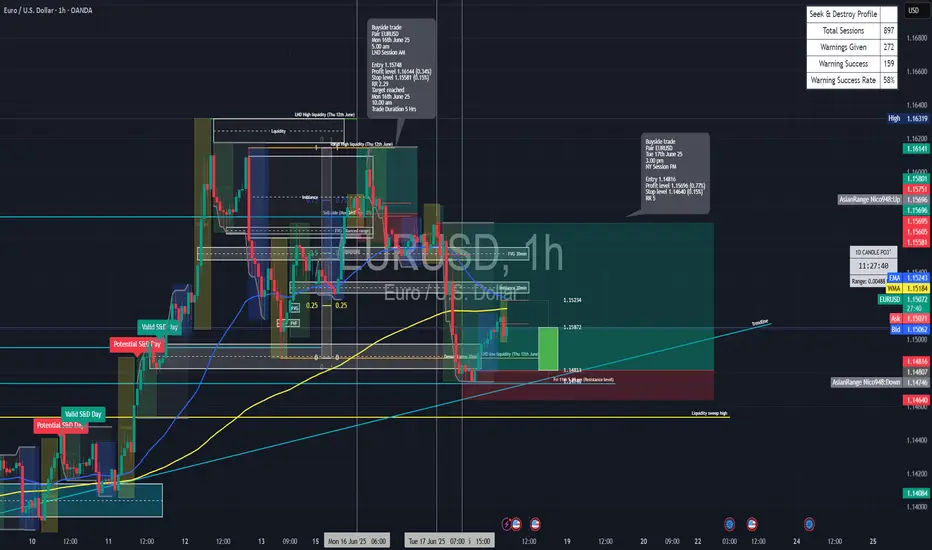
Long trade
📍 Pair: EURUSD
📅 Date: Tuesday, June 17, 2025
🕒 Time: 3:00 PM (NY Session PM)
⏱ Time Frame: 1 Hour
📈 Direction: Buyside
📊 Trade Breakdown:
Entry Price 1.14816
Profit Level 1.15696 (+0.77%)
Stop Loss 1.14640 (−0.15%)
Risk-Reward
Ratio 5:1
🧠 Context / Trade Notes:
1H Structure Entry:
Trade initiated at a key bullish order block on the 1hr timeframe, following higher-timeframe trend alignment.
EURUSD Breaks Structure: Bullish Continuation Opportunity💶 EUR/USD Analysis – Bullish Momentum Builds 📈
Taking a look at the EUR/USD on the daily chart, it’s clear the pair is currently in a strong bullish trend 🚀. Momentum has been building consistently, reflecting underlying euro strength and continued USD weakness.
🕓 On the 4H timeframe, we’ve now seen a clear shift in market structure to the upside, confirming bullish intent. Look for a continuation entry after a retracement back into equilibrium — ideally around the 50% level of the current price swing 🔄📐.
🎯 Trade Plan Idea:
Wait for price to pull back into equilibrium 🌀
Entry: Long from the discounted zone 🟩
Stop loss: Just below the recent swing low 🔻
Target: Previous high as a logical take-profit zone 🎯📊
⚠️ Disclaimer:
This content is for educational and informational purposes only and should not be considered financial advice. Always do your own research and consult with a qualified financial advisor before making any trading decisions. 📚💼

EURUSD Sell opportunity I see a sell opportunity on EURUSD
Entry: 1.15300
Sl: 1.15400
TP: 1.14500
Comment your opinion
For fund management. INBOX ME ON X @shajudeakinoba1


EURUSD | BearishEURUSD has broken the higher low level of bullish trend and printed new lower lows and lower lows and lower highs with bearish divergence on RSI.
