EURUSD | BearishEURUSD has broken the higher low level of bullish trend and printed new lower lows and lower lows and lower highs with bearish divergence on RSI.
USDEUX trade ideas

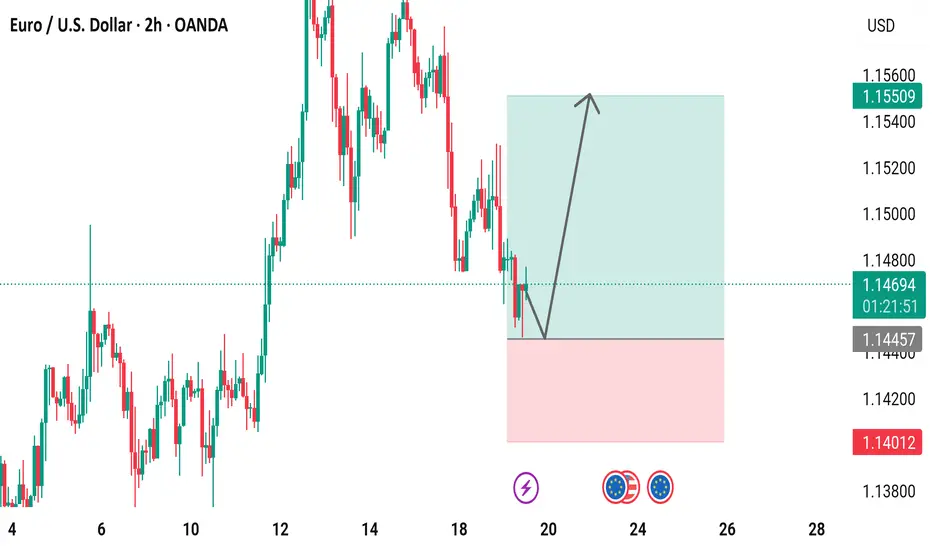
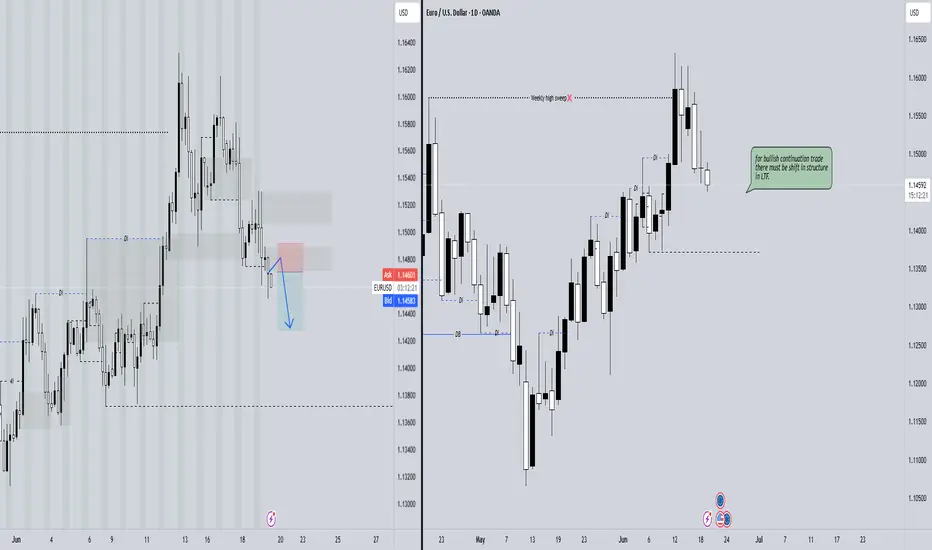
EUR/USD 2-Hour Chart Analysis2-hour performance of the Euro/U.S. Dollar (EUR/USD) currency pair, showing a recent decline with a change of -0.00134 (-0.12%) to a current value of 1.14676. The chart includes key levels such as a support zone around 1.14012-1.14457 and a resistance zone near 1.15000-1.15509. A breakout above the resistance could indicate a potential upward trend, as suggested by the highlighted area.
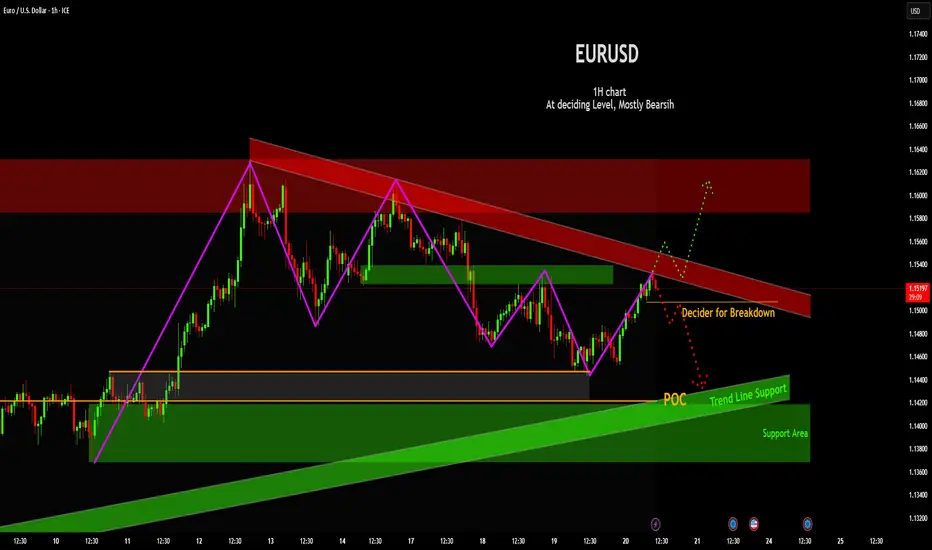
EURUSD: Deciding Point for Bearish BiasCurrent Price at Critical Resistance : The price action is currently challenging a significant downward-sloping resistance channel (highlighted in red). This zone has historically acted as a ceiling for price movements, and the current location is explicitly labeled as a "Decider for Breakdown," indicating a pivotal point for future direction.
Implied Bearish Bias : The overall sentiment indicated by the chart's title "At deciding Level, Mostly Bearish" suggests a lean towards downside continuation, although the price is currently pushing against resistance.
Identified Support Confluence : Below the current price, a layered support structure is identified. This includes an upward-sloping "Trend Line Support" channel (green) and a prominent horizontal "POC" (Point of Control), likely derived from volume profile analysis, both residing within a broader "Support Area" (green shaded zone).
Potential Future Pathways : Two immediate potential scenarios: a bearish continuation (red dotted path) if the current resistance holds and lower support levels are broken, or a bullish reversal (green dotted path) if the price successfully breaks above the descending resistance channel.
Swing Structure Visibility : Its kind of Flag and Pole pattern on larger picture, but there is also downward trending line. Purple line indicates the overall market structure interpretation.
Disclaimer:
The information provided in this chart is for educational and informational purposes only and should not be considered as investment advice. Trading and investing involve substantial risk and are not suitable for every investor. You should carefully consider your financial situation and consult with a financial advisor before making any investment decisions. The creator of this chart does not guarantee any specific outcome or profit and is not responsible for any losses incurred as a result of using this information. Past performance is not indicative of future results. Use this information at your own risk. This chart has been created for my own improvement in Trading and Investment Analysis. Please do your own analysis before any investments.
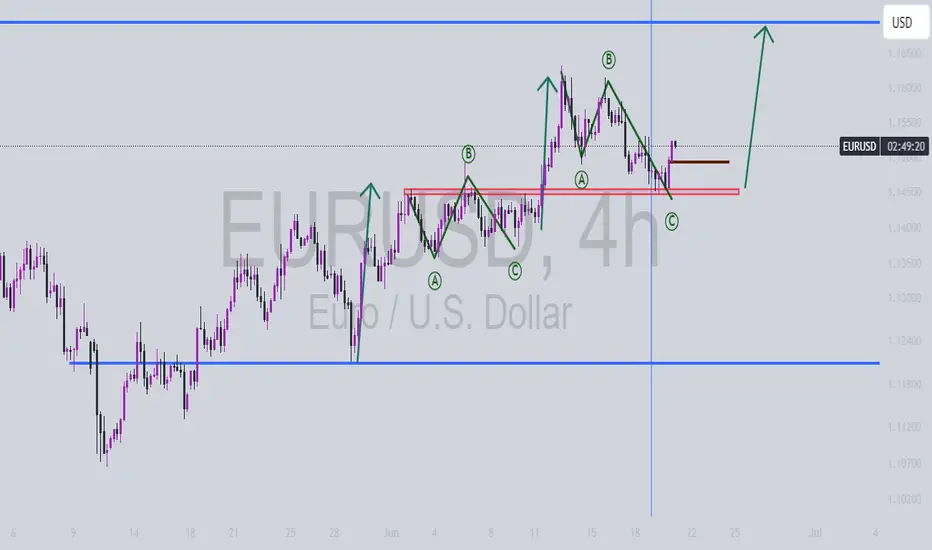
EURUSD on the riseYesterday, EURUSD failed to continue its pullback and has already recovered the drop caused by the news.
This suggests the correction might be over, and we could be seeing the start of a new bullish move.
The target is a breakout above the previous highs, aiming for 1,1706.
All positions we’re looking for are only in the direction of the main trend.
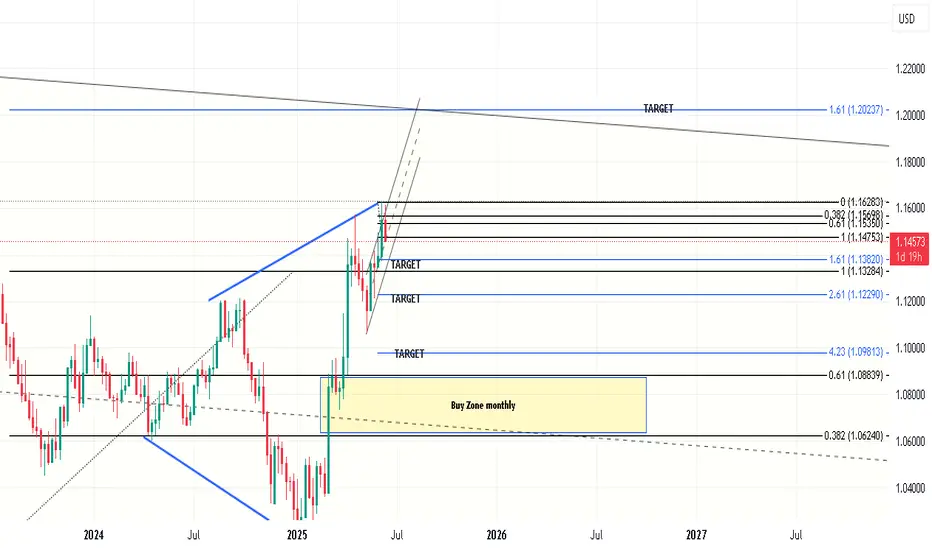
Elliot basic insight Base on the up trend movement, EU actually displaying a basic clear Elliot wave just like the textbook word. With the DAILY Candle closed yesterday, give a reason to enter meanwhile that next movement will be the 5th anticipate, since Elliot is a 12345 waves.
YOU CAN LOOK INTO IT.
EUR USD LONGhello .
this is my trade for this week/next week end the euro usd
4 H CISD from a daily bisi
smt with DXY
+ OTE ENTRY
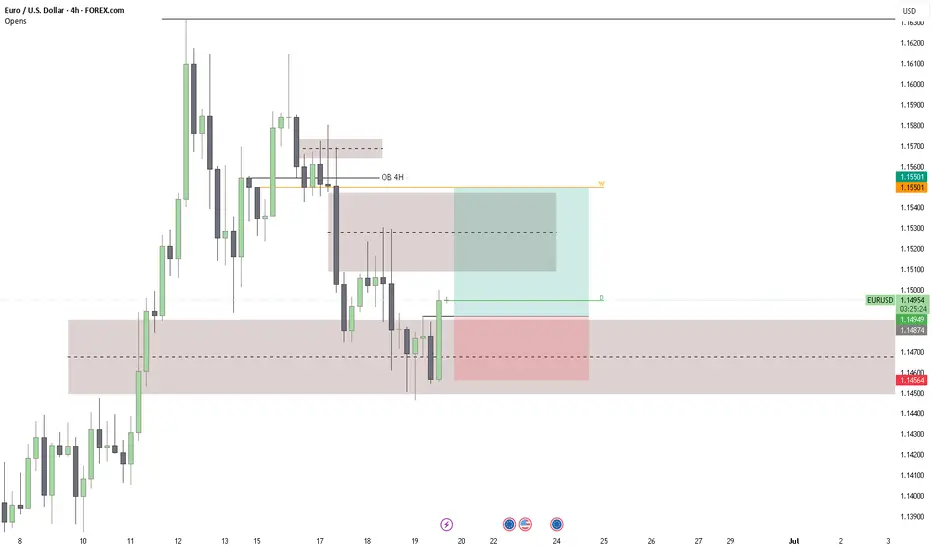
Going to accumulate more Euro dollars Looking at the 4H chart, it has come down to the important support level of 1.1493. If it is able to sustain above this level, then it should have no problem surpassing the previous high of 1.16 price level.
Thereafter, it may form a triple top formation and we see some retracement
Eurusd 1Hr chart Analaysis EUR/USD is currently in a bullish trend and is expected to reach the 1.17801 – 1.18010 range. A bearish retracement is likely to occur around those levels.
Note: Ongoing tensions in the Middle East could have a significant impact on the market.

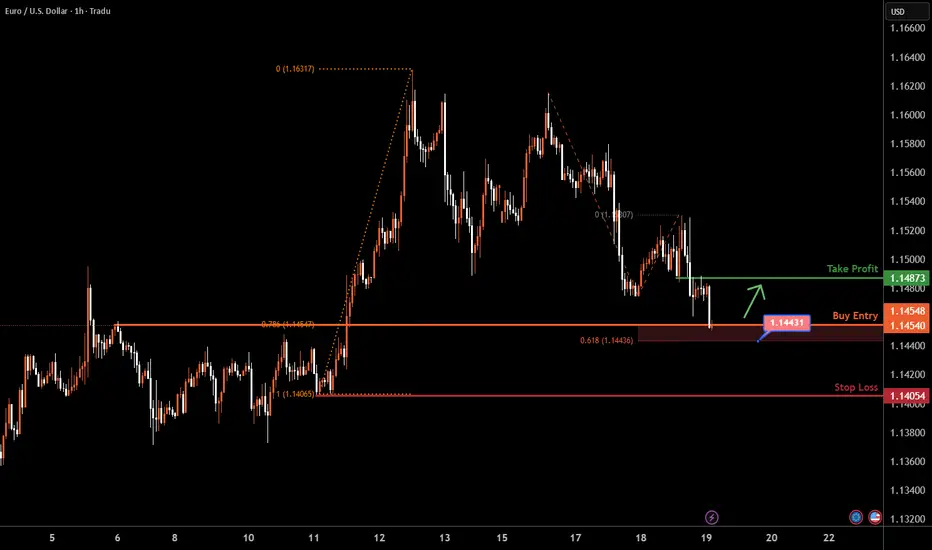
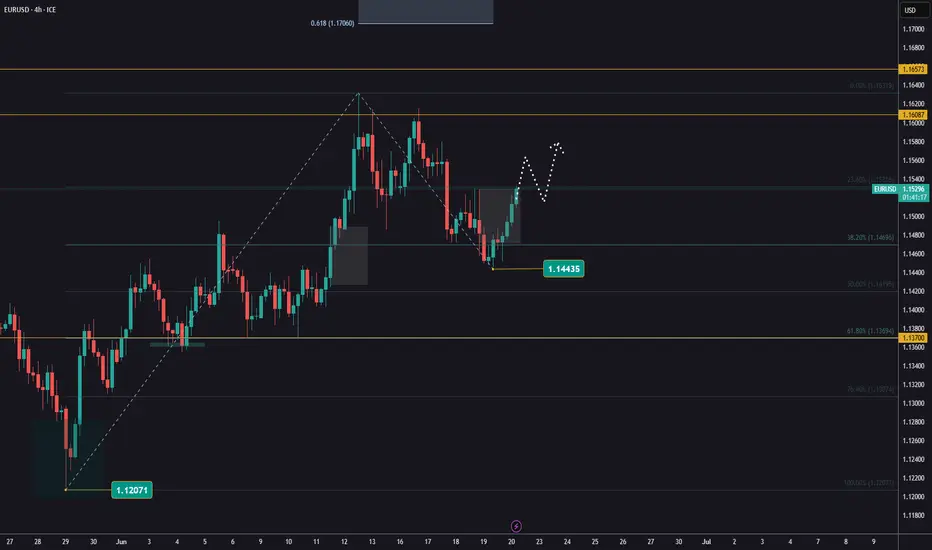
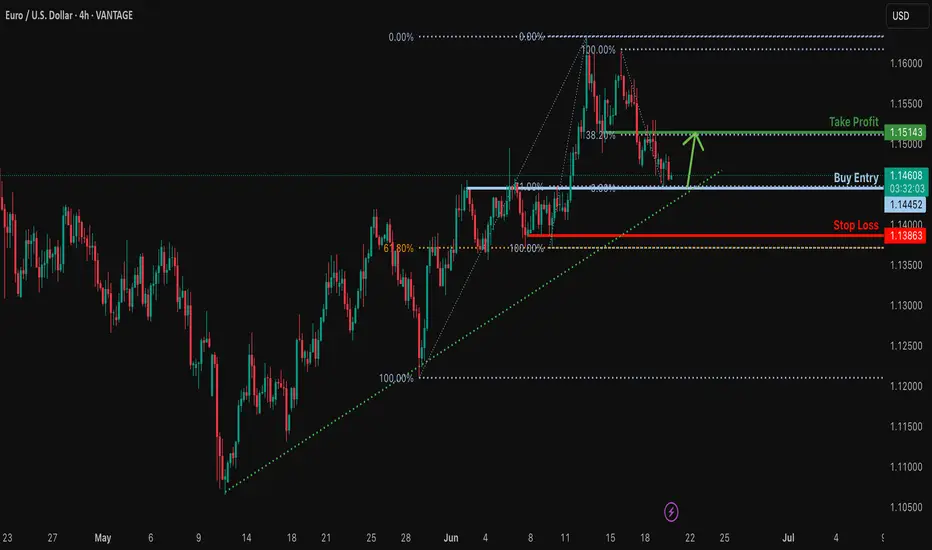
Bullish bounce?EUR/USD is falling towards the support level which is a pullback support that lines up with the 71% Fibonacci retracement and could rise from this level to our take profit.
Entry: 1.1445
Why we like it:
There is a pullback support level that aligns with the 71% Fibonacci retracement.
Stop loss: 1.1386
Why we like it:
There is a pullback support level that is slightly above the 61.8% Fibonacci retracement.
Take profit:1.1514
Why we like it:
There is an overlap resistance level that lines up with the 38.2% Fibonacci retracement.
Enjoying your TradingView experience? Review us!
Please be advised that the information presented on TradingView is provided to Vantage (‘Vantage Global Limited’, ‘we’) by a third-party provider (‘Everest Fortune Group’). Please be reminded that you are solely responsible for the trading decisions on your account. There is a very high degree of risk involved in trading. Any information and/or content is intended entirely for research, educational and informational purposes only and does not constitute investment or consultation advice or investment strategy. The information is not tailored to the investment needs of any specific person and therefore does not involve a consideration of any of the investment objectives, financial situation or needs of any viewer that may receive it. Kindly also note that past performance is not a reliable indicator of future results. Actual results may differ materially from those anticipated in forward-looking or past performance statements. We assume no liability as to the accuracy or completeness of any of the information and/or content provided herein and the Company cannot be held responsible for any omission, mistake nor for any loss or damage including without limitation to any loss of profit which may arise from reliance on any information supplied by Everest Fortune Group.
EURUSD IDEAueururueruruafadfsdfgsarwfdshgfts4ertsgdfgdf
bearish div on higher timeframe, bearish orderflow and fvgs being respected, but current price is looking like it wants to form a choch after sweeping day fvg and liquidities, so.... idk man

EURUSD: The Market Is Looking Up! Long!
My dear friends,
Today we will analyse EURUSD together☺️
The market is at an inflection zone and price has now reached an area around 1.14672 where previous reversals or breakouts have occurred.And a price reaction that we are seeing on multiple timeframes here could signal the next move up so we can enter on confirmation, and target the next key level of 1.14789.Stop-loss is recommended beyond the inflection zone.
❤️Sending you lots of Love and Hugs❤️

EURUSD SELL OPPORTUNITY Sell opportunity on EURUSD
Entry: 1.14800
Stoploss:1.14900
Takeprofit: 1.14150
Comment your opinion
Need someone to manage your fund. DM on X @shajudeakinoba1

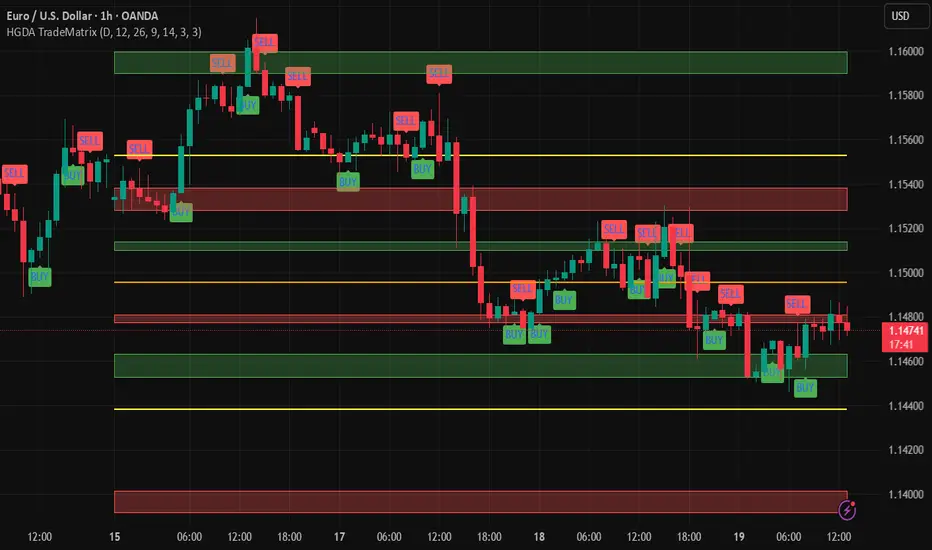
HOW-TO: Trade with HGDA Trade Matrix + Dual Momentum🧭 HOW-TO: Use HGDA Trade Matrix — Dynamic Support/Resistance Zones + Dual Momentum Signals
📊 This explanation is based on the EUR/USD chart on the 1-hour timeframe.
🧱 What Is HGDA Trade Matrix?
HGDA Trade Matrix automatically plots dynamic support and resistance zones derived from the high and low of a reference candle (which you can choose in the indicator settings — e.g., daily, 4H, or 1H).
The indicator calculates these zones using a proprietary ratio model based on price geometry and practical market behavior. It also includes directional guide lines (in yellow) to assist in navigating price behavior between key levels.
🧊 Zone Components:
🟥 Red Zones = Strong resistance areas (sell potential)
🟩 Green Zones = Strong support areas (buy potential)
🟨 Yellow Lines = Midrange guides or balance zones, highlighting decision areas
These levels update in real-time as price progresses, but remain anchored to the selected timeframe's reference candle — providing structure without noise.
🕓 How to Choose the Timeframe:
✅ Select Daily Candle (D) in settings → Get a full-day market structure that stays fixed for intraday analysis.
✅ Select Hourly Candle (H1) → Get real-time adaptive zones perfect for active monitoring and short-term trading.
📉 Trading Signals: BUY & SELL
The indicator includes automatic BUY and SELL labels that are generated using two momentum filters:
✅ MACD:
Buy: MACD crosses above signal line while below the zero line
Sell: MACD crosses below signal line while above the zero line
✅ Stochastic:
Buy: %K crosses above %D while avoiding overbought traps
Sell: %K crosses below %D while avoiding oversold traps
💥 Strong signals occur when both MACD and Stochastic agree, confirming a high-conviction entry.
🧪 Real Chart Example:
On June 14, a BUY signal appears at the lower green zone → suggesting reversal off dynamic support.
Price rallies to the red zone by June 17 → SELL signal confirms overbought condition.
On June 18, price dips again into the green zone → multiple BUY signals suggest rebuilding support.
This shows how the zones guide structure, while the signals confirm entries with real momentum.
🎯 How to Trade It:
Select your timeframe (daily or hourly) based on your style.
Wait for price to approach a zone — especially green or red.
Watch for BUY/SELL signal labels.
Confirm with candle action (e.g., rejections, wicks, engulfing).
Use next zone as your target, and zone failure as stop-loss reference.
Use built-in alerts to catch Strong Buy/Sell setups automatically.
🧬 What Makes It Original:
HGDA Trade Matrix is not a basic S/R indicator — it's a structured system that:
Adapts to market shifts
Balances geometry with momentum
Filters noise using dual-confirmation logic
It’s suitable for both intraday and swing traders who need actionable structure + smart entry timing.
📩 Access:
This is an Invite-Only tool. Message us directly to request access or trial.
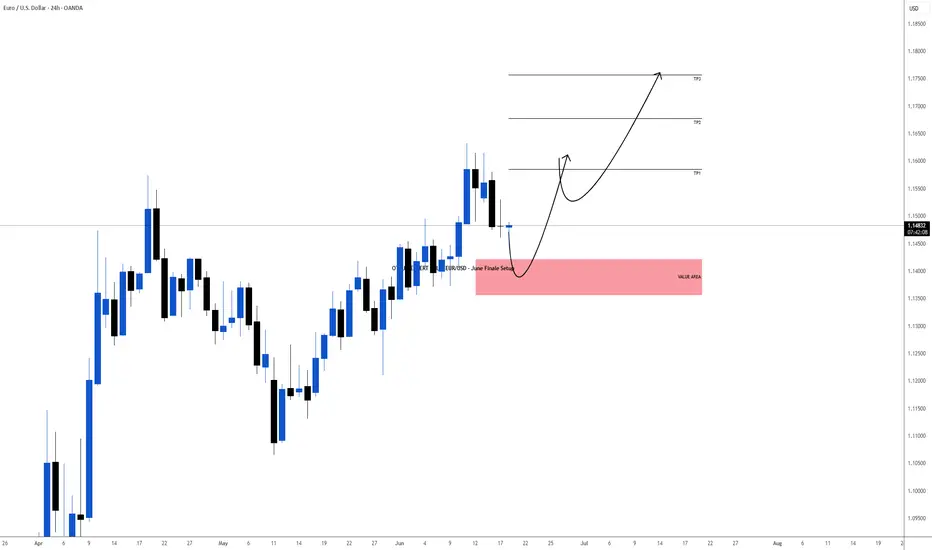
OTEUM EXPERT CALL: EUR/USD – June Finale Setup We’re eyeing the last intramonth swing of June, expected to bleed into early July. Our playbook: let the market cough up one final risk-off spike on the Iran headlines 🌪️📰, then scoop up positions in the value zone (red box) for the next bullish leg 🚀.
Patience first, trigger later 🕰️🎯—wait for price to hit the sweet spot, load up, and ride the firework into summer. Stay nimble; geo-shock headlines can move the board fast ⚠️.
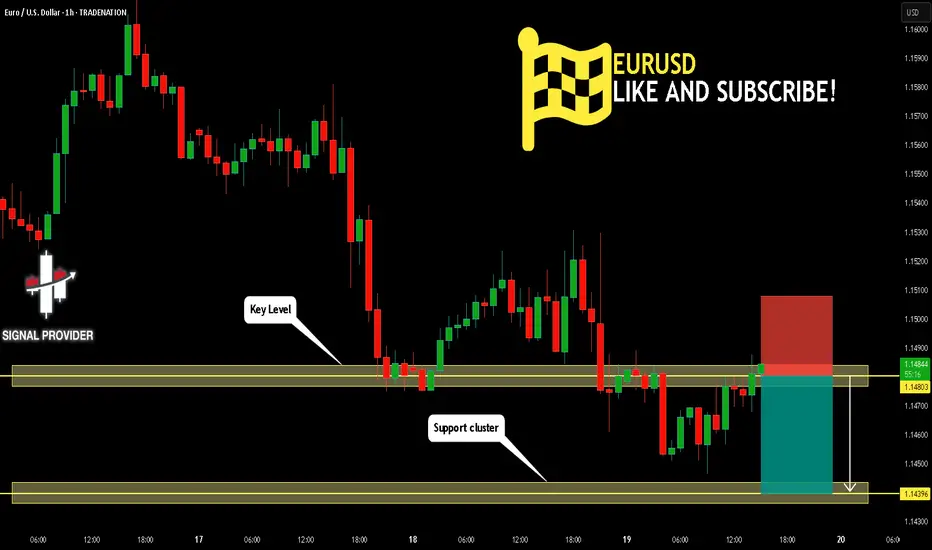
EURUSD Will Go Lower! Sell!
Here is our detailed technical review for EURUSD.
Time Frame: 1h
Current Trend: Bearish
Sentiment: Overbought (based on 7-period RSI)
Forecast: Bearish
The market is trading around a solid horizontal structure 1.148.
Taking into consideration the structure & trend analysis, I believe that the market will reach 1.143 level soon.
P.S
Please, note that an oversold/overbought condition can last for a long time, and therefore being oversold/overbought doesn't mean a price rally will come soon, or at all.
Disclosure: I am part of Trade Nation's Influencer program and receive a monthly fee for using their TradingView charts in my analysis.
Like and subscribe and comment my ideas if you enjoy them!
EUR/USD TrendlineEUR/USD remains under pressure after breaking its ascending trendline. Price is currently testing resistance between 1.14782 – 1.14985, a zone that could act as a ceiling for a new bearish leg.
If rejection holds, potential targets on the downside are 1.14465 and 1.14311.
A break and hold above 1.14985 would invalidate this bearish idea.

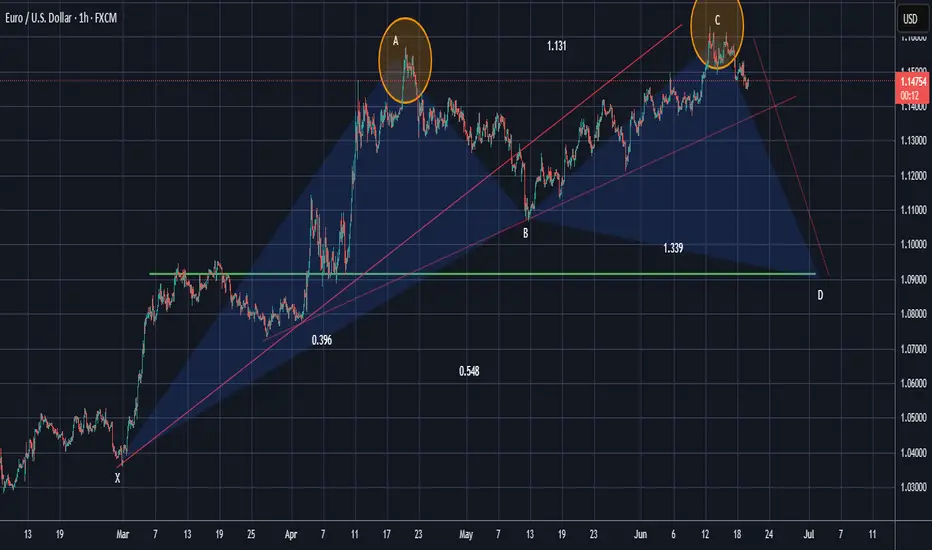
EURUSDLooking to sell the EUR USD on Long Term, the unfolding butterfly is currently almost complete with leg D due, so we selling based on the unfolding leg D and the support that's been broken, however tight with Risk Management on this one as it might make it rain for us if we carefully handle this, observe and decide.
EUR/USD Slips as Fed Stays HawkishEUR/USD fell toward 1.1465 in Thursday’s Asian session, pressured by a risk-off mood as Middle East tensions rise. The focus shifts to speeches from ECB officials Lagarde, Nagel, and de Guindos for further guidance.
On Wednesday, the Fed held rates at 4.25%–4.50% and signaled a slower pace of cuts, citing inflation risks from Trump’s new tariffs. The FOMC still projects two cuts in 2025
Bloomberg reported the US may strike Iran in the coming days, raising safe-haven demand for the dollar and adding pressure on the euro. ECB’s Lagarde said rate cuts are nearly done and that the ECB is well-positioned to manage current uncertainties.
Resistance is located at 1.1475, while support is seen at 1.1415
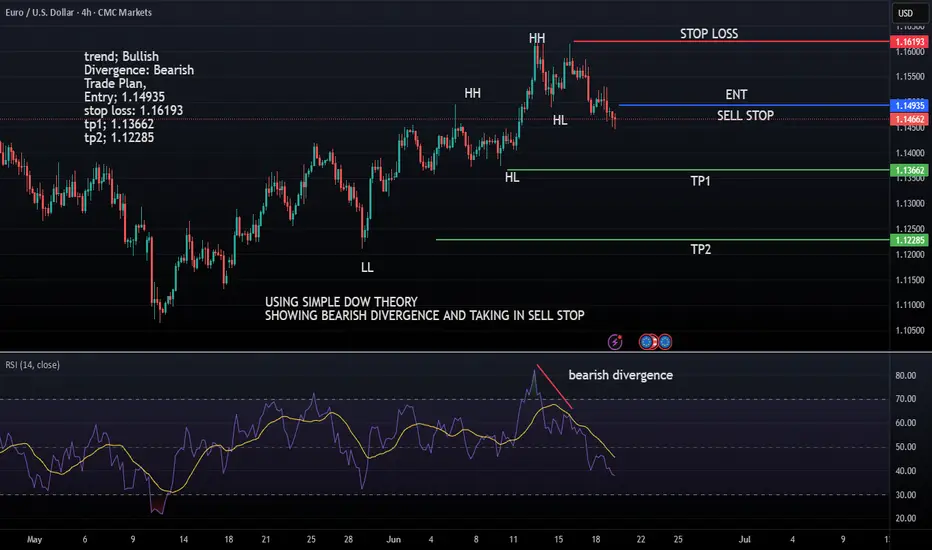
Bullish trend in the euro usd chartA bullish trend in the euro usd chart, showing bearish divergence and i am taking my trade using simple dow theory
EURUSD(20250619) Today's AnalysisMarket news:
Fed's June interest rate meeting - kept interest rates unchanged for the fourth consecutive time. The dot plot shows two rate cuts this year, but the number of officials who expect no rate cuts this year has risen to 7, and the rate cut expectations for next year have been reduced to 1. Powell continues to call for uncertainty, and the current economic situation is suitable for waiting and watching. He also expects tariff-driven inflation to rise in the coming months.
Technical analysis:
Today's buying and selling boundaries:
1.1489
Support and resistance levels:
1.1558
1.1532
1.1516
1.1463
1.1446
1.1420
Trading strategy:
If the price breaks through 1.1489, consider buying in, with the first target price of 1.1516
If the price breaks through 1.1463, consider selling in, with the first target price of 1.1446
Bearish ContinuationI am expecting price to continue bearish from the area of recent supply zone to target 1:2 RRR.
EURUSD H1 I Bullish Bounce Off Based on the H1 chart analysis, we can see that the price is trading near our buy entry at1.143-1.1454, which is a pullback support that aligns with the 78.6% Fib retracement and the 61.8% Fib projection, providing a significant level for a potential bullish reversal.
Our take profit will be at 1.1487, which is an overlap resistance
The stop loss will be placed at 1.1405, which is a multi-swing low support level.
High Risk Investment Warning
Trading Forex/CFDs on margin carries a high level of risk and may not be suitable for all investors. Leverage can work against you.
Stratos Markets Limited (tradu.com ):
CFDs are complex instruments and come with a high risk of losing money rapidly due to leverage. 63% of retail investor accounts lose money when trading CFDs with this provider. You should consider whether you understand how CFDs work and whether you can afford to take the high risk of losing your money.
Stratos Europe Ltd (tradu.com ):
CFDs are complex instruments and come with a high risk of losing money rapidly due to leverage. 63% of retail investor accounts lose money when trading CFDs with this provider. You should consider whether you understand how CFDs work and whether you can afford to take the high risk of losing your money.
Stratos Global LLC (tradu.com ):
Losses can exceed deposits.
Please be advised that the information presented on TradingView is provided to Tradu (‘Company’, ‘we’) by a third-party provider (‘TFA Global Pte Ltd’). Please be reminded that you are solely responsible for the trading decisions on your account. There is a very high degree of risk involved in trading. Any information and/or content is intended entirely for research, educational and informational purposes only and does not constitute investment or consultation advice or investment strategy. The information is not tailored to the investment needs of any specific person and therefore does not involve a consideration of any of the investment objectives, financial situation or needs of any viewer that may receive it. Kindly also note that past performance is not a reliable indicator of future results. Actual results may differ materially from those anticipated in forward-looking or past performance statements. We assume no liability as to the accuracy or completeness of any of the information and/or content provided herein and the Company cannot be held responsible for any omission, mistake nor for any loss or damage including without limitation to any loss of profit which may arise from reliance on any information supplied by TFA Global Pte Ltd.
The speaker(s) is neither an employee, agent nor representative of Tradu and is therefore acting independently. The opinions given are their own, constitute general market commentary, and do not constitute the opinion or advice of Tradu or any form of personal or investment advice. Tradu neither endorses nor guarantees offerings of third-party speakers, nor is Tradu responsible for the content, veracity or opinions of third-party speakers, presenters or participants.