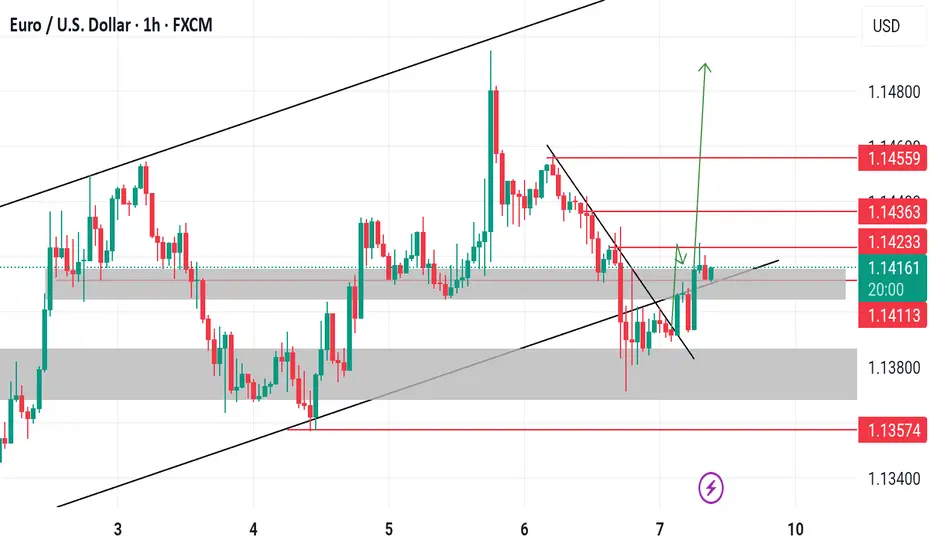
Buy EURUSD.I'm analyzing EURUSD, and on the 4-hour timeframe, the overall market is in an uptrend. In the 1-hour timeframe, a minor downtrend has been broken, and the price looks ready to align with the overall uptrend. If the market crosses my alert level, I’ll look for a buy opportunity.
USDEUX trade ideas
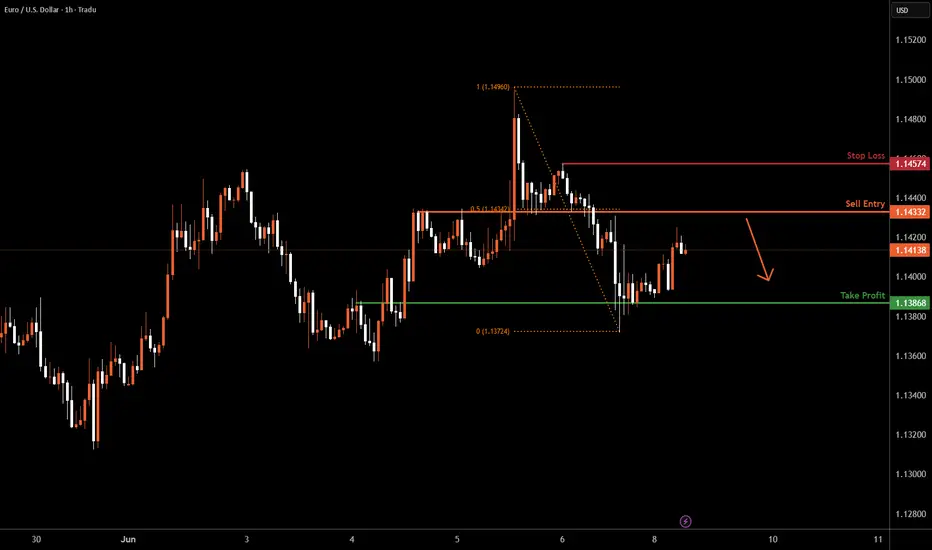
EURUSD H1 I Bearish Reversal Based on the H1 chart analysis, we can see that the price is rising toward our sell entry at 1.1433, which is a pullback resistance aligning with a 50% Fibo retracement.
Our take profit will be at 1.1386, an overlap support level.
The stop loss will be placed at 1.1457, a swing-high resistance level.
High Risk Investment Warning
Trading Forex/CFDs on margin carries a high level of risk and may not be suitable for all investors. Leverage can work against you.
Stratos Markets Limited (tradu.com/uk ):
CFDs are complex instruments and come with a high risk of losing money rapidly due to leverage. 63% of retail investor accounts lose money when trading CFDs with this provider. You should consider whether you understand how CFDs work and whether you can afford to take the high risk of losing your money.
Stratos Europe Ltd (tradu.com/eu ):
CFDs are complex instruments and come with a high risk of losing money rapidly due to leverage. 63% of retail investor accounts lose money when trading CFDs with this provider. You should consider whether you understand how CFDs work and whether you can afford to take the high risk of losing your money.
Stratos Global LLC (tradu.com/en ):
Losses can exceed deposits.
Please be advised that the information presented on TradingView is provided to Tradu (‘Company’, ‘we’) by a third-party provider (‘TFA Global Pte Ltd’). Please be reminded that you are solely responsible for the trading decisions on your account. There is a very high degree of risk involved in trading. Any information and/or content is intended entirely for research, educational and informational purposes only and does not constitute investment or consultation advice or investment strategy. The information is not tailored to the investment needs of any specific person and therefore does not involve a consideration of any of the investment objectives, financial situation or needs of any viewer that may receive it. Kindly also note that past performance is not a reliable indicator of future results. Actual results may differ materially from those anticipated in forward-looking or past performance statements. We assume no liability as to the accuracy or completeness of any of the information and/or content provided herein and the Company cannot be held responsible for any omission, mistake nor for any loss or damage including without limitation to any loss of profit which may arise from reliance on any information supplied by TFA Global Pte Ltd.
The speaker(s) is neither an employee, agent nor representative of Tradu and is therefore acting independently. The opinions given are their own, constitute general market commentary, and do not constitute the opinion or advice of Tradu or any form of personal or investment advice. Tradu neither endorses nor guarantees offerings of third-party speakers, nor is Tradu responsible for the content, veracity or opinions of third-party speakers, presenters or participants.
EURUSD InsightHello to all subscribers, and welcome!
Please share your personal opinions in the comments. Don’t forget to hit the Boost and Subscribe buttons!
Key Points
- There was a report suggesting that the Bank of Japan (BOJ) is likely to consider slowing the pace of tapering at its monetary policy meeting later this month. Currently, it is reducing bond purchases by ¥400 billion per quarter, but a plan to cut that to ¥200 billion is reportedly under discussion.
- According to the U.S. Department of Labor, non-farm payrolls in May increased by 139,000, exceeding the market expectation of 130,000. The unemployment rate for May came in at 4.2%, matching forecasts.
- On June 5, President Trump and Chinese President Xi Jinping held a phone call. At the upcoming U.S.-China high-level meeting on June 9, export controls each country has implemented to block essential raw materials and technologies from reaching the other are expected to be a major topic of discussion.
This Week’s Key Economic Events
+ June 11: U.S. May Consumer Price Index (CPI)
+ June 12: U.K. April GDP, U.S. May Producer Price Index (PPI)
+ June 13: Germany May Consumer Price Index (CPI)
EURUSD Chart Analysis
The pair is rebounding from the 1.11500 level and is currently trending upward toward resistance near the recent high. A short-term rise toward the 1.16000 level looks highly likely. However, it remains uncertain whether it will break above the resistance level. We'll reassess the direction once the price reaches the previous high.

EURUSD pullback for another bullish movementEURUSD is sideway now but based on my daily analysis, the trend is still uptrend.
strategy:-
I will wait at the mark zone for buy entry
(I will monitor at H4 low BB area for any bullish price action).
Good luck
calculate your own risk & reward.

Buy trade on EURUSD Ok. From my strategy stand point, I see a potential buy on EU, reason been that price broke out of my trend line and gives me an abc setup , then I locate my poi, which I s my entry point, so i am in for a buy

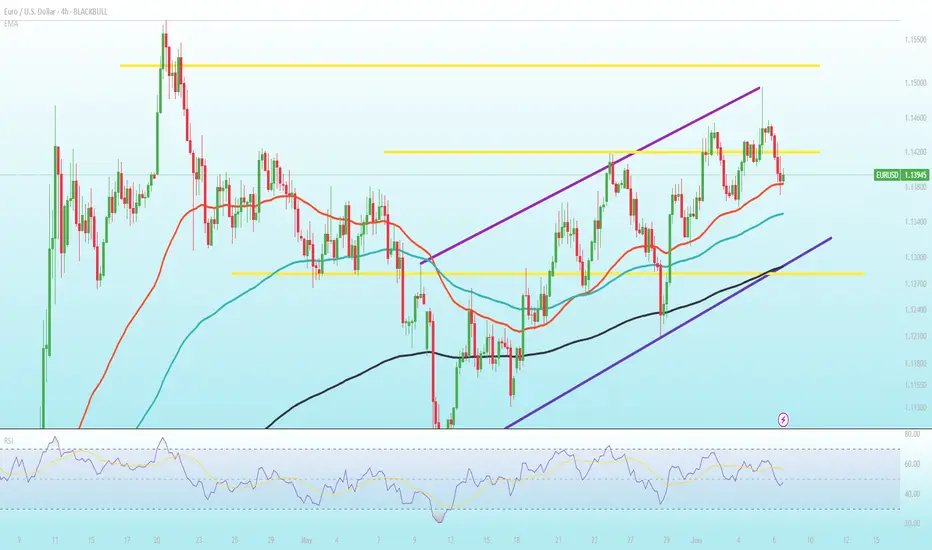
Nato and EU meetings could lift EUR/USD further Despite believing the euro is currently overvalued, Bank of America prefers it to the US dollar, Swiss franc and Japanese yen.
Bank of America thinks the EUR could be supported leading up to the NATO and EU summits (June 24-27) especially if defense spending is confirmed. German infrastructure spending might also be expected to support the euro.
The EUR/USD holds above the 20- and 50-period EMAs at 1.1380–1.1360 and is comfortably above the 200-period EMA. The recent pull-back from 1.14930 has eased momentum slightly.
A close above 1.1420 could target 1.1470, then 1.1520. A sustained break below 1.1280 could neutralise the bullish bias.
EURUSD: Weekly Overview June 9th 2025Hello Traders,
US CPI news is really important and could change the direction of the markets. But I think the Pair would keep its bullish trend for next week too.
*********************************************************************
The indicated levels are determined based on the most reaction points and the assumption of approximately equal distance between the zones.
Some of these points can also be confirmed by the mathematical intervals of Murray.
You can enter with/without confirmation. IF you want to take confirmation you can use LTF analysis, Spike move confirmation, Trend Strength confirmation and ETC.
SL could be placed below the zone or regarding the LTF swings.
TP is the next zone or the nearest moving S&R, which are median and borders of the drawn channels.
*******************************************************************
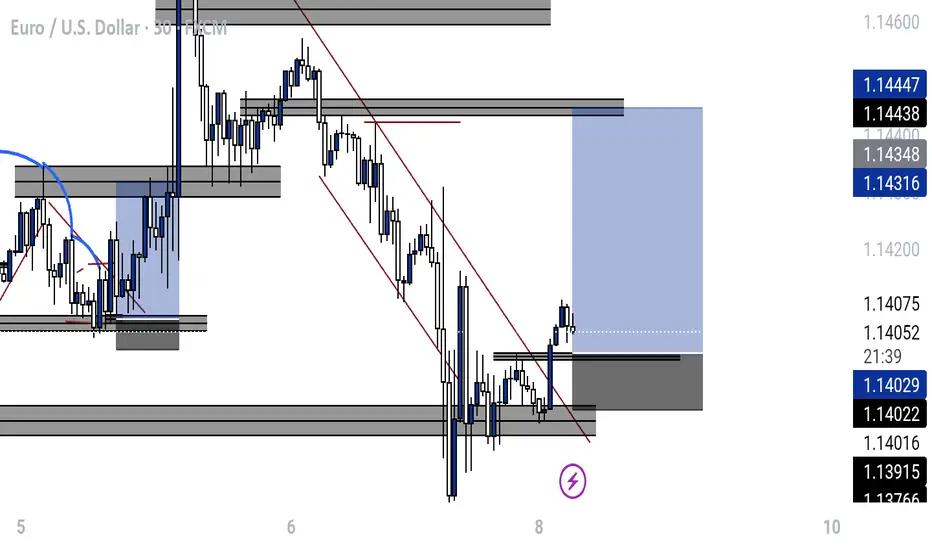
Role of different zones:
GREEN: Just long trades allowed on them.
RED: Just Short trades allowed on them.
BLUE: both long and short trades allowed on them.
WHITE: No trades allowed on them! just use them as TP points

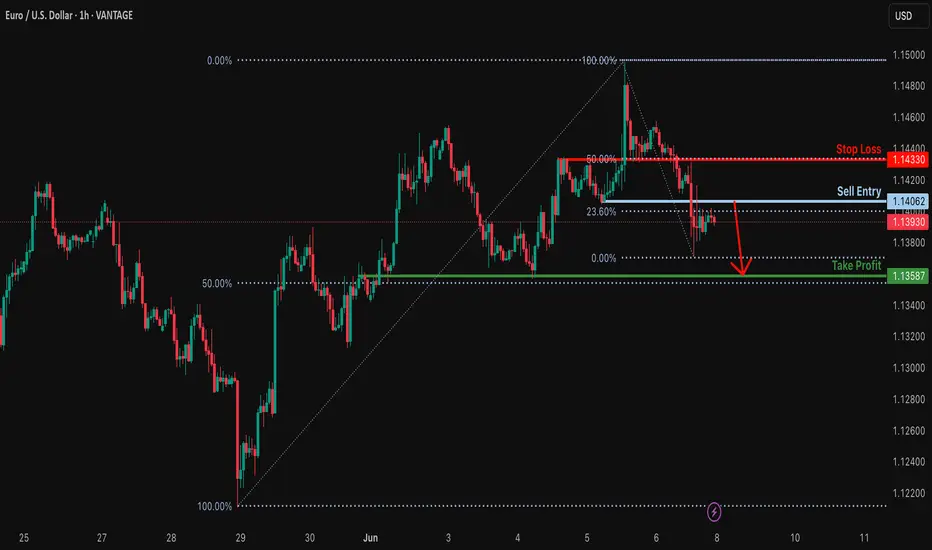
Bearish drop?EUR/USD is rising towards the resistance level which is a pullback resistance that lines up with the 23.6% Fibonacci retracement and could drop from this level to our take profit.
Entry: 1.1406
Why we like it:
There is a pullback resistance level that lines up with the 23.6% Fibonacci retracement.
Stop loss: 1.1433
Why we like it:
There is a pullback resistance level that lines up with the 50% Fibonacci retracement.
Take profit: 1.1358
Why we like it:
There is a pullback support level that aligns with the 50% Fibonacci retracement.
Enjoying your TradingView experience? Review us!
Please be advised that the information presented on TradingView is provided to Vantage (‘Vantage Global Limited’, ‘we’) by a third-party provider (‘Everest Fortune Group’). Please be reminded that you are solely responsible for the trading decisions on your account. There is a very high degree of risk involved in trading. Any information and/or content is intended entirely for research, educational and informational purposes only and does not constitute investment or consultation advice or investment strategy. The information is not tailored to the investment needs of any specific person and therefore does not involve a consideration of any of the investment objectives, financial situation or needs of any viewer that may receive it. Kindly also note that past performance is not a reliable indicator of future results. Actual results may differ materially from those anticipated in forward-looking or past performance statements. We assume no liability as to the accuracy or completeness of any of the information and/or content provided herein and the Company cannot be held responsible for any omission, mistake nor for any loss or damage including without limitation to any loss of profit which may arise from reliance on any information supplied by Everest Fortune Group.
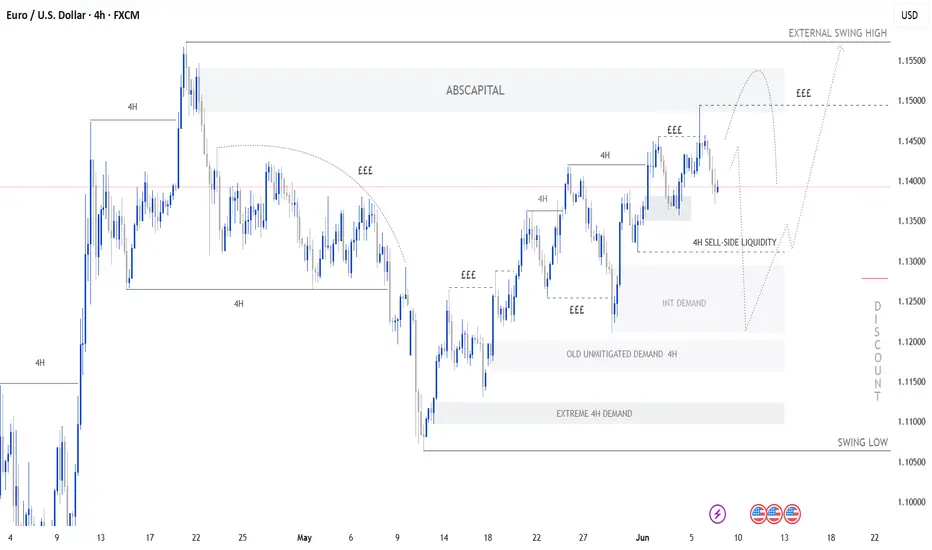
EURUSD 4 HOUR OUTLOOK Price mitigated 4hour supply and pullback or retraces to internal sell to buy candle and the zone has been mitigated before.
Anticipating price to break structure to the upside and pullback or...
anticipating price to buy shorts when the market opens and sell to DISCOUNT ( lower time frame- we have a change of character - internal structure
Price will break structure to the upside and continues with HTF bias
Price will clear sell side liquidity to Discount level either one of the marked demands.
I will use h1/m30 time frame for confirmation
EURUSD Analysis todayHello traders, this is a complete multiple timeframe analysis of this pair. We see could find significant trading opportunities as per analysis upon price action confirmation we may take this trade. Smash the like button if you find value in this analysis and drop a comment if you have any questions or let me know which pair to cover in my next analysis.

Economic data in the eurozone was mixed.The EUR/USD trended higher in a volatile fashion this week, gaining 0.41% on a weekly basis. It briefly reached a six-week high of 1.1495 on Thursday but retreated to 1.1395 on Friday due to a stronger US dollar. Nevertheless, the euro showed overall robust performance during the week. Analysts were not surprised by the European Central Bank's (ECB) rate cut, but they remained cautious about the impact of Trump's tariff policies on the global economy. Although the ECB believes trade tensions have eased, analysts argue that the eurozone has not fully escaped risks. If future economic data continues to be weak, the euro may face downward pressure.
Humans need to breathe, and perfect trading is like breathing—maintaining flexibility without needing to trade every market swing. The secret to profitable trading lies in implementing simple rules: repeating simple tasks consistently and enforcing them strictly over the long term.
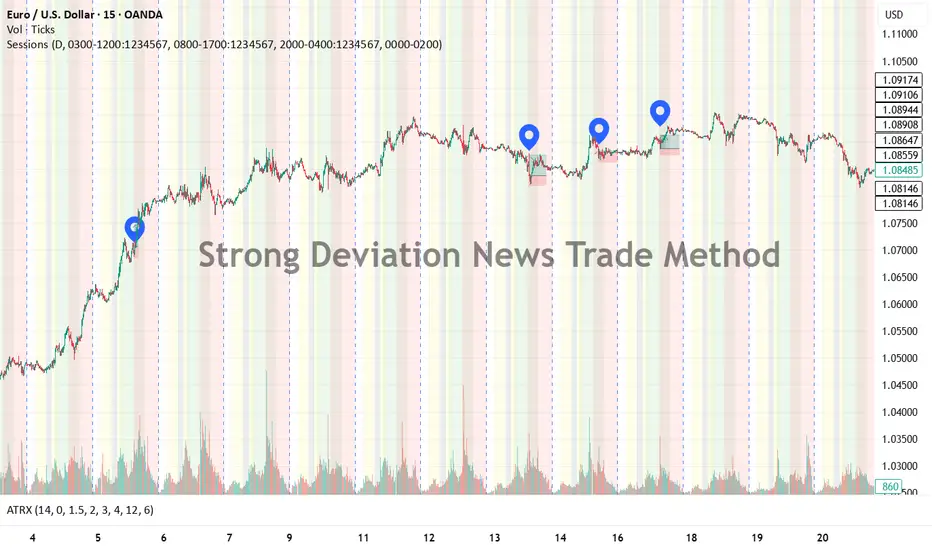
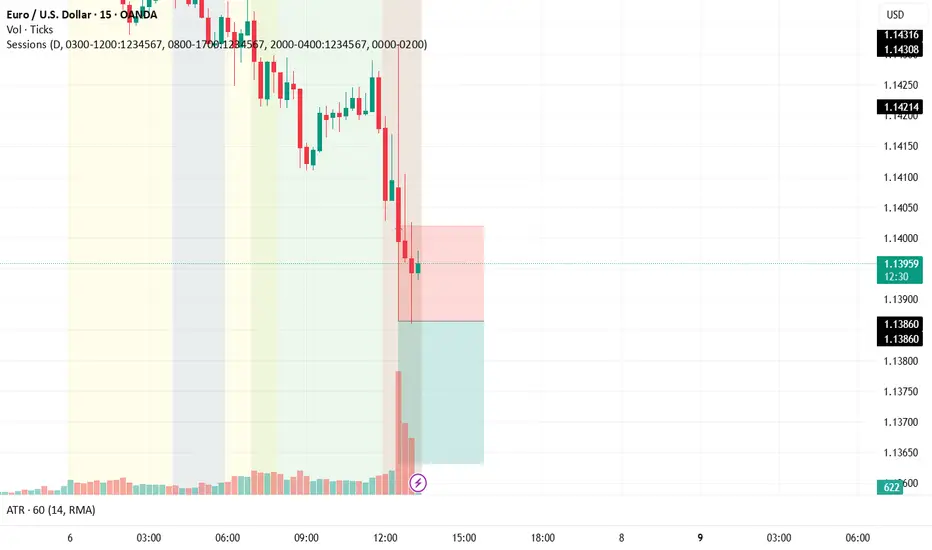
Strong Deviation News Trade MethodBack tested News-Based Trading Strategy | March–early June Results
This strategy trades only on strong deviation surprises in high-impact economic news releases, aiming to capture sharp market moves caused by unexpected data.
What is a Strong Deviation?
A strong deviation occurs when the actual economic data significantly differs from the forecasted number, beyond typical market expectations. This threshold is identified using advanced AI analysis of historical news data to measure how much surprise generally triggers meaningful price movement. Traders can implement these deviation levels as objective filters to enter trades only when the market is likely to react strongly.
Back test Summary (March to early June):
Total net result: +146.3 units (pips/points/%)
Number of trades: 10
Entry logic: Trade triggered when news surprise meets or exceeds strong deviation thresholds
Stop-loss: Set at 1.5 times the 15-minute chart ATR (Average True Range) to allow for normal volatility
Take-profit: Set at 2 times the stop-loss distance to secure favorable risk-reward
Visual signals: Each executed trade is marked on the chart with a blue pin
Highlights:
Focus on strong market-moving surprises only, filtering out noise
Risk management designed to balance protection and opportunity
Trades aligned strictly with news-driven momentum
Back tested with consistent positive returns over three months on key US economic data
How to Use:
Apply the strong deviation thresholds identified via AI-powered analysis as your trigger for news trades. Use the ATR-based stops and doubled take-profit for balanced risk control. This strategy suits traders aiming for clear, data-driven signals around economic events with disciplined trade management.
this text was powered by ai...
feel free to comment and discus the strategy. always open to news things and your thoughts.
and always remember . to learn is to share ...
EURUSD LIVE TRADEHello friends
Since the price has reached the specified important resistance, a correction in the price is expected. Therefore, you can enter the position with capital and risk management and move with it to the specified goals.
*Trade safely with us*
EURUSD"I’m expecting overall bullish momentum for EUR/USD in the coming weeks. We might see some short-term bearish moves, but they could just be setups for a larger bullish push. Fingers crossed!"

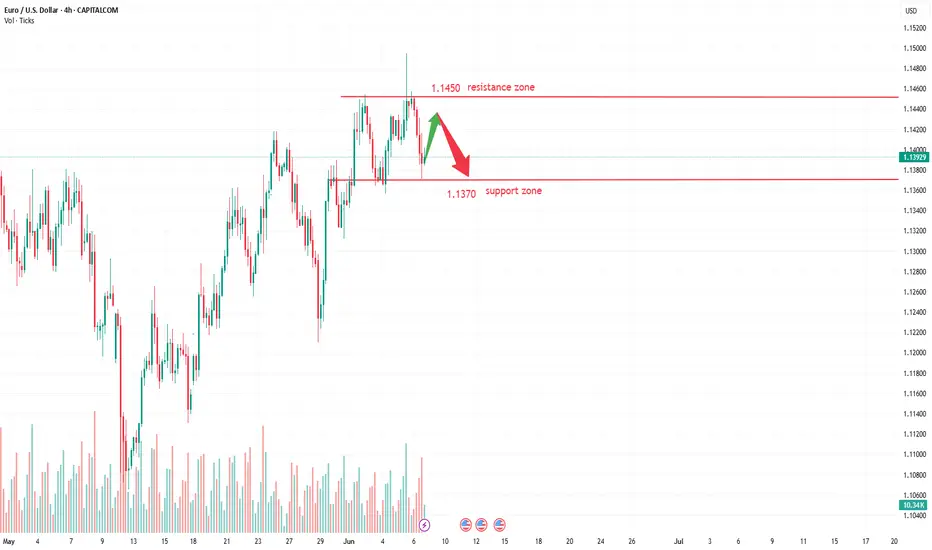
EURUSD MOVE IN 2ND WEEK🔍 Preliminary Technical Analysis:
1. Short-term Trend: The pair appears to be undergoing a corrective move downward after a clear upward trend from around 1.1200 to above 1.1500.
2. Nearby Resistance: Located in the 1.1450 to 1.1500 area.
3. Nearby Support: The 1.1350 level is acting as a potential support; breaking below it may push the price toward 1.1300 or even 1.1250.
4. Price Pattern: There's a possibility of a double top formation or a corrective ABC pattern.
🧠 Likely Scenario (Not Guaranteed):
If the price continues to move below 1.1450 and fails to form higher highs, we might see a further drop toward:
Target 1: 1.1350
Target 2: 1.1300
However, if the price breaks above the 1.1450 area and holds, an upward move toward 1.1500 and possibly 1.1550 could occur.
🛠️ Recommendations:
Watch how the price behaves around 1.1350: Is there a reversal candle pattern or a strong breakout?
Use supporting indicators like RSI or MACD to confirm momentum.
Avoid entering trades without confirmation from candlestick patterns or breakouts.
EUR/USD Analysis – Possible Scenarios🔹 Price is currently trading around 1.1421, consolidating between key supply and demand zones.
🔴 Supply Zone (Order Block 1H): 1.14360 – 1.14590
📌 Strong bearish reaction from this resistance area. First scenario: rejection from this OB and a move downward.
🔵 Demand Zone (Order Block 4H): 1.13050 – 1.13430
✅ If price fails to break the resistance, we could see a retracement to this OB. Bullish reaction here may offer long opportunities.
🟢 Fair Value Gap (FVG 1H): 1.11800 – 1.12220
📉 If OB 4H fails to hold, price could drop into this FVG area – a high-liquidity zone for potential reversal.
📊 Possible Scenarios:
1️⃣ Break and hold above OB 1H → price may extend toward next OB zone at 1.15150 – 1.15400
2️⃣ Rejection from OB 1H → pullback to OB 4H → possible long setup if confirmed
3️⃣ Break below OB 4H → deeper move into FVG 1H
‼️ Avoid premature entries – wait for valid confirmations.
🔍 Insight by ProfitaminFX
If this outlook aligns with your bias, or if you see it differently, feel free to share your perspective in the comments. Let’s grow together 📈

EURUSD LONGI see a build up of shorts for the dollar and reduction in longs . The dollar seems like it will continue short we might see it rally for a bit to take out more buyers I have a max SL of 150 pips which if reached invalidates my idea for the month. However I do have a tighter one for my entry .
I’m targeting imbalances and liquidity above .
eurusd shortEUR/USD loses its traction and trades below 1.1400 in the second half of the day on Friday. The pair struggles to build on the ECB-inspired gains and looks to end the week little changed as the US Dollar (USD) benefits from the better-than-expected Nonfarm Payrolls reading for May.

Eurusd Currently we are the support zone, so will have to wait to see the break down or it will go back up

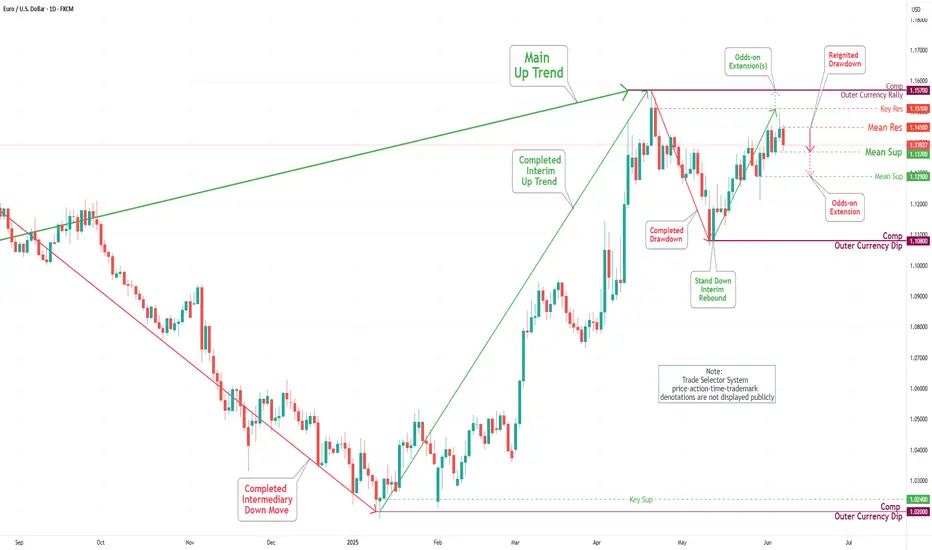
EUR/USD Daily Chart Analysis For Week of June 6, 2025Technical Analysis and Outlook:
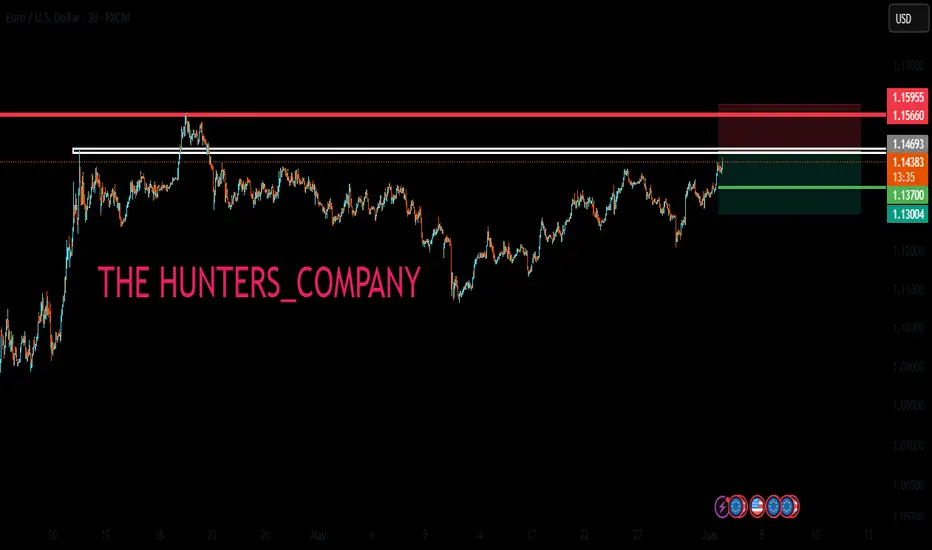
During the current trading session, the Eurodollar has exhibited notable volatility, mirroring patterns observed in the previous week. The currency surpassed a significant Mean Resistance level of 1.142 and encountered substantial resistive price action near the crucial Key Resistance level of 1.151. Recent analyses indicate that the Euro is likely to approach the critical Mean Support level at 1.137 and may decline to the subsequent Mean Support level at 1.129. Nevertheless, there exists the possibility of an upward movement from the current level or the Mean Support at 1.137, which could result in a target Mean Resistance of 1.145 and a retest of the Key Resistance at 1.151.
POST NEWS (EUR/USD)this week wasnt a good week for post news trading this strategy needs some refinement .. lets see
EUR/USD - 4H Analysis - High Probability Trade Setup🔍 Bias: Bullish continuation (Wave 5 setup)
📌 Key Confluences:
Wave (4) is retracing into a key demand zone with strong volume support.
Price is approaching the 71% Fibonacci retracement, a proven institutional entry level.
Ichimoku cloud is holding as dynamic support.
Wave (5) projection targets 1.1550–1.1600 zone (Swing Range).
🎯 Trade Idea:
Buy EUR/USD between 1.1280 – 1.1320
Stop Loss: Below 1.1220 (invalidates wave count)
Take Profit: 1.1550 (1:3+ RR)
⚠️ Risk Note: Confirmation via bullish engulfing candle or volume spike would increase the entry's conviction.
This setup offers strong confluence for a wave 5 rally, making it a high-probability long trade toward the upper swing range.
Follow along for more setups
