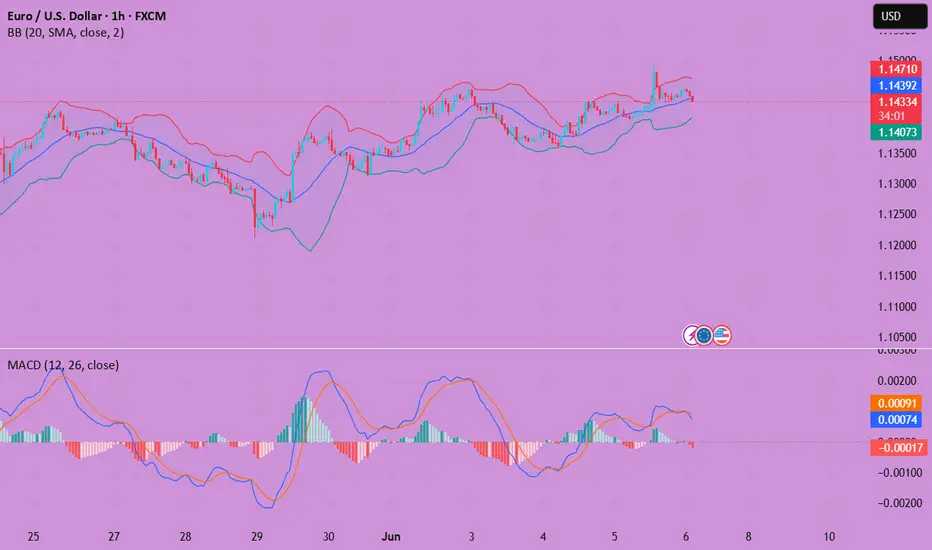
EURUSD ahead of NFPYesterday, the ECB cut interest rates, and EURUSD climbed to 1,1495.
Today, the U.S. jobs data (NFP) will be released.
This news comes out on the first Friday of every month at 1:30 PM London time and tends to have a significant impact on the market.
It's advisable to reduce risk on open positions and avoid rushing into new trades before the news is released.
Watch how the price reacts around key levels and whether it has the strength to continue the trend.
USDEUX trade ideas
EURUSD(20250606) Today's AnalysisMarket news:
The European Central Bank cut three key interest rates by 25 basis points. Lagarde hinted that the rate cut cycle will end, and the market is no longer fully pricing in another 25 basis point rate cut this year.
Technical analysis:
Today's buying and selling boundaries:
1.1447
Support and resistance levels
1.1537
1.1503
1.1481
1.1412
1.1391
1.1357
Trading strategy:
If the price breaks through 1.1447, consider buying, and the first target price is 1.1481
If the price breaks through 1.1412, consider selling, and the first target price is 1.1391
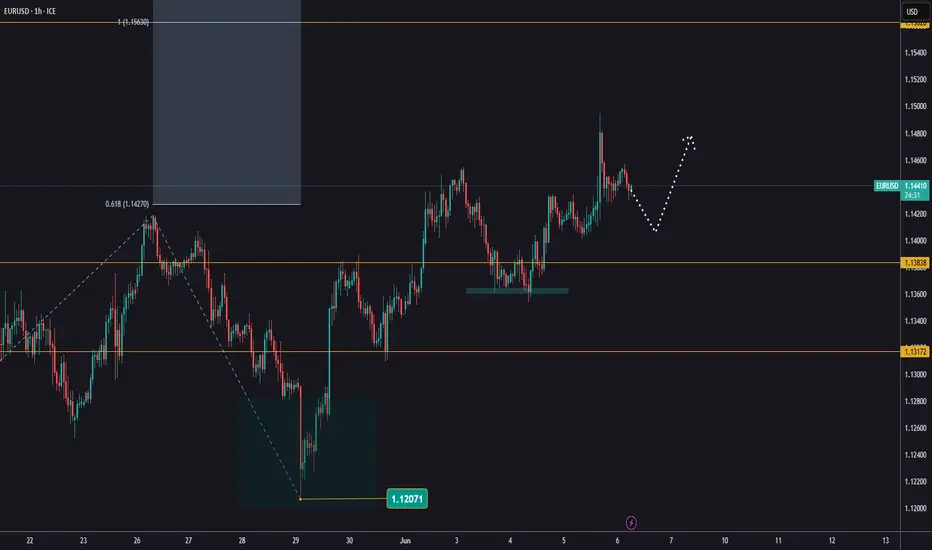
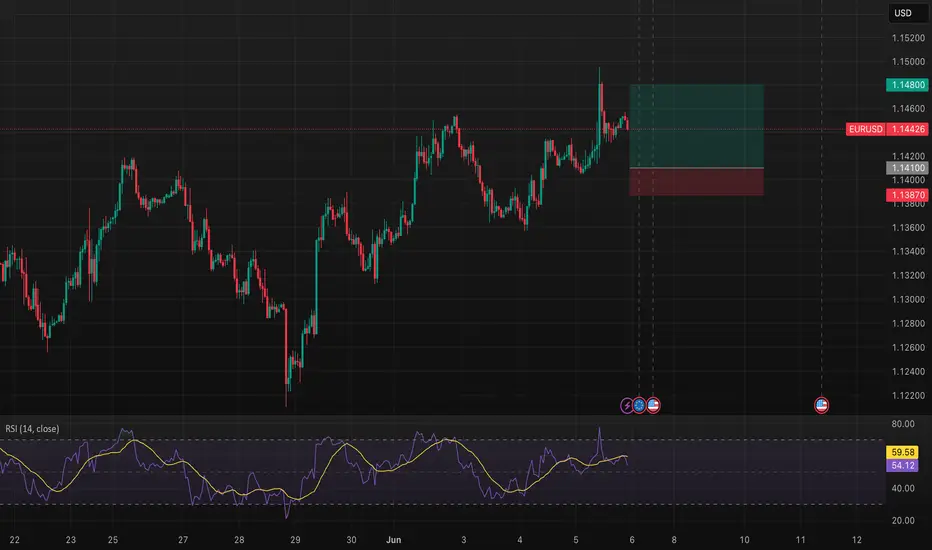
EUR/USD – Bullish Smart Money SetupAfter a clean break of structure to the upside (BOS), EUR/USD is expected to retrace into the unmitigated demand zone before continuing higher.
Liquidity sits above the recent Weak High, making it a prime target for institutions.
📍 Buy Limit: 1.14100
🛑 SL: 1.13870
🎯 TP1: 1.14550
🎯 TP2: 1.14800+
Structure: Bullish ✅
OB Unmitigated: ✅
RSI Neutral-Bullish ✅
Liquidity Above: Yes ✅
"Wait for mitigation and confirmation before execution."
Bearish outlook After previous liquidity taken into a bearish rejection area , I would love to see algorithm head lower for liquidity
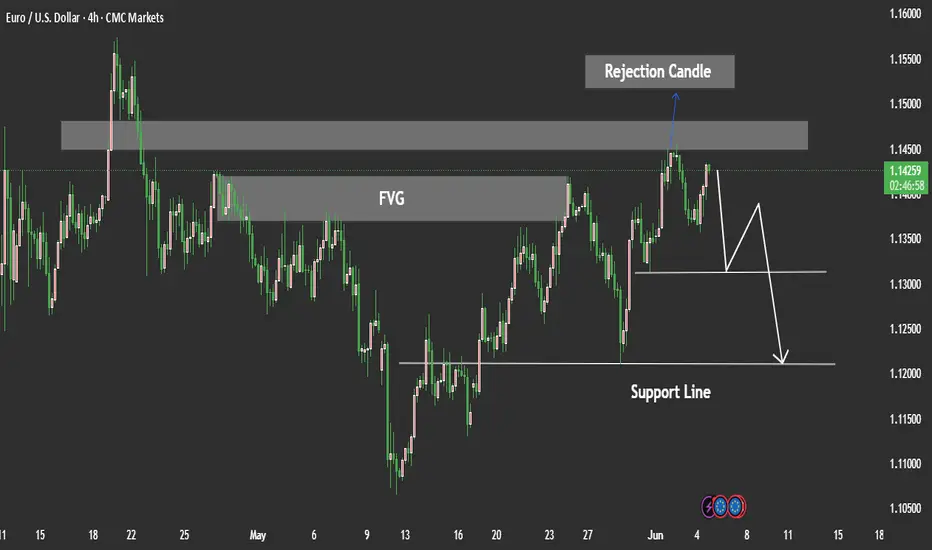
EURUSD Decline Potential Bearish StructureEUR/USD appears to have formed a rejection from a key resistance zone, suggesting a potential move to the downside. The rejection aligns with a 4H Fair Value Gap (FVG) acting as supply A liquidity sweep above recent highs Evidence of pending structure formation, indicating possible internal weakness.
If we see a confirmed close below the marked support zone, this would likely validate a bearish market structure break, paving the way for a clean continuation of the downtrend.
Traders look our idea every day we will share better experience with you we need support from you Guys Thanks For Supporting.
Third Position in Long PositionHi Dear Mehdi.
This is the third example for this kind of positioning in long waves.
Is it right ?

Weekly technical analysis EURUSDIn the weekly Time-Fractal, price has gathered high liquidity above the weekly range after completing two price moves. If price retraces to the support zone marked in yellow on the chart, and a suitable candlestick setup appears along with increased liquidity, one could consider entering long-term buy trades targeting 1.24000. Please note that this is purely an analysis.

My Send Example of EURUSDHi Dear Mehdi,
This is my second example for Buy Position,
Check it out and let me know your Idea.

EURUSD - SellEntered this earlier on the 1min TF
Target will be the first Order Block which is 21:RR.
The reason I am targeting here is the 4H order flow is still bullish. So if we can hit the target I close 50% of the position and let the rest ride and manage accordingly to price.
Lets see how it plays out

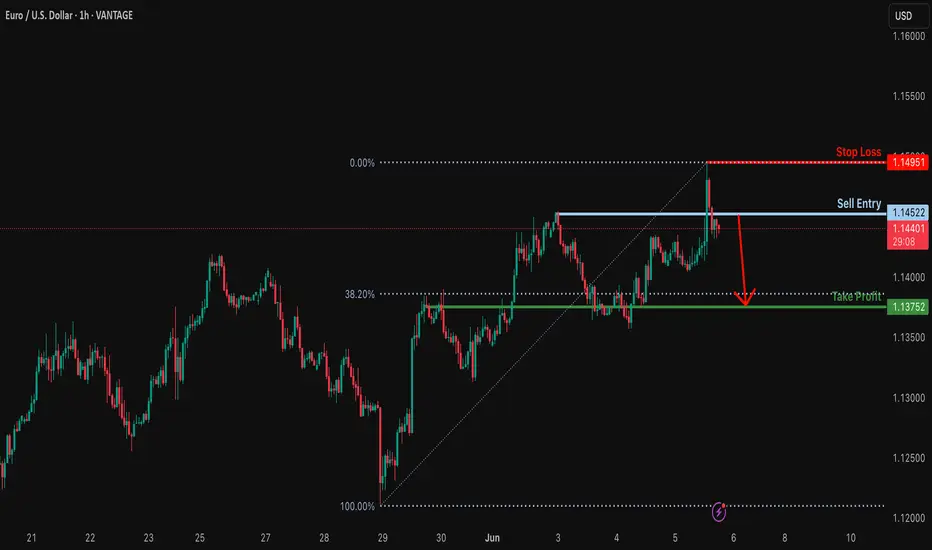
Bearish drop for the Fiber?The price is reacting off the resistance level which is a pullback resistance and could drop from this level to our take profit.
Entry: 1.1452
Why we like it:
There is a pullback resistance level.
Stop loss: 1.1495
Why we like it:
There is a pullback resistance level.
Take profit: 1.1375
Why we like it:
There is an overlap support level that is slightly below the 38.2% Fibonacci retracement.
Enjoying your TradingView experience? Review us!
Please be advised that the information presented on TradingView is provided to Vantage (‘Vantage Global Limited’, ‘we’) by a third-party provider (‘Everest Fortune Group’). Please be reminded that you are solely responsible for the trading decisions on your account. There is a very high degree of risk involved in trading. Any information and/or content is intended entirely for research, educational and informational purposes only and does not constitute investment or consultation advice or investment strategy. The information is not tailored to the investment needs of any specific person and therefore does not involve a consideration of any of the investment objectives, financial situation or needs of any viewer that may receive it. Kindly also note that past performance is not a reliable indicator of future results. Actual results may differ materially from those anticipated in forward-looking or past performance statements. We assume no liability as to the accuracy or completeness of any of the information and/or content provided herein and the Company cannot be held responsible for any omission, mistake nor for any loss or damage including without limitation to any loss of profit which may arise from reliance on any information supplied by Everest Fortune Group.
SMC traders know what's next. Wave 5 completed — tapped into premium supply zone
💧 Liquidity swept from previous highs
🔁 Break of Structure (BoS) confirmed
⚠️ Change of Character (ChoCH) forming — bearish intent showing
🧠 Smart Money preparing distribution
📉 Price expected to mitigate into the demand zone below
🕒 Timing is everything — miss this, and you’ll regret it later

my idea abut EURUSDHi
This is my idea about EURUSD for the future of it with my strategy/
Please check it
Thanks Mehdi
Market next target 🧨 Disruption Points:
1. Overbought Condition / RSI Divergence
Even though the price is surging (+3.30%), there could be an overbought condition forming.
If RSI or other momentum indicators (not shown here) diverge, it might signal weakness in bullish momentum.
> Disruptive idea: Price may fake the breakout (blue arrow) and then sharply reverse, trapping late buyers.
---
2. False Breakout Trap
The red-box area could be a liquidity zone where smart money might induce a fake breakout before dumping.
> Alternative path: Price breaks above temporarily (as in blue path), but then reverses violently back into the range, forming a “bull trap.”
---
3. Volume Anomaly
The volume appears to be decreasing on recent bullish candles after the initial spike.
This suggests that the uptrend may be losing strength, making the yellow arrow scenario less likely.
> Contrary outlook: Lack of volume confirmation could mean a sideways consolidation or reversal is more probable.
---
4. News/Event Risk (Fundamental Disruption)
The chart shows an upcoming economic event (U.S. flag icon), possibly Non-Farm Payrolls (NFP), interest rate news, or CPI.
These events could cause extreme volatility and invalidate all technical patterns.
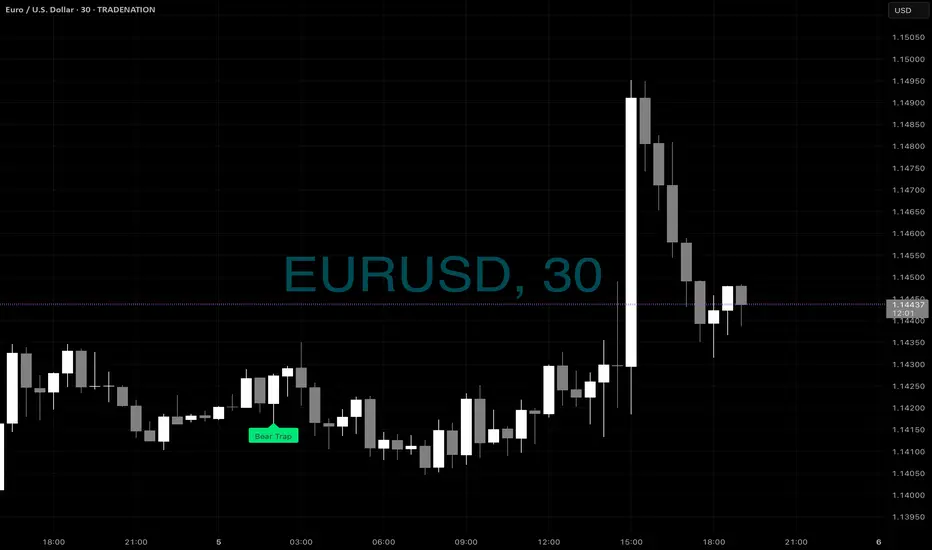
TRAP Warning - EU BuysHere is another example of the Bear Trap Warning - meaning you would only want to look for buy setups after that using your own way of finding entries - be it with SMA’s or RSI or what ever - this is just to keep you on the right side of the coming moves
EURUSD: Will Go Up! Long!
My dear friends,
Today we will analyse EURUSD together☺️
The recent price action suggests a shift in mid-term momentum. A break above the current local range around 1.14403 will confirm the new direction upwards with the target being the next key level of 1.14764 and a reconvened placement of a stop-loss beyond the range.
❤️Sending you lots of Love and Hugs❤️
EURUSD(20250605) Today's AnalysisMarket news:
U.S. economic data-① ADP employment increased by 37,000 in May, far below the expected 110,000 and the previous value of 62,000. ② The U.S. ISM non-manufacturing index in May fell to 49.9, shrinking for the first time in nearly a year, and the expected increase was from 51.6 to 52.
Technical analysis:
Today's buying and selling boundaries:
1.1401
Support and resistance levels:
1.1478
1.1449
1.1431
1.1372
1.1353
1.1324
Trading strategy:
If the price breaks through 1.1431, consider buying, and the first target price is 1.1449
If the price breaks through 1.1401, consider selling, and the first target price is 1.1372
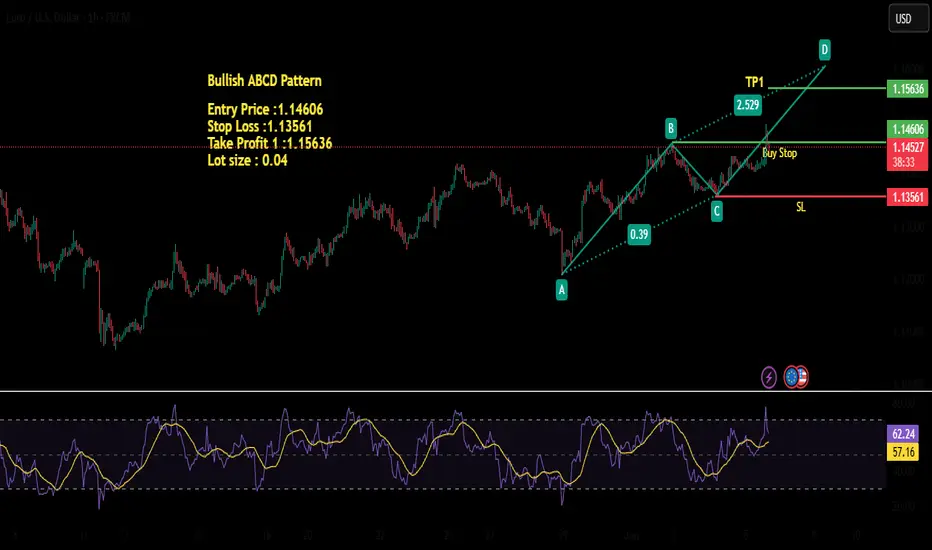
EURUSD | Harmonics ABCDEURUSD is in bullish trend and printing a perfect ABCD pattern,which indicates that it is moving upwards towards potential reversal zone At point D
Aligning With DXY EU is going to be Bearish Day Wednesday.This is My View Analyzing Current Order Flow and Higher Time Frame FVG .. Hybrid ICT. Keep your Eagle Eye on this Chart. I am Bullish On DXY. Today .

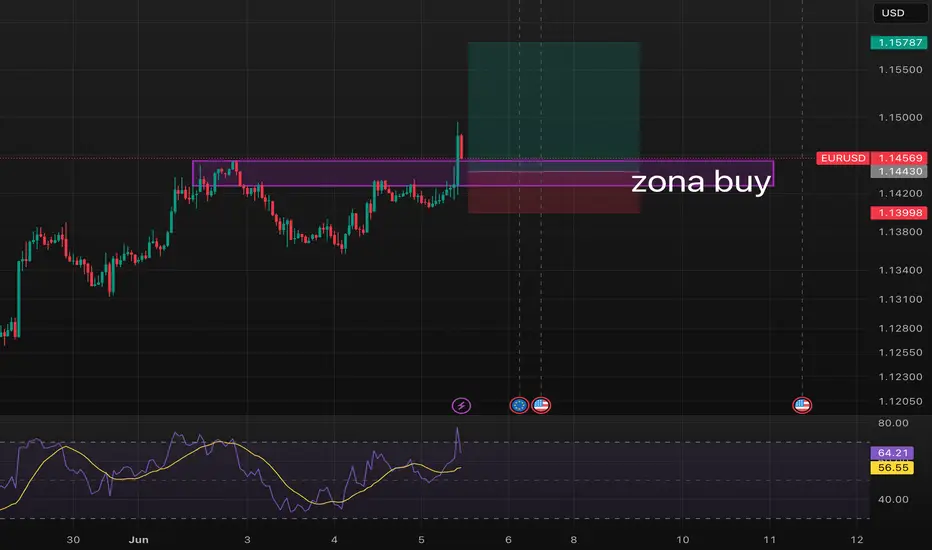
EUR/USD Bullish Breakout from Key Demand ZoneStrong bullish reaction from a well-defined demand zone ('zona buy') on EUR/USD. Price broke above resistance with momentum, confirming buyer interest. The RSI shows bullish strength, supporting further upside potential. Watching for continuation towards the 1.1578 target while managing risk below 1.1399 support.
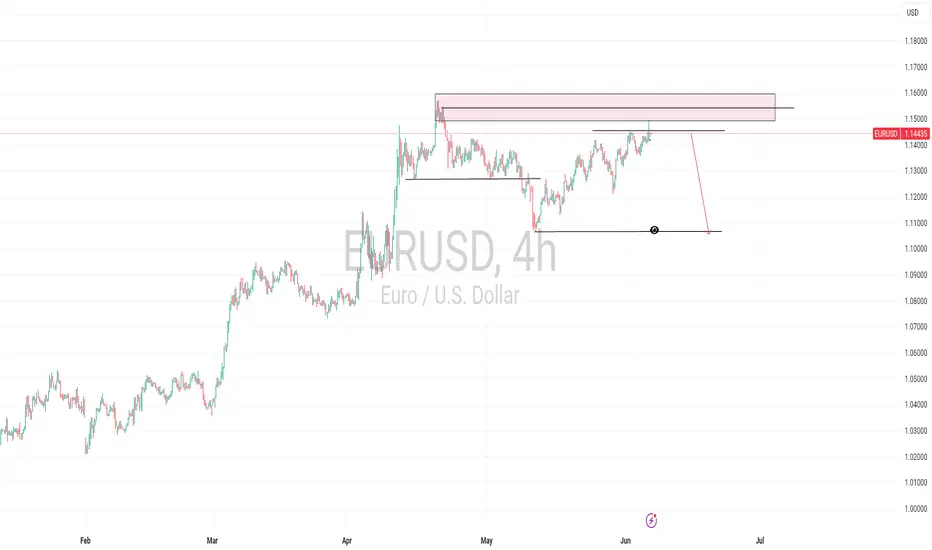
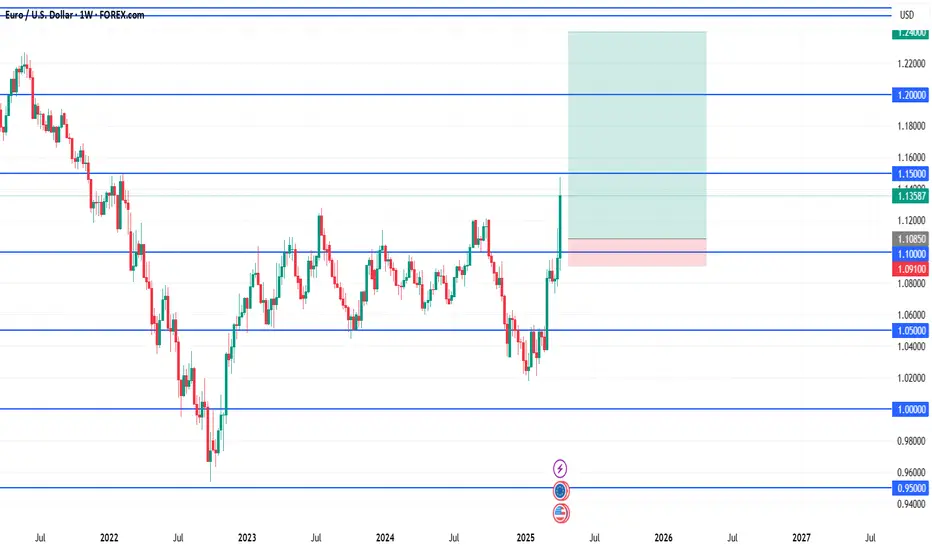
EUR/USD Long📍 Entry (Buy Limit):
1.1085
This is just above the 1.1000 psychological level but below previous minor structure at 1.1100.
Captures a shallow retest without risking being front-run by liquidity sweeps.
🛑 Stop Loss (SL):
1.0910
Below consolidation zone and wicks around 1.10
Provides enough space beneath the major breakout level while staying tight for R:R
🎯 Take Profit Targets:
TP1: 1.1500 (Previous weekly resistance, already tested but not broken)
TP2: 1.2000 (Next clean monthly structure level)
TP3 (macro): 1.2400 (Upper range of long-term channel, highly reactive zone)
⚖️ Risk/Reward:
Risk: ~175 pips
Reward:
• TP1: ~415 pips
• TP2: ~915 pips
• TP3: ~1,315 pips
R:R = 2.4 to 1, 5.2 to 1, 7.5 to 1
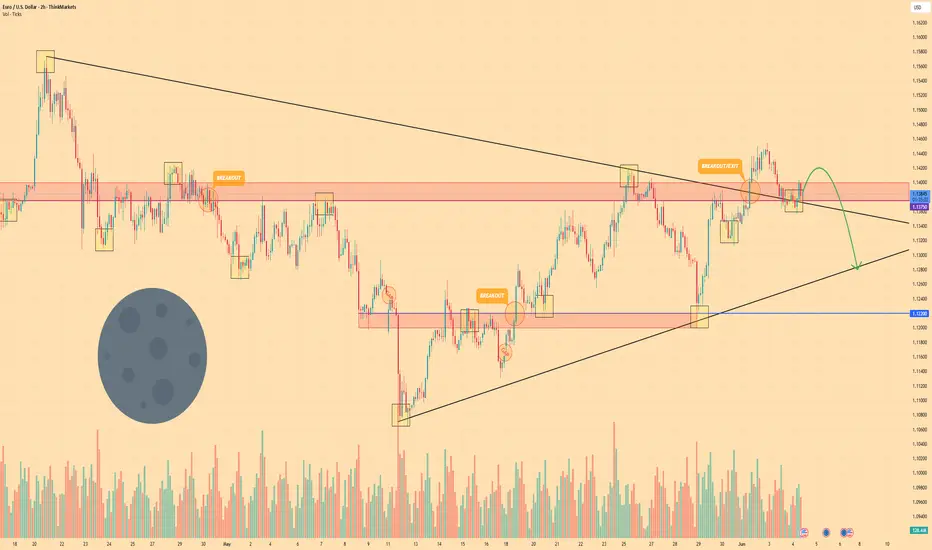
EURO - Price can drop to $1.1280, breaking support levelHi guys, this is my overview for EURO, feel free to check it and write your feedback in comments👊
A few days ago price broke $1.1375 level and then entered to triangle pattern, where it at once dropped from resistance line.
Price fell to $1.1375 level, where it some time traded between and then continued to decline to $1.1220 level.
When Euro declined to this level, it at once broke this level and fell to support line of a triangle pattern.
Next, price turned around and in a short time rose higher than $1.1220 level, breaking it and continued to grow next.
Euro rose to resistance line and then corrected, after which it made an upward impulse, thereby exiting from triangle.
Now, price traded inside resistance area, near $1.1375 level, and I think EUR can drop to $1.1280
If this post is useful to you, you can support me with like/boost and advice in comments❤️
Disclaimer: As part of ThinkMarkets’ Influencer Program, I am sponsored to share and publish their charts in my analysis.
POST NEWS (EUR/USD)ISM: US services activity contracts in May
.
.
.
.
. i lost the previous trade with a small margin usually its so hard to see such a things but we stick to the plan its not like im gambling all my life saving just one percent of the account balance on the other hand the other trade that i had from morning hit the tp so for today im positive till now and everything good ... lets see how this trade can make it ...

EURUSD Long Setup Above 1.14544 – Trendline in FocusFX:EURUSD is showing a potential long setup if price breaks above the 1.14544 level . The trade's potential is influenced by an ascending trendline around 1.14710 . If the market hesitates at this level, it may be wise to close the position or move the stop loss to breakeven .
