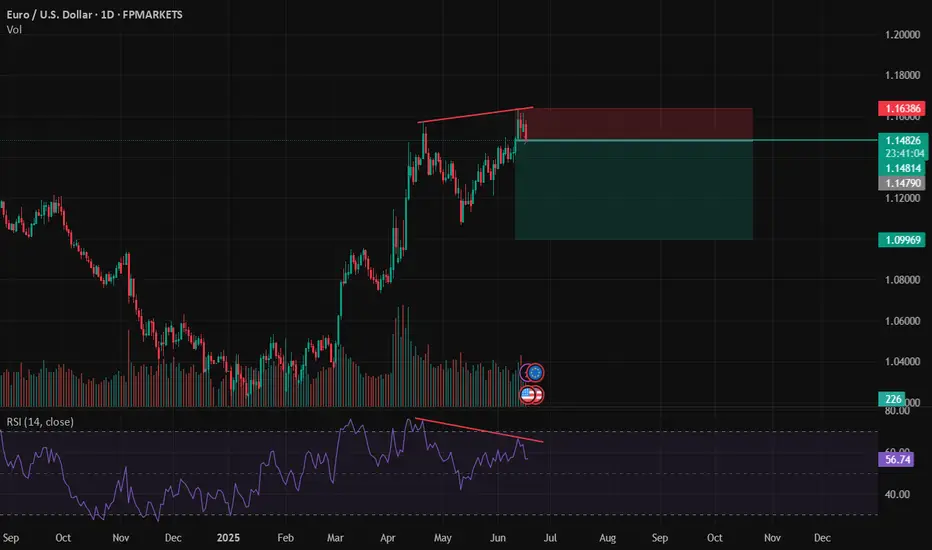
Double TopDivergency double top on the daily chart. This could play out nicely but it will take time.
USDEUX trade ideas
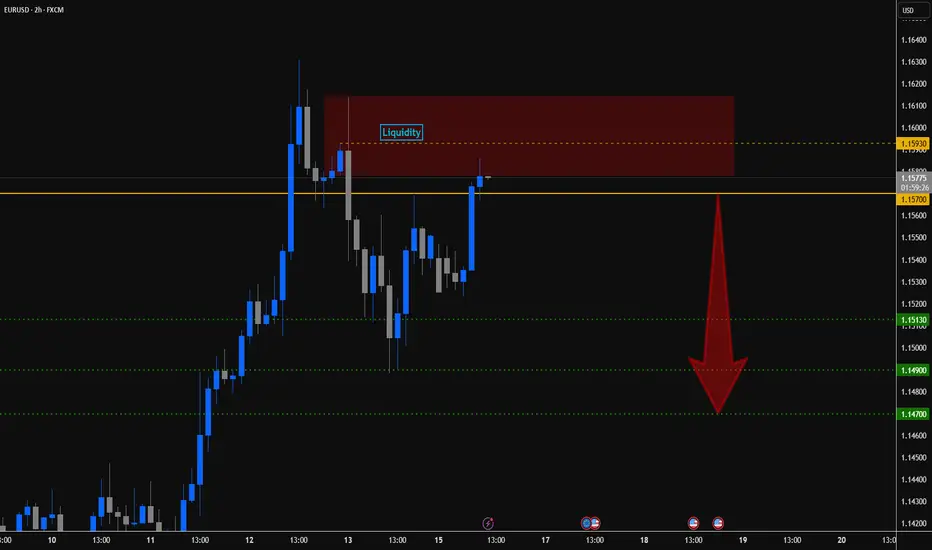
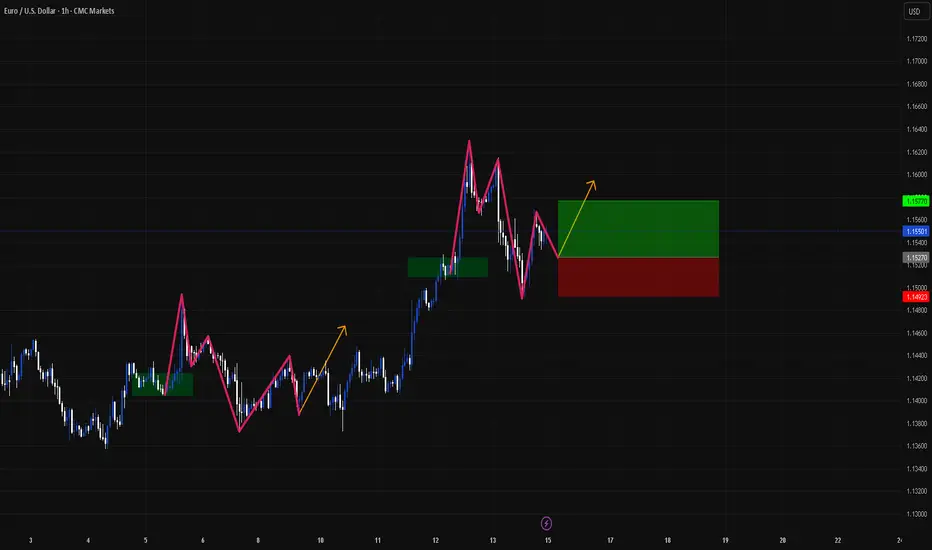
EUR/USD - Potential Targets ( Correction ? )Dear Friends in Trading,
How I see it,
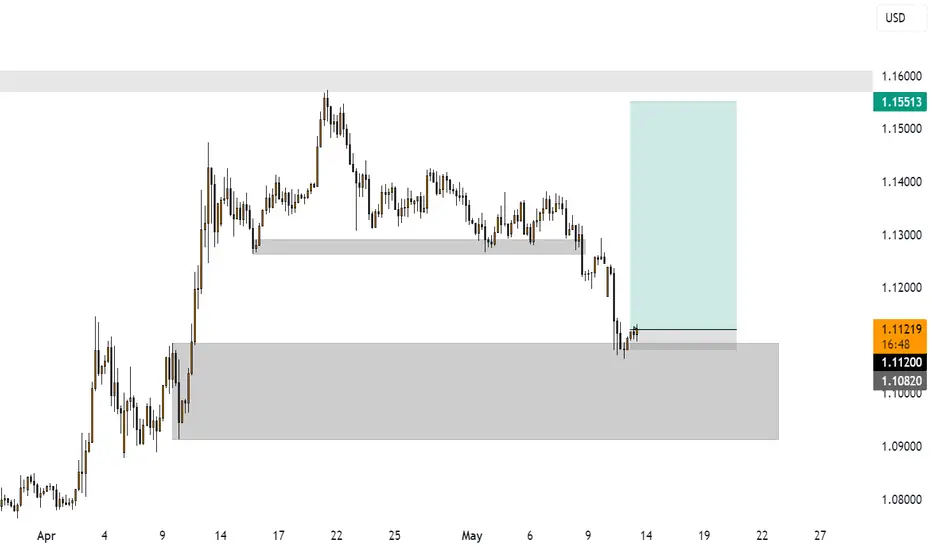
Key Confluence - NOW SUPPORT @ 1.15700
Potential correction below key support
"SHORT" Targets:
1] 1.15130
2] 1.14900
3] 1.14700
I sincerely hope my point of view offers a valued insight.
Thank you for taking the time to study my analysis.
EURUSD Gearing Up for Next Leg Up – DXY Weakens After PPI MissToday, key U.S. economic indexes were released, providing fresh insights into inflationary pressures and the state of the labor market:
Core PPI m/m:
Actual: 0.1% | Forecast: 0.3% | Previous: -0.4%
Lower than expected – suggests weaker underlying producer inflation.
PPI m/m:
Actual: 0.1% | Forecast: 0.2% | Previous: -0.5%
Slight miss – overall inflation at the producer level remains soft.
Unemployment Claims:
Actual: 248K | Forecast: 242K | Previous: 247K
Slightly higher than forecast – signaling some cooling in the labor market.
Market Outlook :
These data releases point toward cooling inflation and softness in job growth, which may strengthen the dovish narrative around the Fed’s next move.
DXY Index ( TVC:DXY ) is under pressure, and EURUSD ( FX:EURUSD ) is showing signs of bullish momentum .
-----------------------------------------------------------
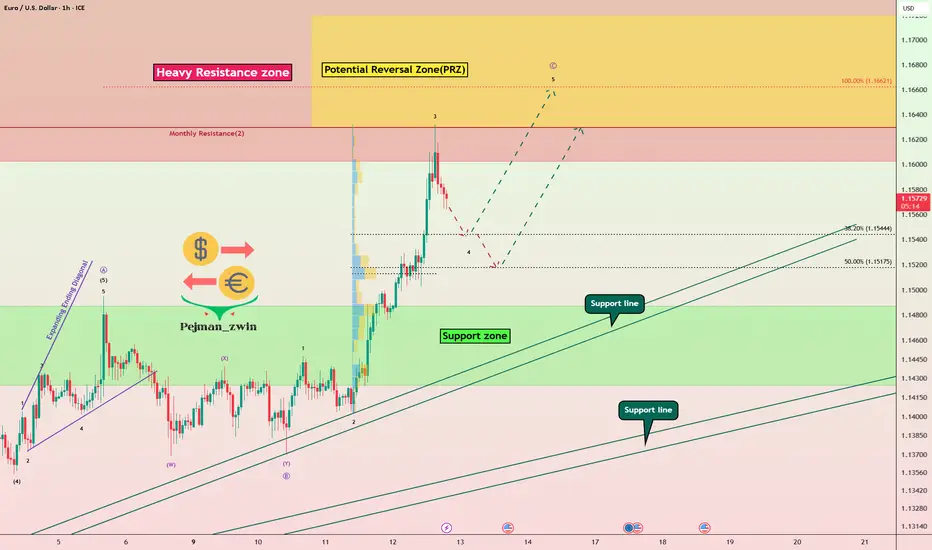
Now let's take a look at the EURUSD chart on the 1-hour time frame .
EURUSD is trading near the Heavy Resistance zone($1.182-$1.160) and Monthly Resistance(2) .
In terms of Elliott Wave theory , EURUSD appears to be completing microwave 4 . Microwave 4 could be completed at one of the Fibonacci levels .
I expect EURUSD to attack the Heavy Resistance zone($1.182-$1.160) at least once more after completing microwave 4 and could even rise to the Potential Reversal Zone(PRZ) .
Note: If EURUSD touches $1.1446 , we can expect more dump.
Please respect each other's ideas and express them politely if you agree or disagree.
Euro/U.S. Dollar Analyze (EURUSD), 1-hour time frame.
Be sure to follow the updated ideas.
Do not forget to put a Stop loss for your positions (For every position you want to open).
Please follow your strategy and updates; this is just my Idea, and I will gladly see your ideas in this post.
Please do not forget the ✅' like '✅ button 🙏😊 & Share it with your friends; thanks, and Trade safe.
EUR/USD Bearish Reversal AnalysisEUR/USD Bearish Reversal Analysis 📉🧭
🔍 Technical Breakdown:
Trend Structure:
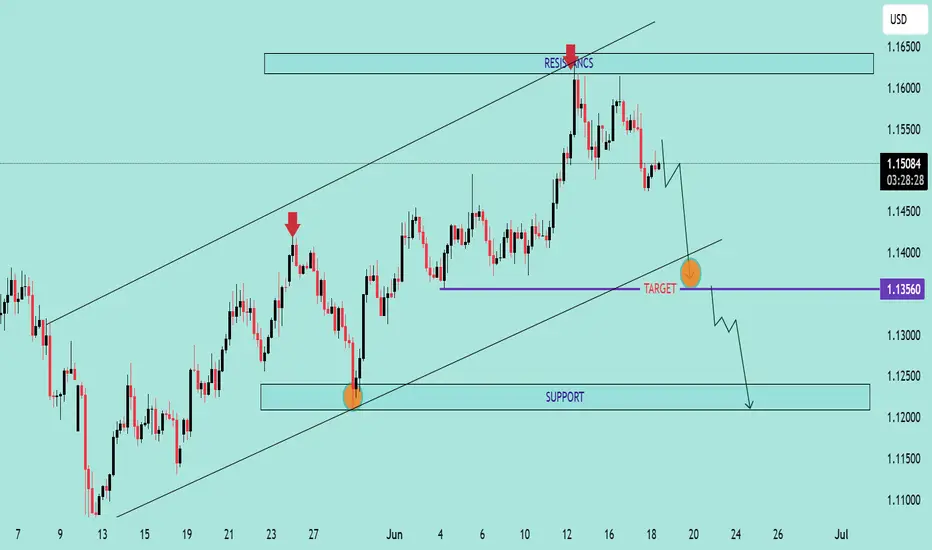
EUR/USD was trading inside an ascending channel, respecting both support and resistance trendlines.
🔴 Double Rejection at Resistance:
Price action faced strong rejection near the upper boundary of the channel and resistance zone (~1.16500), forming a lower high, suggesting bearish exhaustion.
🟠 Key Breakdown Zone:
A critical horizontal support around 1.13560 has been identified as a short-term target zone. This level previously acted as a demand zone and now may be retested.
🔽 Forecast Path:
A projected bearish wave is anticipated:
A potential pullback or consolidation may occur before resuming the downtrend.
Once 1.13560 is broken, price could drop further toward the major support zone around 1.12000, marked by the previous accumulation area.
🟦 Support Zone:
This final target aligns with a major structural support from late May, strengthening the bearish outlook if the breakdown continues.
📌 Conclusion:
EUR/USD is showing signs of a bearish reversal after failing to sustain above resistance. As long as it remains below the mid-channel region, further downside toward 1.12000 is likely, with 1.13560 as the key short-term level to watch.
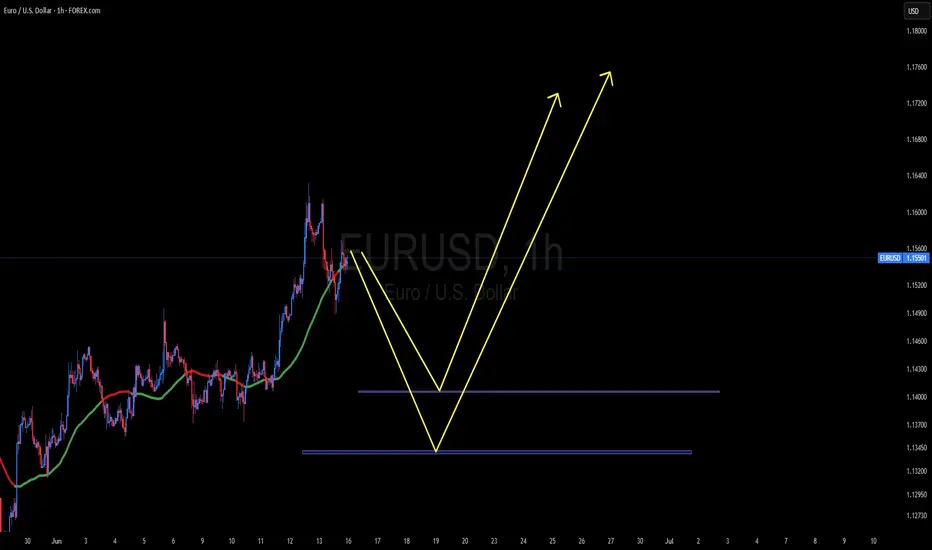
EURUSD 1H. for 50 pips! :)Hello dear traders, this is EURUSD with Nika.
I want to share you this idea, with buy on limit perspective.
We may see this previous and current pattern are strong in connection.
So that's my opinion, about how we may receive some price movement.
It's good trading idea only in low budget. :)
Thank you!
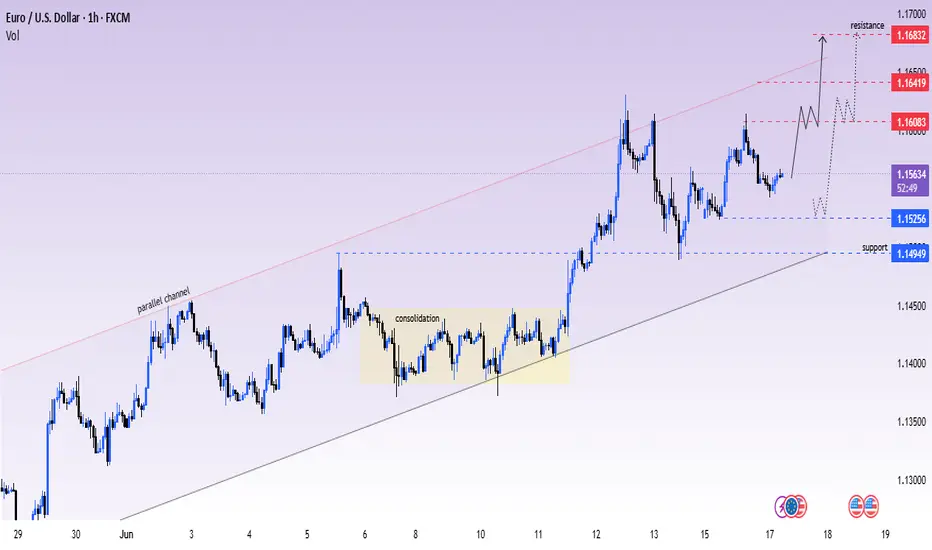
EURUSD price Bullish moment The Euro continues to gain strength against the US Dollar within a clearly defined ascending parallel channel. After a period of consolidation between June 6–10, price broke out with strong bullish momentum and is now respecting the channel's structure.
🔍 Key Levels to Watch:
🔺 Resistance Zone: 1.16083 – 1.16419
🔺 Upper Target: 1.16832 – 1.17000
🔻 Immediate Support: 1.15256
🔻 Strong Support: 1.14949
📈 Bullish Scenario : If price holds above 1.15256, we may see a move toward 1.16083 and potentially a breakout to test 1.16419 and 1.16832.
📉 Bearish Scenario: A drop below 1.15256 and a break of the ascending trendline may expose 1.14949 as the next key support.
🧠 Market Insight: This setup favors a bullish continuation while within the channel, supported by recent strong upside moves. Traders should look for confirmation around 1.16083 before expecting a breakout.
✅ Plan your entries wisely. Trade what you see, not what you feel.
EURUSD 1Hr chart Analaysis EUR/USD is likely to enter a bearish phase, potentially reaching the 1.14069–1.13389 range. This area is a strong candidate for a potential rebound; however, the pair may continue its downward trend. One of the main driving factors behind this bearish momentum is the ongoing conflict in the Middle East, which is contributing to broader market uncertainty and risk-off sentiment.
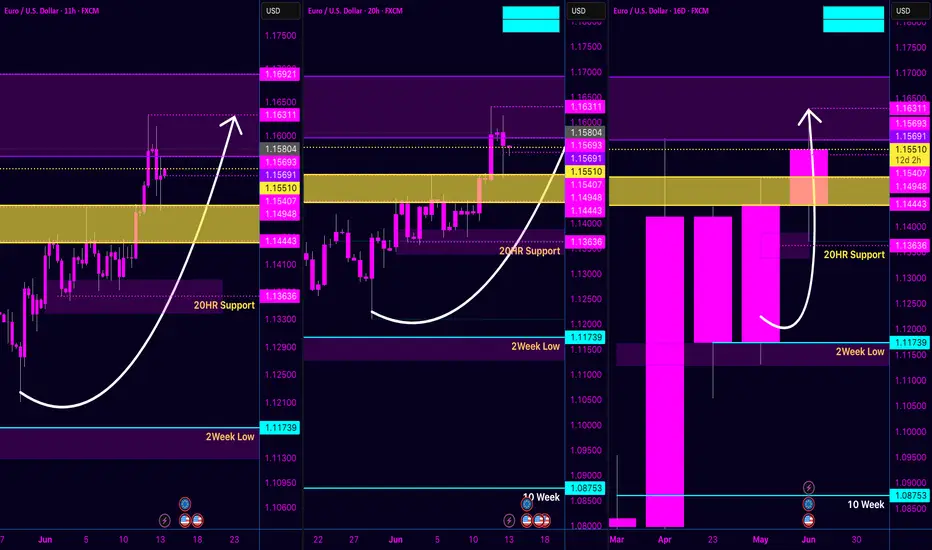
EUR/USD – Bullish Continuation Setup Ahead of Retest Zone
As of today, I’m maintaining a bullish stance on EUR/USD going into mid-2025. Back on May 22, I marked the support zone around 1.10649, and since then price action has respected that zone beautifully, forming higher lows and gaining steady upside momentum.
Looking at current structure across the 11H, 20H, and 16D timeframes, I do not see any strong bearish momentum. If anything, the most recent pullback seems like a natural setup for continuation rather than reversal.
🟡 Key zones to watch:
Support: 1.13636 (20HR Support)
Demand reaction zone: 1.14443 – 1.15407
Resistance/Next target zone: 1.15729 – 1.16311 (Previous swing high)
Upper target potential: 1.16921
We’ve already cleared the minor consolidation and are now holding above the support band. If we get a proper retest of the 1.14948 zone and hold, I expect continuation toward 1.16311, and potentially a breakout above 1.16921 if momentum follows through.
✅ Momentum Outlook: Bullish
📍 Bias: Long
🕰️ Trend: Mid-Term Swing (Higher Time Frame Confluence)
If no macro news disrupts momentum, the technicals point toward a healthy continuation. Let's see if the retest confirms the move. 📊
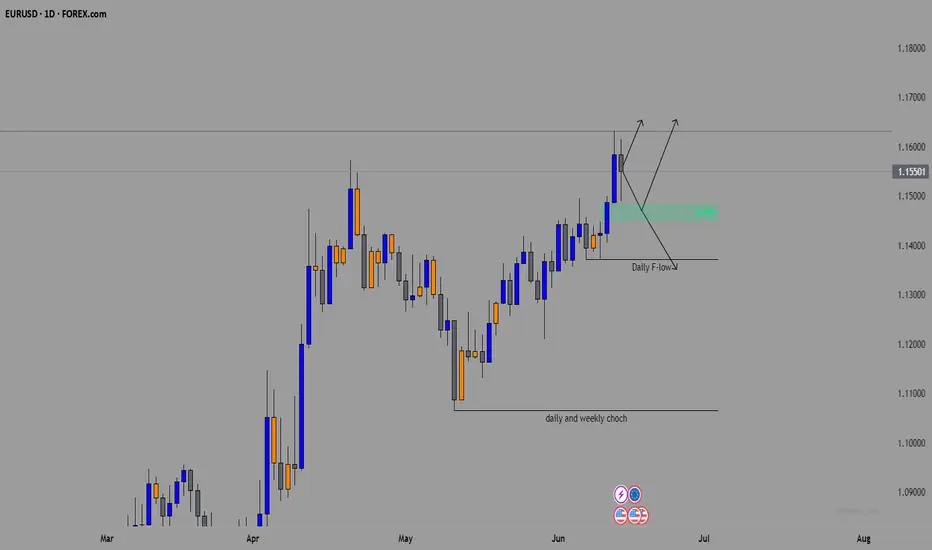
Potential long setup EURUSDTook almost two months for us to take April high well done for those who caught the move. This analysis will probably take a lot less time to play out.
Friday closed with an inside bar which means you would have to go onto lower timeframes to see which direction makes more sense to go.
I have not been given any reason fundamentally or technically to be bearish on the pair just yet so I will be targeting the high.
The daily FVG is a key area to look at and if it fails and we start making bearish FVGs that could be a sign that we will start getting a weekly or even a monthly pullback.
That's all I can say for now stay safe and flow with the markets.
Bullish bounce?The Fiber (EUR/USD) is falling towards the pivot and could bounce to the 1st resistance.
Pivot: 1.1451
1st Support: 1.1342
1st Resistance: 1.1614
Risk Warning:
Trading Forex and CFDs carries a high level of risk to your capital and you should only trade with money you can afford to lose. Trading Forex and CFDs may not be suitable for all investors, so please ensure that you fully understand the risks involved and seek independent advice if necessary.
Disclaimer:
The above opinions given constitute general market commentary, and do not constitute the opinion or advice of IC Markets or any form of personal or investment advice.
Any opinions, news, research, analyses, prices, other information, or links to third-party sites contained on this website are provided on an "as-is" basis, are intended only to be informative, is not an advice nor a recommendation, nor research, or a record of our trading prices, or an offer of, or solicitation for a transaction in any financial instrument and thus should not be treated as such. The information provided does not involve any specific investment objectives, financial situation and needs of any specific person who may receive it. Please be aware, that past performance is not a reliable indicator of future performance and/or results. Past Performance or Forward-looking scenarios based upon the reasonable beliefs of the third-party provider are not a guarantee of future performance. Actual results may differ materially from those anticipated in forward-looking or past performance statements. IC Markets makes no representation or warranty and assumes no liability as to the accuracy or completeness of the information provided, nor any loss arising from any investment based on a recommendation, forecast or any information supplied by any third-party.

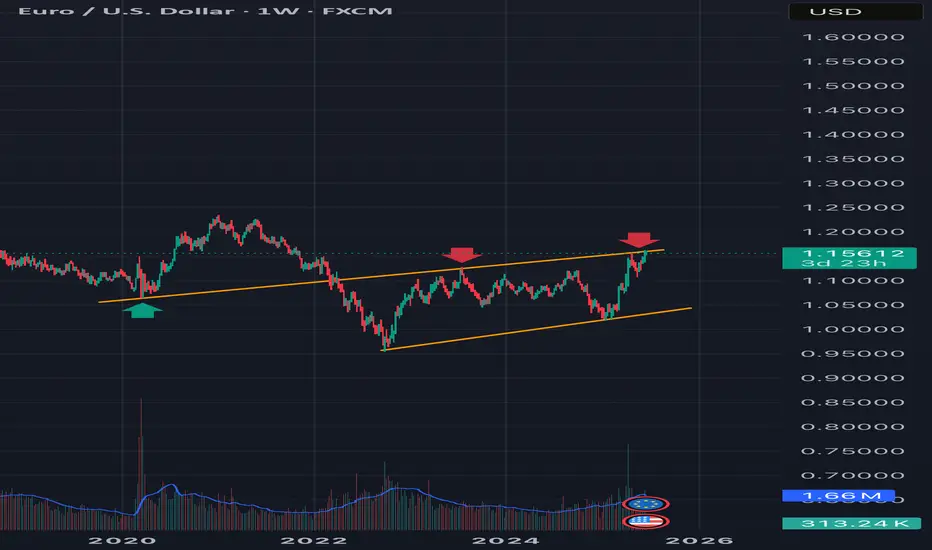
EUR/USD at resistanceAs you can see this trend line on the weekly goes back quite a ways, it was supported by and now has become resistance. Unless it closes above on the weekly timeframe, this area is a good short zone
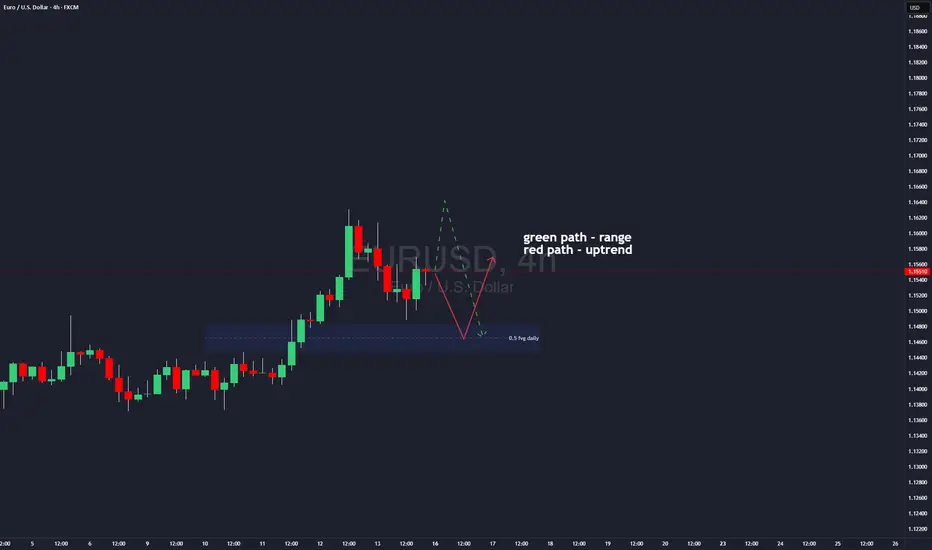
EUR/USD Set to Soar or Crash? Forecast for next weekEverything is simple, if price will drop i will be looking for longs in daily FVG
if price goes up till PWH i will expect move towards daily FVG
If you like this type of content follow and like
I am trying to make my analysis short and simple)
Week of 6/15/25: EU AnalysisEU continues to have clean market structure and has all time frames aligned for bullish movement. Looking for price to retrace to the prime 1h POI for an A+ setup.
Major News:
FOMC - Wednesday

EURUSD ||| '' W '' PATTERN IDENTIFIED . ✅ Harmonic Formation (Bearish Potential)
⚠️ Selling Bias forming soon
---
🧩 Pattern Breakdown:
A Bearish Harmonic Pattern (likely Butterfly or Deep Crab) has been identified and is now nearing completion at the D point.
Current price is approaching key resistance / reversal zone, precisely around the 0.786 - 0.886 fib area (highlighted red).
The Risk-to-Reward is clearly mapped:
🔺 Stop Loss: 1.19405
✅ Entry Zone: Around 1.17106
🎯 Target: 1.09588
Potential short setup if price respects the harmonic symmetry and fails to break above resistance.

EU Loading the Next Leg Up| Bullish Bias in MotionEU gave that clean 4H high break — strong bullish intent locked in.
Zoomed into the 30M and spotted that refined structure doing what it does.
Now just sitting tight, waiting on market open to see if price wants to bless the kid with that next leg up.
High timeframe bias is bullish.
Mid-timeframe structure aligned.
It’s patience time — sniper mentality 🧠🎯
Bless Trading!
EURUSD:Sharing of the Trading Strategy for Next WeekAll the trading signals this week have resulted in profits!!! Check it!!!👉👉👉
Fundamental Analysis:
U.S. May retail sales unexpectedly declined, signaling weak consumption momentum and reinforcing expectations of Federal Reserve rate cuts, weighing on the U.S. dollar.
While the eurozone manufacturing PMI remains in contraction territory, a month-on-month improvement has supported the euro to some extent.
Technical Analysis :
The MACD indicator stays above the zero line with bullish histogram alignment, indicating dominant bullish momentum.Bollinger Bands are slightly widening upward, with price trading above the middle band (support near 1.1500).The RSI at 55 suggests strong bullish sentiment.Price has found support multiple times in the 1.1520–1.1530 zone, forming a key support range.
Trading Strategy:
Initiate long positions after price stabilizes in the 1.1520–1.1530 zone on pullbacks.
buy@ 1.15200–1.15300
TP:1.15800-1.16000
Share accurate trading signals daily—transform your life starting now!
👇 👇 👇 Obtain signals👉👉👉
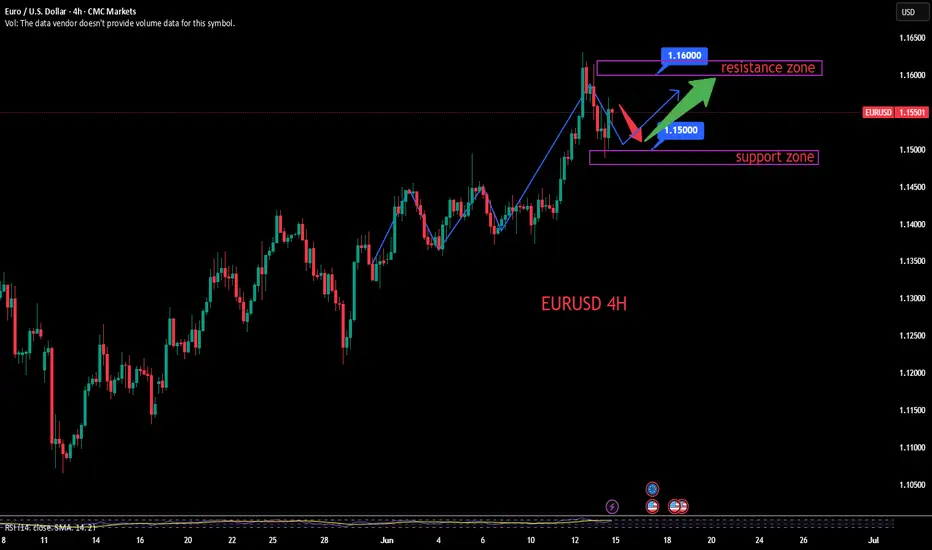
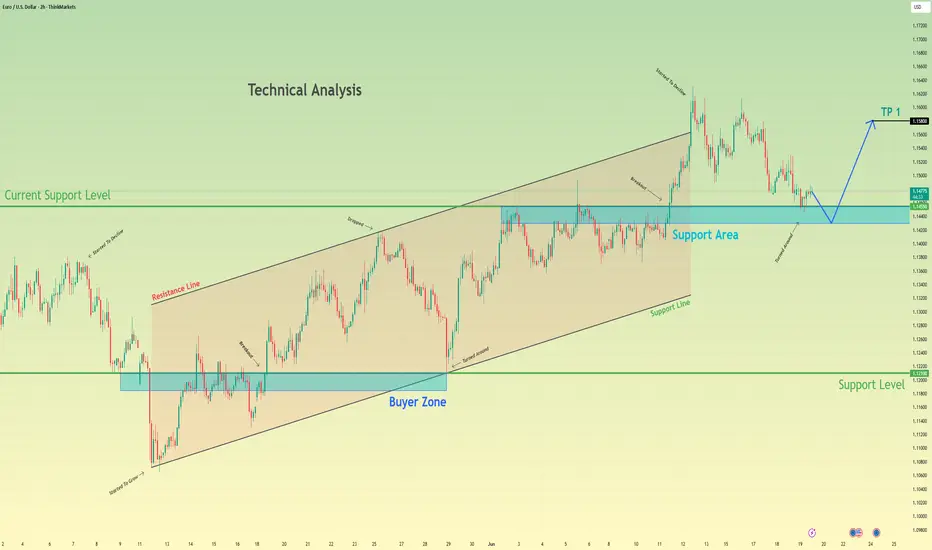
Euro can fall to support area and then rebound upHello traders, I want share with you my opinion about Euro. Observing this chart, we can see how the price, after a period of sideways trading, the price started to grow gradually and formed a consistent bullish structure. The trend was supported by regular bounces from the support line, confirming the bullish sentiment. At some point, price made a temporary drop below the support area, but this move was short-lived; bulls quickly stepped in, and the pair recovered. After that, EURUSD returned back into the channel and began forming higher highs and higher lows again, confirming the continuation of the trend. Right now, the price is declining slightly and approaching the support area again, which is located between 1.1455 and 1.1430. This zone has shown itself as a strong support during previous moves and is now being retested from above. Given the current structure and the upward channel in play, I expect the Euro to rebound from this support area and continue growing toward the 1.1580 points - that’s my current TP 1. Please share this idea with your friends and click Boost 🚀
Disclaimer: As part of ThinkMarkets’ Influencer Program, I am sponsored to share and publish their charts in my analysis.
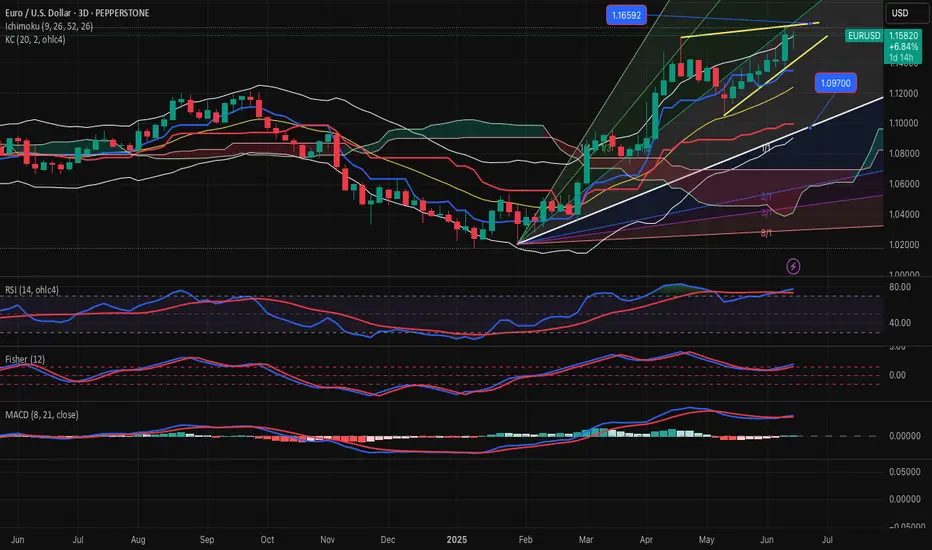
EURUSD-SELL strategy 3D chart GANNThe pressure is still upwards, but overall we are close to a reversal considering the ascending triangle, the Hammer Top and overbought RSI. We may still see 1.1650-1.1700 area before the correction, but feel we slowly should scale into a SELL mode.
Strategy SELL @ 1.1625-1.1675 and take profit near 1.1250 area.
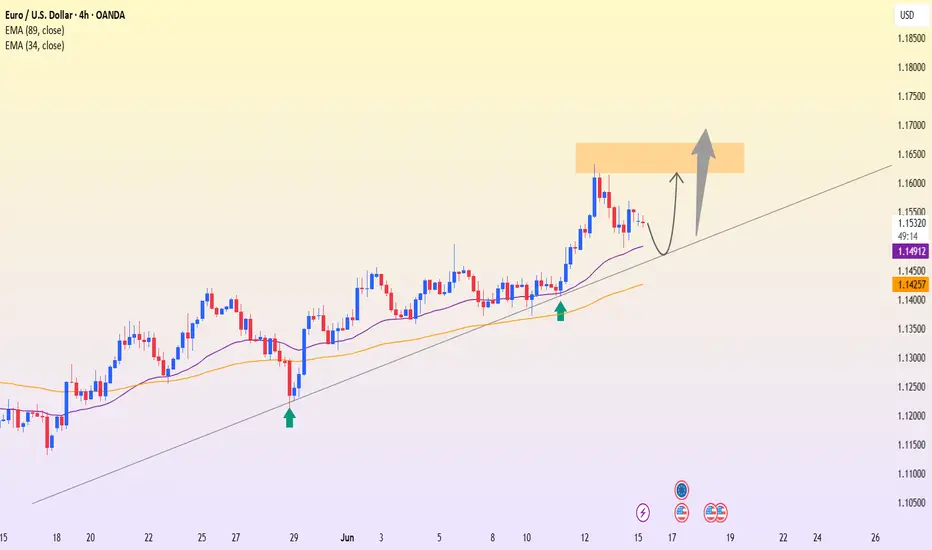
EURUSD: Awaiting Confirmation to Continue the UptrendThe EUR/USD pair closed yesterday at 1.1550, moving within the 1.1526–1.1558 range. The euro continues its bullish trend, driven by U.S. inflation data coming in lower than expected, which increases expectations of an upcoming rate cut by the Fed. In addition, geopolitical tensions in the Middle East—particularly between Israel and Iran—have slightly weakened the U.S. dollar, providing additional support to the euro.
From a technical perspective, the price is currently correcting toward the 1.1480 area, where the ascending trendline converges with the exponential moving average. This is a key support zone. If it holds and a clear bullish signal emerges, EURUSD could rebound and move toward the 1.1610 resistance level.
Main scenario: look for buying opportunities around 1.1480 if a bullish confirmation appears, targeting 1.1610.
Alternative scenario: if the 1.1480 level is broken, the short-term uptrend could be at risk.
EURUSD - market structure EURUSD - market structure , use risk and trade managmne, clean setup. make your own analisys
EURUSD - Shifting from Bearish to Bullish Soon!Hello TradingView Family / Fellow Traders. This is Richard, also known as theSignalyst.
📈EURUSD has been overall bullish trading within the rising wedge marked in blue.
Moreover, the orange zone is a strong support!
🏹 Thus, the highlighted blue circle is a strong area to look for buy setups as it is the intersection of support and lower blue trendline acting as a non-horizontal support.
📚 As per my trading style:
As #EURUSD approaches the blue circle zone, I will be looking for bullish reversal setups (like a double bottom pattern, trendline break , and so on...)
📚 Always follow your trading plan regarding entry, risk management, and trade management.
Good luck!
All Strategies Are Good; If Managed Properly!
~Rich
Disclosure: I am part of Trade Nation's Influencer program and receive a monthly fee for using their TradingView charts in my analysis.

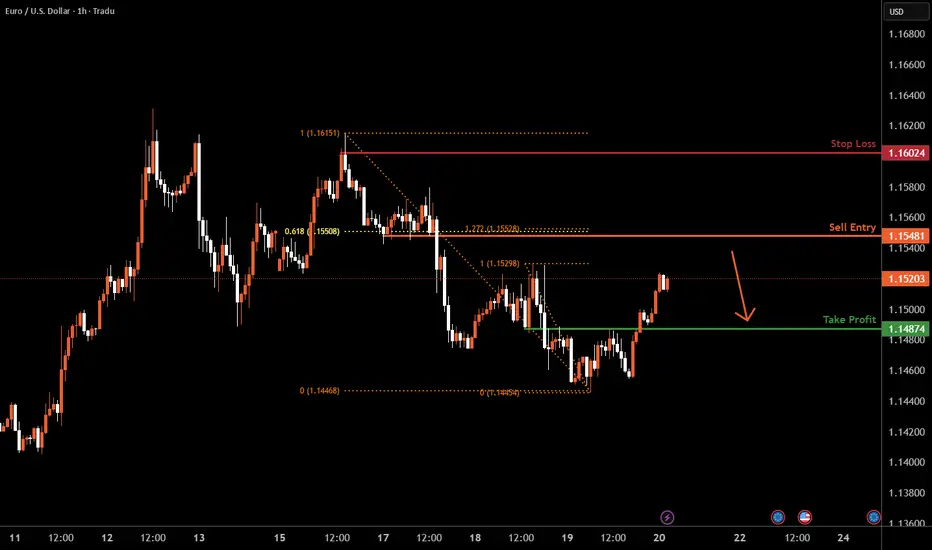
EURUSD H1 I Bearish Reversal Based on the H1 chart, the price is rising toward our sell entry level at 1.1548, a pullback resistance that aligns with the 50% Fib retracement and the 127.25 Fib extension, providing a significant level for a potential bearish reversal.
Our take profit is set at 1.1487, a pullback support.
The stop loss is set at 1.1602, a swing high resistance.
High Risk Investment Warning
Trading Forex/CFDs on margin carries a high level of risk and may not be suitable for all investors. Leverage can work against you.
Stratos Markets Limited (tradu.com ):
CFDs are complex instruments and come with a high risk of losing money rapidly due to leverage. 63% of retail investor accounts lose money when trading CFDs with this provider. You should consider whether you understand how CFDs work and whether you can afford to take the high risk of losing your money.
Stratos Europe Ltd (tradu.com ):
CFDs are complex instruments and come with a high risk of losing money rapidly due to leverage. 63% of retail investor accounts lose money when trading CFDs with this provider. You should consider whether you understand how CFDs work and whether you can afford to take the high risk of losing your money.
Stratos Global LLC (tradu.com ):
Losses can exceed deposits.
Please be advised that the information presented on TradingView is provided to Tradu (‘Company’, ‘we’) by a third-party provider (‘TFA Global Pte Ltd’). Please be reminded that you are solely responsible for the trading decisions on your account. There is a very high degree of risk involved in trading. Any information and/or content is intended entirely for research, educational and informational purposes only and does not constitute investment or consultation advice or investment strategy. The information is not tailored to the investment needs of any specific person and therefore does not involve a consideration of any of the investment objectives, financial situation or needs of any viewer that may receive it. Kindly also note that past performance is not a reliable indicator of future results. Actual results may differ materially from those anticipated in forward-looking or past performance statements. We assume no liability as to the accuracy or completeness of any of the information and/or content provided herein and the Company cannot be held responsible for any omission, mistake nor for any loss or damage including without limitation to any loss of profit which may arise from reliance on any information supplied by TFA Global Pte Ltd.
The speaker(s) is neither an employee, agent nor representative of Tradu and is therefore acting independently. The opinions given are their own, constitute general market commentary, and do not constitute the opinion or advice of Tradu or any form of personal or investment advice. Tradu neither endorses nor guarantees offerings of third-party speakers, nor is Tradu responsible for the content, veracity or opinions of third-party speakers, presenters or participants.
EUR/USD NOW IN BUY ZONE!Looking very bullish Plus bounced off support recently at 1.457.
However watch out for resistance at 1.158 it could pause, reverse or break through.
Of course daily close above resistance would be a very strong bullish trend continuation sign.
Always use Risk Management!
(Just in case your wrong in your analysis most experts recommend never to risk more than 2% of your account equity on any given trade.)
Hope This Helps Your Trading 😃
Clifford
