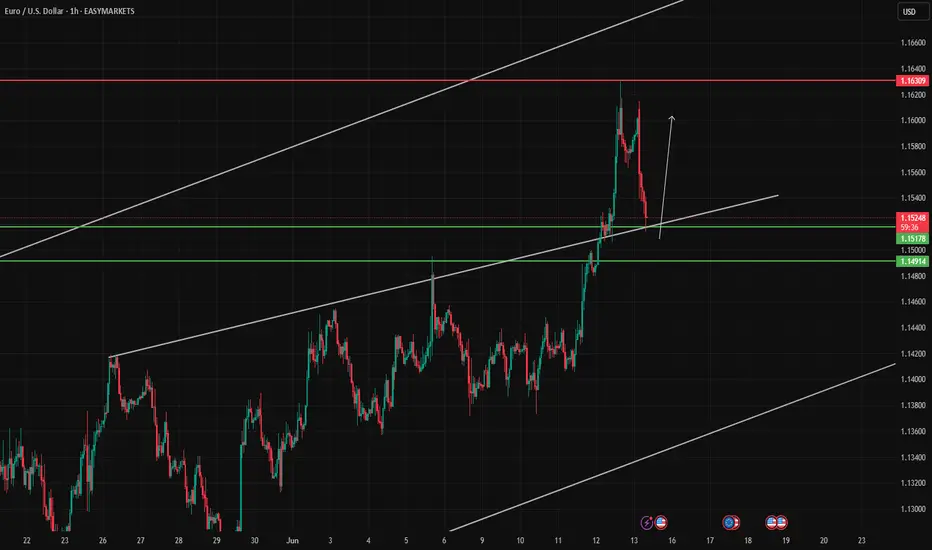
EUR/USD is in an uptrend EUR/USD is in an uptrend and recently broke above the ascending channel before pulling back to retest the breakout zone near 1.1517. If this level holds, the price is expected to resume its upward movement toward 1.1600–1.1630. A break below 1.1490 would invalidate the bullish outlook.
USDEUX trade ideas
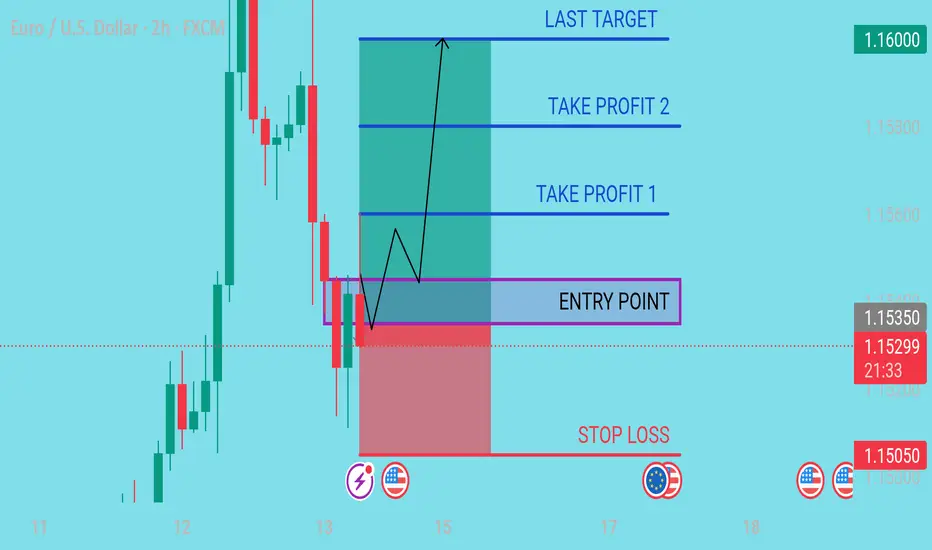
CHECK EURUSD SIGNAL READ CAPTAIN Trade Setup Details:
Entry Price: 1.15350 (marked in grey)
Current Price (as per screenshot): 1.15319
Stop Loss: 1.15050 🔻
Take Profit Levels:
TP1: Around 1.15570
TP2: Around 1.15820
Last Target: 1.16000 🎯
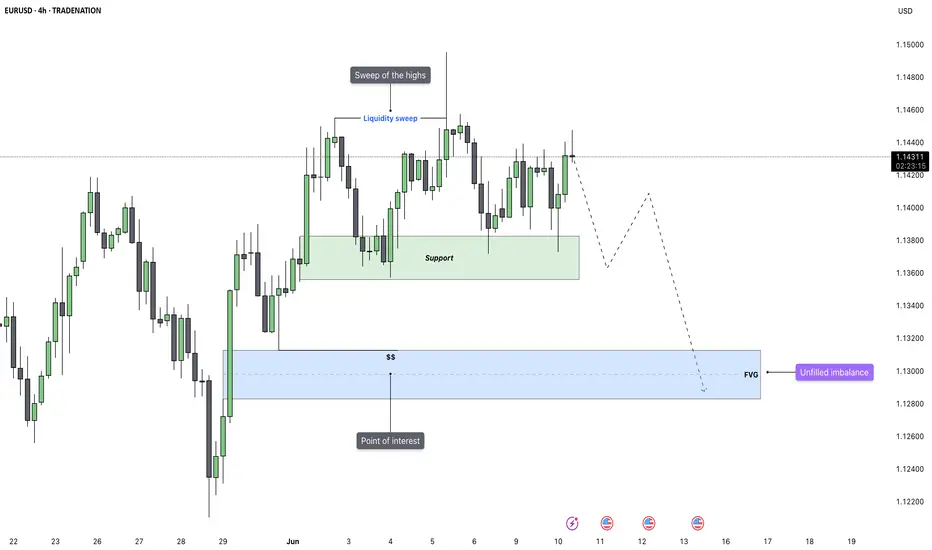
EURUSD - Waiting for the Breakdown After 4H SweepEURUSD has just completed a sweep of the 4H highs, tagging liquidity resting above the consolidation range. That move looks like a classic inducement, with price now reacting lower and showing signs of weakness. This type of sweep, especially when it happens inside a range, often leads to a reversal back through the range, provided the internal low breaks cleanly. Right now, price is still hovering above that key point, but we can see signs of slowing momentum already.
Liquidity Context and Sweep Logic
This recent push above the highs fits well within ICT-style logic: a sweep of internal range liquidity that serves to fuel the opposite move. The chart shows a textbook example of a consolidation phase being manipulated to the upside first, where buy stops get triggered and liquidity is taken. The real move tends to unfold after that, once we get confirmation through structure breaks and displacement to the downside.
Structure Break and Bearish Confirmation
The internal low within the range is acting as a key trigger level. A clean break below that would serve as confirmation of a bearish market structure shift. That’s the point where the market goes from internal liquidity hunt to actual displacement. If that low gives way, the probability of continuation lower increases significantly, and that’s where I’ll be expecting price to seek the next pocket of liquidity.
Support and Key Area of Interest
There’s also a well-respected support level not too far below, one that price has bounced from several times. That area could either act as a temporary reaction zone or, if broken impulsively, could open the path toward deeper inefficiencies. Ideally, I want to see price break below both the internal low and this support area, then continue toward my next level of interest where I expect either a reaction or a higher probability setup to form.
Conclusion
For now, this setup is a waiting game. The liquidity has been swept on the upside, and now it’s all about whether the structure confirms to the downside. I’m not interested in chasing the first move. What I want to see is displacement below the internal low and support level, followed by continuation or a clean reaction from the next zone of interest.
Disclosure: I am part of Trade Nation's Influencer program and receive a monthly fee for using their TradingView charts in my analysis.
___________________________________
Thanks for your support!
If you found this idea helpful or learned something new, drop a like 👍 and leave a comment, I’d love to hear your thoughts! 🚀
EURUSD Long-Term Breakout Setup? Wyckoff + High Volume Breakout📍 Chart: EURUSD — Monthly
📈 Tools Used: Wyckoff Logic, Volume Profile, Candle Volume Analysis, Trendline Structure
—
🔍 Market Context
Since 2015, EURUSD has been ranging between ~1.05 and ~1.15, forming a broad horizontal consolidation zone. This structure appears to resemble a potential long-term accumulation phase , according to Wyckoff theory.
Recently, we've seen a breakout of a multi-year descending trendline , accompanied by a candle with volume significantly above the historical monthly average . This is not a minor signal — it could indicate strong institutional interest and a possible Change of Character (ChoCh) .
—
📊 Volume Profile Observations
- Volume has been heavily concentrated around the 1.13–1.14 region, suggesting this may act as a springboard for higher prices.
- The breakout candle didn’t yet escape the overall range, but its volume and momentum show a clear deviation from previous attempts .
—
📐 Technical Structure
- ✅ Break of descending trendline (in place since 2008 highs)
- 🔺 Monthly close above trendline with strong volume
- 🟧 Price still within the upper half of the 2015–2024 range and pushing
—
🧠 Wyckoff Interpretation
This could be a Phase D transition — where price begins testing the upper boundary of the accumulation. If a breakout above 1.20–1.22 occurs with confirmation, we may see Phase E : the mark-up.
In this case, a major macro trend shift may be underway .
—
📌 Conclusion
EURUSD may be in the early stages of a long-term bullish reversal. Volume, structure, and context all support this hypothesis — though confirmation would come only with a decisive breakout from the range.
Many trades and allocations oportunities on the way.
Not financial advice. Educational use only.
—
🧭 What to watch next:
- 🔹 Monthly close above 1.16 (high volume candle)
- 🔹 Volume confirmation in breakout
- 🔹 Retest of volume cluster around close of high volume candle (1.13-1.14)

EUR/USD remains bullish
💡Message Strategy
The EUR/USD exchange rate continued to rise in the European session, gradually approaching the previous high of around 1.1600. The US dollar continued to be under pressure due to the market's rising expectations for the Federal Reserve to cut interest rates this year and the increasing uncertainty surrounding the US foreign trade policy.
US President Trump recently said that he would send letters to trading partners in the next one to two weeks to notify them of unilateral new tariff measures, which once again plunged the market into a state of worry. In addition, the US CPI annual rate in May was 2.4%, lower than the expected 2.5%, which strengthened the bet that the Federal Reserve will restart the interest rate cut cycle in September.
At the same time, the relatively hawkish signal of "interest rates close to neutral levels" released by ECB President Lagarde, coupled with the market's rethinking of the role of the euro in the context of "de-dollarization", jointly supported the upward structure of the exchange rate. Currently, traders are paying close attention to the US PPI data and initial jobless claims to be released in the evening, which may have a traction on the short-term trend of the US dollar.
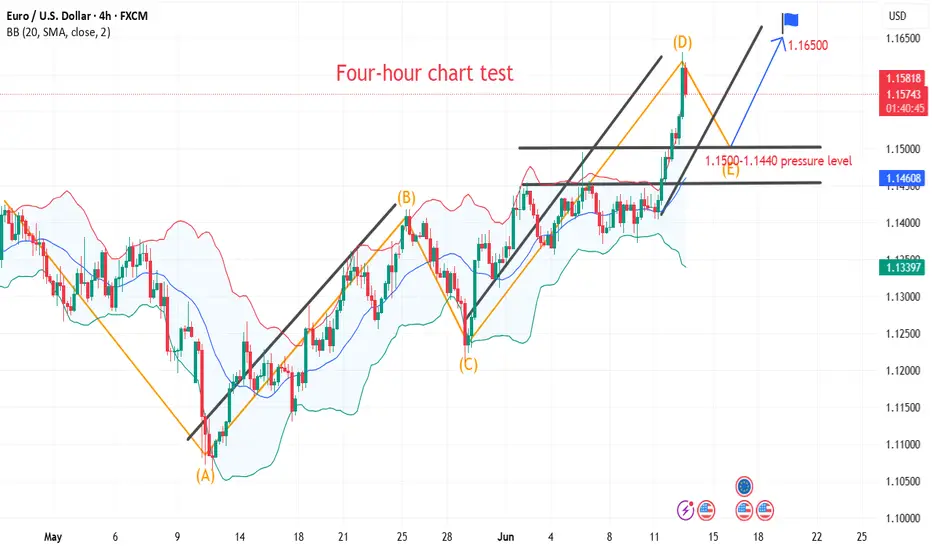
📊Technical aspects
Judging from the chart, the current price of EUR/USD is near the upper track of the Bollinger Band (1.1548), and the Bollinger Band is in an expanding state. The width of the Bollinger Band has widened, reflecting the increase in volatility, suggesting that there may be a possibility of a large-volume breakthrough in the future.
In terms of MACD indicator, the DIFF line continues to rise and forms a golden cross with the DEA line. Although the momentum of the bar chart is not strong, it has not turned negative, indicating that the bullish momentum is moderate; RSI is running around 64, close to the overbought area but no divergence is formed. The market momentum is bullish and the technical side is slightly bullish.
Short-term support is at 1.1500 and 1.1440; if it effectively breaks through 1.1600, the upside space may reach 1.17.
💰 Strategy Package
Long Position: 1.1450-1.1550
17.06.25 Morning ForecastPairs on Watch -
FX:EURUSD
FX:CADCHF
OANDA:XAUUSD
A short overview of the instruments I am looking at for today, multi-timeframe analysis down to what I will be looking at for an entry. Enjoy!

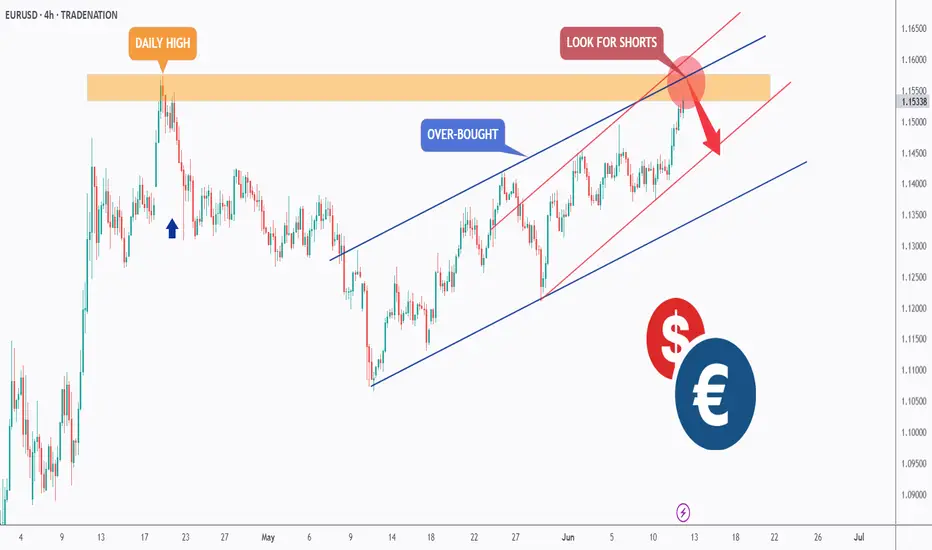
EURUSD - Getting Over-Bought?Hello TradingView Family / Fellow Traders. This is Richard, also known as theSignalyst.
📈EURUSD has been overall bullish trading within the rising channels marked in red and blue. However, it is currently retesting the upper bound of the channels.
Moreover, the orange zone is a major daily high.
🏹 Thus, the highlighted red circle is a strong area to look for sell setups as it is the intersection of the upper blue/red trendlines and daily high.
📚 As per my trading style:
As #EURUSD approaches the red circle zone, I will be looking for bearish reversal setups (like a double top pattern, trendline break , and so on...)
📚 Always follow your trading plan regarding entry, risk management, and trade management.
Good luck!
All Strategies Are Good; If Managed Properly!
~Rich
Disclosure: I am part of Trade Nation's Influencer program and receive a monthly fee for using their TradingView charts in my analysis.
EURUSD +3% Trade Recap 17th June 2025A short position taken on EURUSD for +3%, full explanation as to why I executed on this position and made the decision to manually close at the level I did.
Any questions you have just drop them below 👇

EURUSD - Bearish Double TOPHello Traders !
The EURUSD failed to create a new higher high.
The price formed a Double TOP pattern.
Currently, The neckline is broken !
So, I expect a bearish move📉
_____________
TARGET: 1.13995🎯

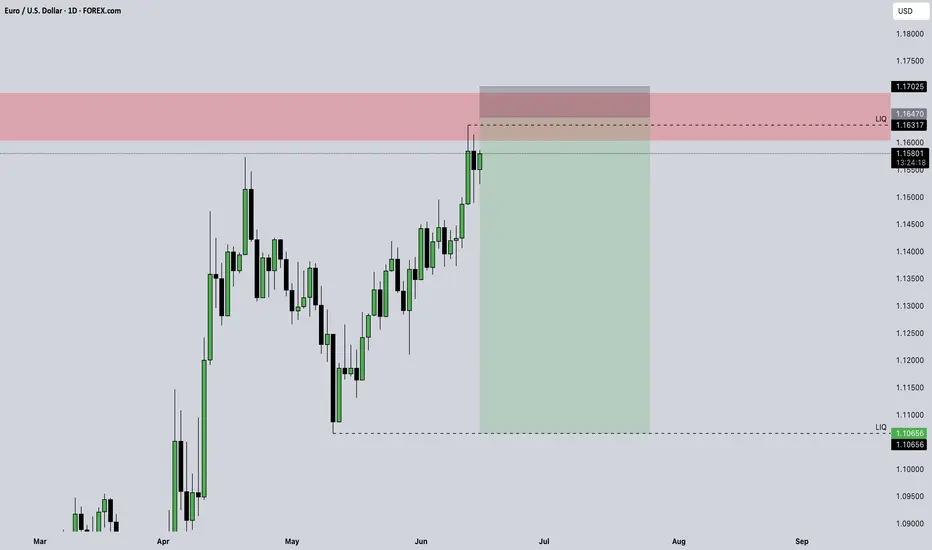
EUR/USD Long-Term Trade Idea (Bullish to Bearish Transition)The EUR/USD pair is expected to enter a bullish phase in the near term, potentially rising toward the key resistance zones between 1.18616 and 1.20143. These levels are likely to act as strong reversal points, where the pair could encounter significant selling pressure.
Once price reaches this zone, a bearish reversal is anticipated, aligning with broader technical signals and long-term resistance structures.
This setup presents an opportunity to ride the bullish momentum toward these levels, then potentially shift to a sell bias upon confirmation of rejection or reversal patterns within that zone.
“Buy the strength, sell the exhaustion — let the market come to you.”

Market Analysis: EUR/USD Faces RejectionMarket Analysis: EUR/USD Faces Rejection
EUR/USD declined from the 1.1640 resistance and traded below 1.1550.
Important Takeaways for EUR/USD Analysis Today
- The Euro started a fresh decline after a strong surge above the 1.1600 zone.
- There is a connecting bearish trend line forming with resistance at 1.1545 on the hourly chart of EUR/USD at FXOpen.
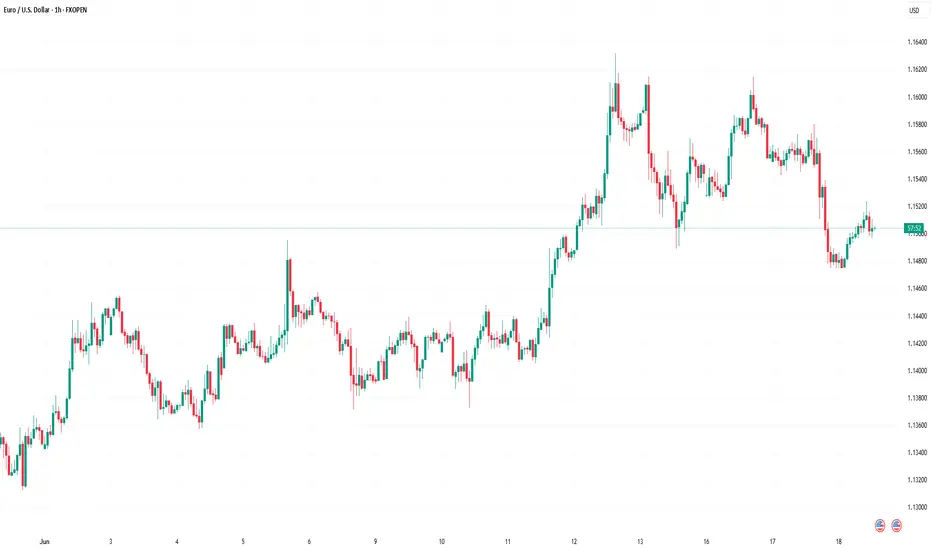
EUR/USD Technical Analysis
On the hourly chart of EUR/USD at FXOpen, the pair rallied above the 1.1600 resistance zone before the bears appeared, as discussed in the previous analysis. The Euro started a fresh decline and traded below the 1.1550 support zone against the US Dollar.
The pair declined below 1.1520 and tested the 1.1475 zone. A low was formed near 1.1475 and the pair started a consolidation phase. There was a minor recovery wave above the 1.1495 level.
The pair tested the 23.6% Fib retracement level of the downward move from the 1.1614 swing high to the 1.1475 low. EUR/USD is now trading below 1.1550 and the 50-hour simple moving average. On the upside, the pair is now facing resistance near the 1.1505 level.
The next key resistance is at 1.1545 and the 50% Fib retracement level of the downward move from the 1.1614 swing high to the 1.1475 low. There is also a connecting bearish trend line forming with resistance at 1.1545.
The main resistance is near the 1.1580 level. A clear move above the 1.1580 level could send the pair toward the 1.1615 resistance. An upside break above 1.1615 could set the pace for another increase. In the stated case, the pair might rise toward 1.1650.
If not, the pair might resume its decline. The first major support on the EUR/USD chart is near 1.1475. The next key support is at 1.1450. If there is a downside break below 1.1450, the pair could drop toward 1.1400. The next support is near 1.1350, below which the pair could start a major decline.
This article represents the opinion of the Companies operating under the FXOpen brand only. It is not to be construed as an offer, solicitation, or recommendation with respect to products and services provided by the Companies operating under the FXOpen brand, nor is it to be considered financial advice.
Mitigation Block in Forex Trading: What It Is and How to Use It?What a Mitigation Block Is, and How You Can Use It When Trading Forex?
Understanding specific market mechanisms like mitigation blocks may enhance strategic decision-making. This article delves into the concept of mitigation blocks, detailing their definition, function, and practical application within forex.
Definition and Function of a Mitigation Block
A mitigation block in forex trading refers to a specific order block on a chart that indicates where previous movements have stalled and reversed, marking it as a potential area for future market turns. This concept within the Smart Money framework is crucial for traders looking to manage their positions by taking advantage of strategic entry and exit points.
The idea behind these areas is rooted in the dynamics of supply and demand within forex. When a currency pair reaches a level where buyers or sellers have previously entered the market in force, causing a reversal, it suggests a potential repeat of such actions when the price returns to the area.
Characteristics and How to Identify a Mitigation Block
Mitigation blocks can be bullish or bearish, each with distinct characteristics:
- Bearish Mitigation Block: This type forms during an uptrend and is identified by a significant peak followed by a decline and a failed attempt to reach or surpass the previous high, creating a lower high. When prices drop below the previous low, the order block above the low becomes mitigation. It may be characterised by an increase in selling volume as the price approaches the level, signalling resistance and a potential downward reversal.
- Bullish Mitigation Block: Conversely, a bullish type is established during a downtrend. It is characterised by a significant trough, followed by a rise to form a higher low, and a failure to drop below the previous low. As the pair moves up, the order block below the high marks mitigation one. This area often shows an increase in buying volume as the price approaches, indicating support and a potential upward reversal.
Mitigation Block vs Breaker Block
Mitigation and breaker blocks are both significant in identifying potential trend reversals in forex trading, but they have distinct characteristics that set them apart. A mitigation block forms after a failure swing, which occurs when the market attempts but fails to surpass a previous peak in an uptrend or a previous trough in a downtrend. The pattern indicates a loss of momentum and a potential reversal as the price fails to sustain its previous direction.
On the other hand, a breaker block is characterised by the formation of a new high or low before the market structure is broken, indicating that liquidity has been taken. This means that although the trend initially looked set to continue, it quickly reverses and breaks structure.
In effect, a breaker appears when the market takes liquidity beyond a swing point before reversing the trend. A mitigation appears when the price doesn’t move beyond the trend’s most recent high or low, instead plotting a lower high or higher low before reversing the trend.
How to Use Mitigation Blocks in Trading
Areas of mitigation in trading can be essential tools for identifying potential trend reversals and entry points. When they align with a trader's analysis that anticipates a reversal at a certain level, it can serve as a robust confirmation for entry.
Traders can effectively utilise these zones by simply placing a limit order within the area once it is considered valid. Validation occurs after a new peak or trough is established following the initial failure swing that forms the mitigation area.
If a liquidity void or fair-value gap is present, the trader may look for such a gap to be filled before their limit order is triggered, potentially offering a tighter entry. Stop losses might be placed beyond the failure swing or the most extreme point.
Furthermore, if a mitigation block is identified on a higher timeframe, traders can refine their entry by switching to a lower timeframe. This approach allows for a tighter entry point and potentially better risk management, as it offers more granular insight into the momentum around the area.
Common Mistakes and Limitations
While these blocks are valuable for forex trading, they come with potential pitfalls and limitations that traders should know.
- Overreliance: Relying solely on mitigation blocks without corroborating with other trading indicators can lead to misjudged entries and exits.
- Ignoring Context: Using these zones without considering the broader market conditions may result in trading against a prevailing strong trend.
- Misinterpretation: Incorrect identification can lead to erroneous trading decisions, especially for less experienced traders.
- False Signals: Mitigation blocks can sometimes appear to signal a reversal but instead lead to a continuation of the trend, trapping traders in unfavourable positions.
The Bottom Line
Understanding mitigation blocks offers traders a strategic edge in navigating the forex market. They can be vital for recognising potential price reversals and improving trading outcomes.
FAQs
What Is a Mitigation Block?
A mitigation block in forex trading is an order block that identifies potential reversal points. It signals where a currency pair has previously stalled, indicating strong buying or selling pressure, suggesting a potential for similar reactions in future encounters with these levels.
How Do You Identify a Mitigation Block?
Mitigation blocks are identified by analysing charts for areas where previous highs or lows were not surpassed, leading to a reversal. Traders look for a sequence of movements, including a swing high or low followed by a retracement that fails to exceed the previous swing.
What Is the Difference Between a Breaker Block and a Mitigation Block?
While both indicate potential reversals, a breaker block forms when the price makes a new high or low before reversing, suggesting a temporary continuation of the trend. In contrast, a mitigation block forms without creating a new extreme, indicating a direct loss of momentum and an immediate potential for reversal.
This article represents the opinion of the Companies operating under the FXOpen brand only. It is not to be construed as an offer, solicitation, or recommendation with respect to products and services provided by the Companies operating under the FXOpen brand, nor is it to be considered financial advice.

Core Impact Logic of the Middle East Situation on EURUSD(I) Energy Transmission Chain: Oil Price Fluctuations → Eurozone Inflation and Economy
The escalation of the Middle East situation (the Iran - Israel conflict, risks in the Strait of Hormuz) directly impacts the global energy supply chain:
If the conflict expands to block the Strait of Hormuz (transports ~20% of global crude oil 🛢️), Brent crude has already soared from recent lows—spiking over 5% on June 17 amid tensions ⛽️. This pushes up imported inflation in the Eurozone.
As a net energy - importing region 🌍, prolonged high oil prices will squeeze corporate profits, suppress consumption, and drag Eurozone economic recovery (German/French manufacturing is acutely energy - cost - sensitive 🏭). This weakens the euro’s fundamental support.
(II) Geopolitical Safe - Haven Sentiment: The "Safe - Haven Balance" Between USD & EUR
Amid Middle East tensions, the US dollar’s traditional safe - haven status competes with Eurozone havens like German bonds 📈:
If the US (e.g., the Trump administration) intervenes militarily 💥, market fears of "America mired in war" rise. USD safe - haven demand may temporarily weaken ⬇️, and the euro benefits as funds shift 🔄
⚡️⚡️⚡️ EURUSD ⚡️⚡️⚡️
🚀 Buy@ 1.14500 - 1.15000
🚀 TP 1.15500 - 1.15600
Accurate signals are updated every day 📈 If you encounter any problems during trading, these signals can serve as your reliable guide 🧭 Feel free to refer to them! I sincerely hope they'll be of great help to you 🌟 👇
EURUSD Bullish trend breakdown ahead selling possible shortEUR/USD Technical Breakdown 🚨
The bullish trendline has been broken, along with the descending triangle support — signaling a potential shift in momentum. 📉
🔍 Entry Level: 1.14800 (Previous Resistance)
🎯 Target Zones: 1️⃣ 1.14300 – Key Demand Zone
2️⃣ 1.14000 – Next Demand Area
3️⃣ 1.13800 – Bullish Order Block (OB)
📊 Timeframe: 1H
We're watching price action closely as it approaches these zones — expect reactions! ⚠️
💬 Drop your thoughts in the

EURUSD After the FedInterest rates remained unchanged, and EURUSD dropped to 1,1471.
Keep an eye out for a continued correction toward the next key support at 1,1370.
From that level, look for signs of a bounce and potential buying opportunities.
Make a note of the news release time and watch for market reaction.

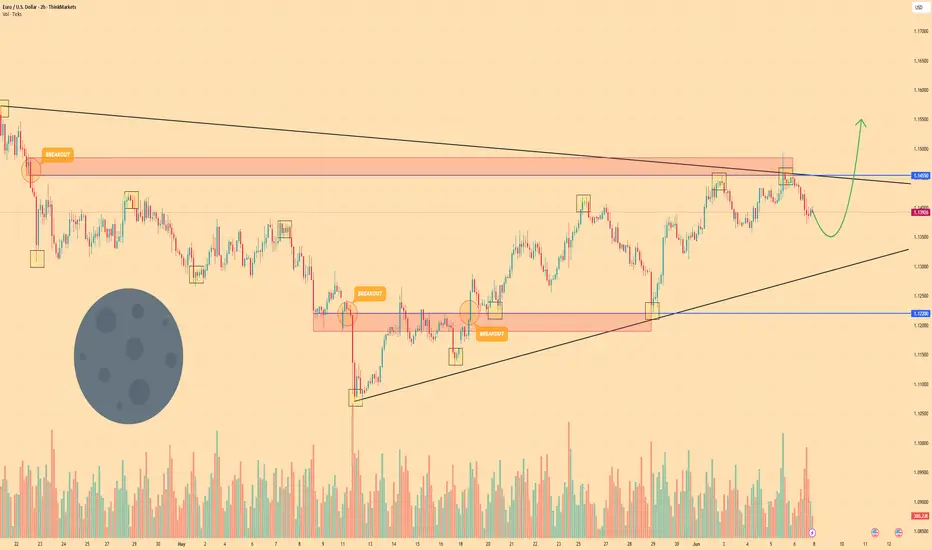
EURO - Price will strart to grow and exit from wedge patternHi guys, this is my overview for EURUSD, feel free to check it and write your feedback in comments👊
Price entered to wedge pattern and at once dropped below $1.1455 level, breaking it and then some time traded below.
It continued to decline and in a short time reached $1.1220 level and broke it, after which fell to support line.
Then price started to grow and soon broke $1.1220 level one more time, after which made a retest and continued to grow.
Euro rose to $1.1420 points and then corrected to support level, after which turned around and rose to resistance level.
Recently price reached resistance level, but then it bounced and started to decline, and now it continues to fall.
I think that Euro can decline a little more and then bounce up to $1.1550, exiting from wedge.
If this post is useful to you, you can support me with like/boost and advice in comments❤️
Disclaimer: As part of ThinkMarkets’ Influencer Program, I am sponsored to share and publish their charts in my analysis.
EURUSD 1H is forming a Potential Bullish Reversal pattern
Price formed a Potential Double Bottom pattern with a neckline as current Temporary Resistance.
• ✅ Entry is triggered only after a confirmation candle breaks above the neckline.
• Buy Stop is placed around the neckline to catch the momentum move.
• Stop Loss is at the recent lower Low (safe and logical placement).
• 🎯 Take Profit levels are based on measured move projections.
Trade Plan:
• Buy Stop = 1.15264
• Stop Loss = 1.14552
• Take Profit 1: 1.15960
• Take Profit 2: 1.16663
• Lot size : 1:2 Risk Reward Ratio
“Waiting for neckline to break with Bullish confirmation candle” – this ensures you enter only on strong momentum.
EURUSD is forming a Potential Bullish Reversal pattern with wait and watch scenario.
Key Highlights:
• ✅ Pattern: Double Bottom
• ⚠️ Confirmation: Break + Bullish candle
• 🔄 Risk Management: Tight SL, 2 TP levels
• 🧩 Confluence: Trendline break + structure shift + RSI Divergence

EURUSD - ShortLooking at shorts on EURUSD. Big chance that we'll take out the daily high before entering lower.
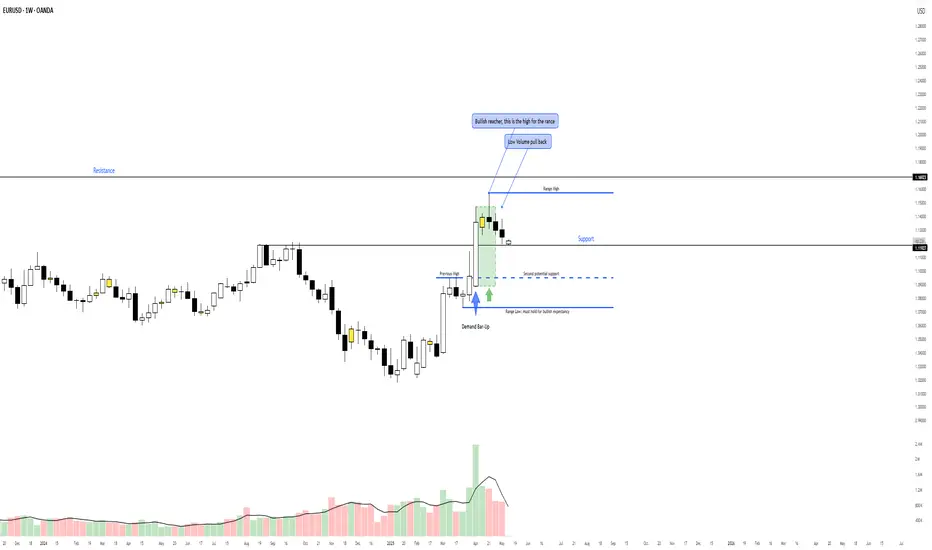
EUR/USD: Weekly PAT + VPA 5/11/2025Trading Analysis EUR/USD - Price Action and Volume Price Analysis
Weekly Structure Analysis: At present, we find ourselves within a bullish weekly range. The lower boundary of this range is 1.07330, established during the week of March 24, 2025, while the upper boundary is at 1.15734, reached the week of April 21, 2025. The price movement from 1.073 to 1.157 has surpassed a swing high, which we will identify as our initial resistance point as we aim to return to 1.15734.
Weekly Price Action Analysis: Analyzing structure and price action reveals similarities. Our confidence in a bullish trend is the anchored weekly bar. The weekly candle from the week of April 7, 2025 serves as this anchor. Following the inside bar, we observed a bearish pin bar, which acts as a Bullish Reacher since its wick exceeded the high of the anchor bar's wick (Wick on Wick). The market shows signs of wanting to rise, but it must first hit a demand zone that weekly traders are keen to engage with.
Volume Price Analysis: The last four weekly candles have demonstrated limited strength in driving the market lower, with support holding at 1.11927 (1.12). As the price declines, trading volume is decreasing, following a sharp upward movement, likely due to profit-taking or repositioning. Volume analysis indicated we should retest 1.15734.
Good luck and happy trading!
OANDA:EURUSD TVC:DXY
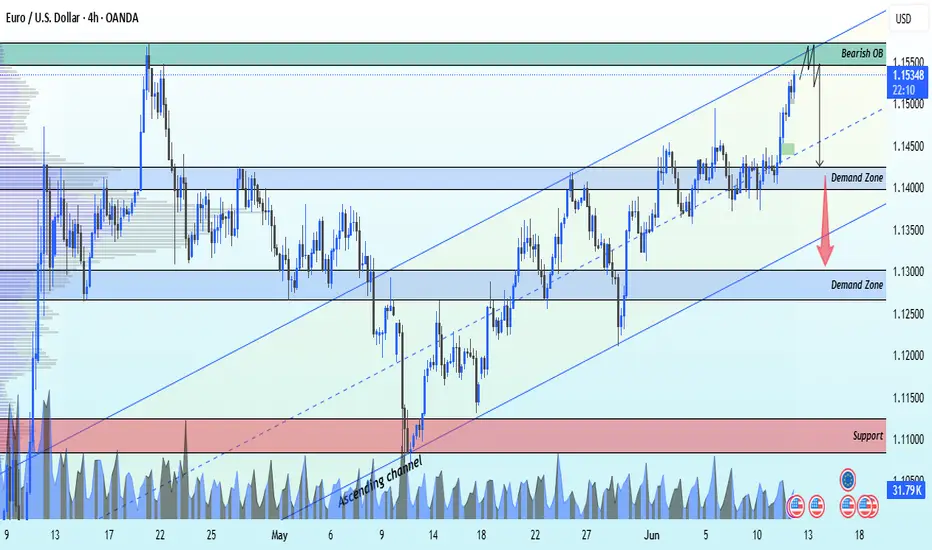
EURUSD follow the ascending channel selling now from bearish obEURUSD – Bearish Setup in Play! 🚨
4H Timeframe Analysis
EURUSD has been respecting the ascending channel, but price just tapped a key supply zone at 1.15700 and showed strong rejection. This signals a potential sell-off from current levels. 📉
🔻 Technical Targets:
📍 1st TP: 1.14200
📍 2nd TP: 1.12700
📍 3rd TP: 1.10800
A clean break below 1.15000 could accelerate the move. Watch closely for momentum confirmations! ⚠️
🧠 Smart traders plan, not chase.
💬 Drop your thoughts below
❤️ Like if you caught the move
🔔 Follow & Join us for real-time updates and setups!
— Livia 😜✨
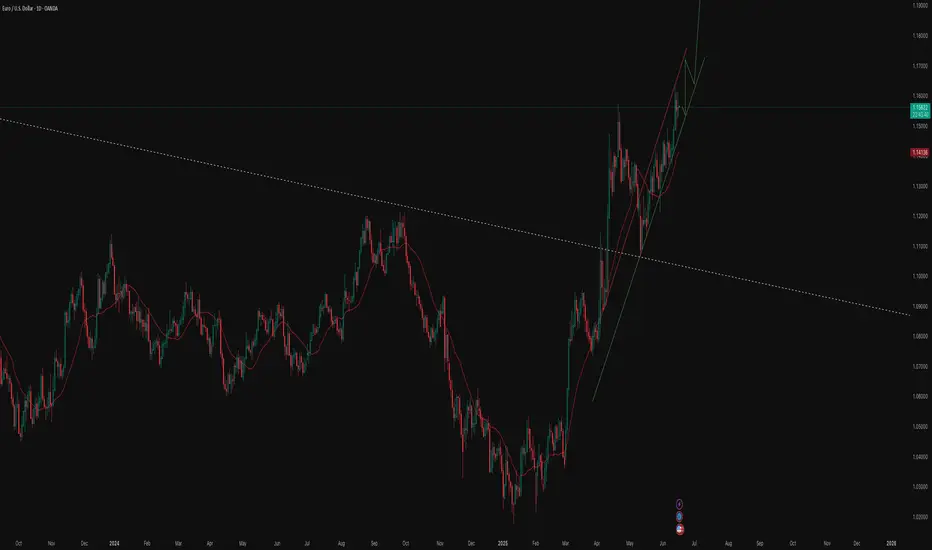
Path Toward 1.20 Still in Play but there's a catch....The pair has recently completed a major technical breakout by moving above a long standing trendline that dates back to the 2008 high. For more than 15 yearsthis trendline acted as strong resistance, repeatedly rejecting bullish attempts. The latest move did not just break through this resistance. It returned to retest the level around the 1.1450 to 1.1500 area and held with near perfect precision. This successful retest signaled a structural shift, turning former resistance into solid support. Since then, the pair has remained within a steep upward channel, forming higher lows and maintaining strong upside momentum. This momentum appears to be backed by real macro flows rather than just short-term speculation.
The euro’s recent strength is not being driven by strong economic performance in the Eurozone. Instead, it reflects a broader shift in global capital allocation and diverging monetary policy expectations. The Federal Reserve began easing policy in late 2024 with a series of rate cuts aimed at responding to softening inflation and slowing labor market conditions. By early 2025, the Fed had completed a handful of cuts before entering a pause. That pause remains in effect for now but markets are increasingly expecting the Fed to resume cutting later this year, with 2 to 3 additional cuts projected for the second half of 2025. These expectations have weakened the dollar as traders anticipate a return to more accommodative policy. (This is known as pricing in or speculative markets)
On the European side, the European Central Bank began cutting rates in late 2024 (Duh we all know this by now) and is now widely seen as operating in neutral territory. The ECB has taken a careful and measured approach to easing, avoiding any aggressive dovish turn and instead emphasizing a data dependent path. With limited room to cut further and no urgent economic pressure to do so, the euro has maintained a relative yield advantage compared to the dollar, even in a context of muted growth.
Another important driver of euro strength has been the rotation of capital into U.S. equities, particularly in the technology and large cap sectors. As investors allocate more capital into risk assets, the dollar tends to weaken in FX terms, as funding shifts out of USD and into growth exposures (aka emerging markets) This type of flow indirectly benefits the euro. At the same time the dollar is no longer acting as a dominant safe haven for now. Despite the presence of global uncertainty, low market volatility and return focused positioning have reduced the appeal of defensive USD flows. This has allowed the euro to benefit from repositioning, not because of its own economic strength, but because the dollar is no longer absorbing global liquidity the way it once did.
From a technical standpoint, the breakout above the 2008 trendline marks a significant structural change. As long as the 1.1500 area holds as support, the trend remains intact. The next major upside target is around 1.20, which aligns with the top of the rising price channel and represents a likely area for medium term profit taking by larger market participants.
However , risks to the upside scenario remain. Because this rally is being driven by capital flows and positioning rather than Eurozone fundamentals, it is highly sensitive to shifts in sentiment and data. A stronger than expected U.S economic report, such as an upside surprise in CPI, employment or consumer spending, could quickly change the market’s view on the Fed’s rate path and trigger a resurgence in dollar strength. Similarly, any signal from the ECB that suggests renewed dovishness or further deterioration in European economic data, could weigh heavily on the euro. In addition, if a geopolitical shock or a sharp decline in risk appetite occurs, safe haven flows could return to the dollar and result in a fast reversal in EUR/USD. We saw a warning of this past weekend with Israel and Iran attacking each other.
all in all, the euro has made a technically sound and macro supported breakout, driven by diverging rate cycles, capital rotation and the evolving role of the U.S dollar in global flows. The move toward 1.20 remains a valid target as long as 1.1500 holds as support. But this is not a fundamentally bullish euro story. It is a positioning driven move based on relative rate expectations and macro sentiment. If those expectations shift, the rally could unwind quickly. Active risk management remains essential. I hope this helps you all, Cheers!
Chart
White dashed line - 2008 Resistance
Red and Blue Ascending channel (Bullish on Daily)
Red is 1.19-1.20 AOI TP
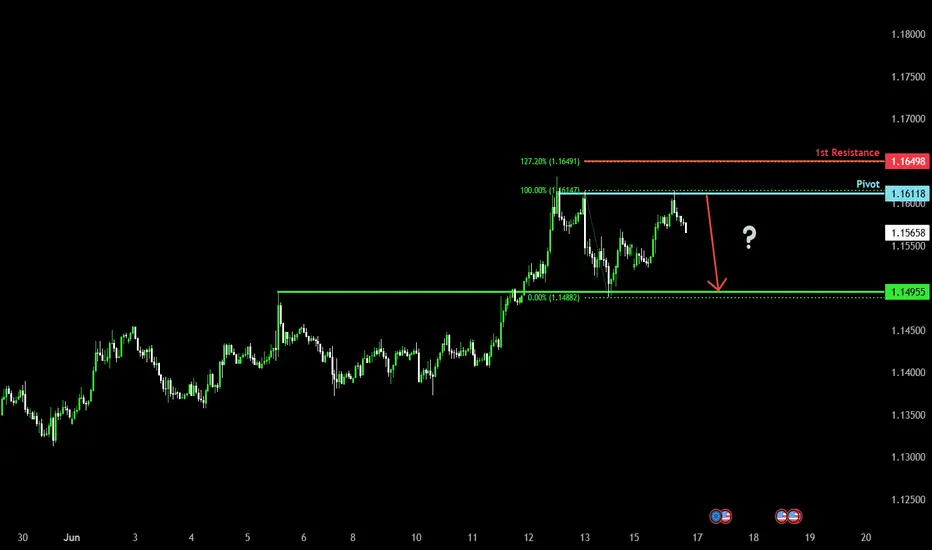
Bearish drop?The Fiber (EUR/USD) has rejected off the pivot and could drop to the 1st support.
Pivot: 1.1611
1st Support: 1.1495
1st Resistance: 1.1649
Risk Warning:
Trading Forex and CFDs carries a high level of risk to your capital and you should only trade with money you can afford to lose. Trading Forex and CFDs may not be suitable for all investors, so please ensure that you fully understand the risks involved and seek independent advice if necessary.
Disclaimer:
The above opinions given constitute general market commentary, and do not constitute the opinion or advice of IC Markets or any form of personal or investment advice.
Any opinions, news, research, analyses, prices, other information, or links to third-party sites contained on this website are provided on an "as-is" basis, are intended only to be informative, is not an advice nor a recommendation, nor research, or a record of our trading prices, or an offer of, or solicitation for a transaction in any financial instrument and thus should not be treated as such. The information provided does not involve any specific investment objectives, financial situation and needs of any specific person who may receive it. Please be aware, that past performance is not a reliable indicator of future performance and/or results. Past Performance or Forward-looking scenarios based upon the reasonable beliefs of the third-party provider are not a guarantee of future performance. Actual results may differ materially from those anticipated in forward-looking or past performance statements. IC Markets makes no representation or warranty and assumes no liability as to the accuracy or completeness of the information provided, nor any loss arising from any investment based on a recommendation, forecast or any information supplied by any third-party.
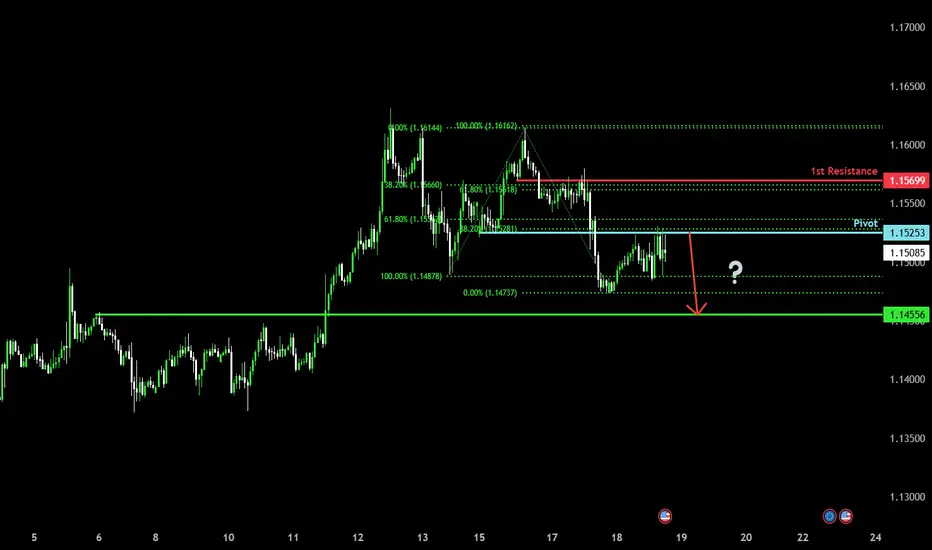
Potential bullish rise?The Fiber (EUR/USD) is reacting off the pivot and could drop to the 1st support.
Pivot: 1.1525
1st Support: 1.1455
1st Resistance: 1.1569
Risk Warning:
Trading Forex and CFDs carries a high level of risk to your capital and you should only trade with money you can afford to lose. Trading Forex and CFDs may not be suitable for all investors, so please ensure that you fully understand the risks involved and seek independent advice if necessary.
Disclaimer:
The above opinions given constitute general market commentary, and do not constitute the opinion or advice of IC Markets or any form of personal or investment advice.
Any opinions, news, research, analyses, prices, other information, or links to third-party sites contained on this website are provided on an "as-is" basis, are intended only to be informative, is not an advice nor a recommendation, nor research, or a record of our trading prices, or an offer of, or solicitation for a transaction in any financial instrument and thus should not be treated as such. The information provided does not involve any specific investment objectives, financial situation and needs of any specific person who may receive it. Please be aware, that past performance is not a reliable indicator of future performance and/or results. Past Performance or Forward-looking scenarios based upon the reasonable beliefs of the third-party provider are not a guarantee of future performance. Actual results may differ materially from those anticipated in forward-looking or past performance statements. IC Markets makes no representation or warranty and assumes no liability as to the accuracy or completeness of the information provided, nor any loss arising from any investment based on a recommendation, forecast or any information supplied by any third-party.