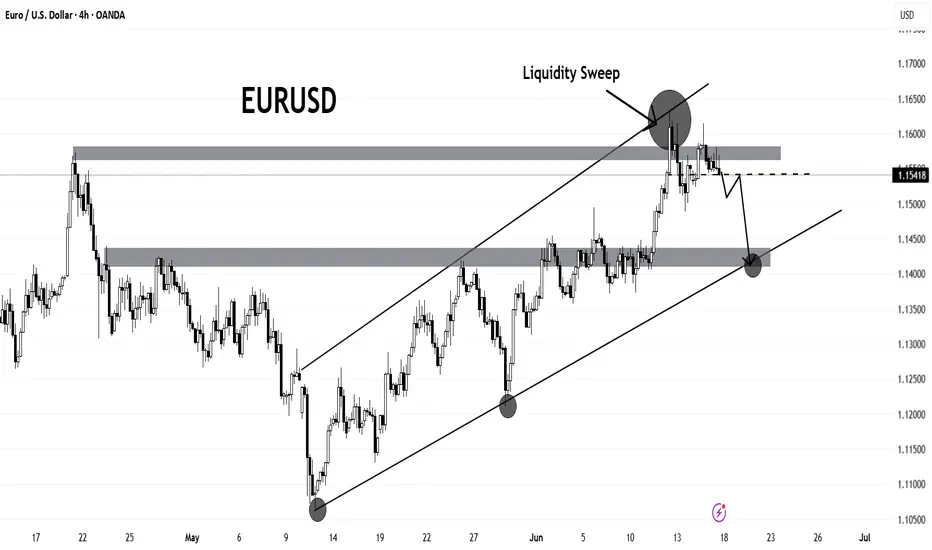
EURUSDEUR/USD recently swept liquidity from the daily resistance zone near 1.1580, trapping buyers above the key psychological level of 1.1600. However, price action has shown a clear rejection from the supply area, indicating strong selling pressure.
USDEUX trade ideas
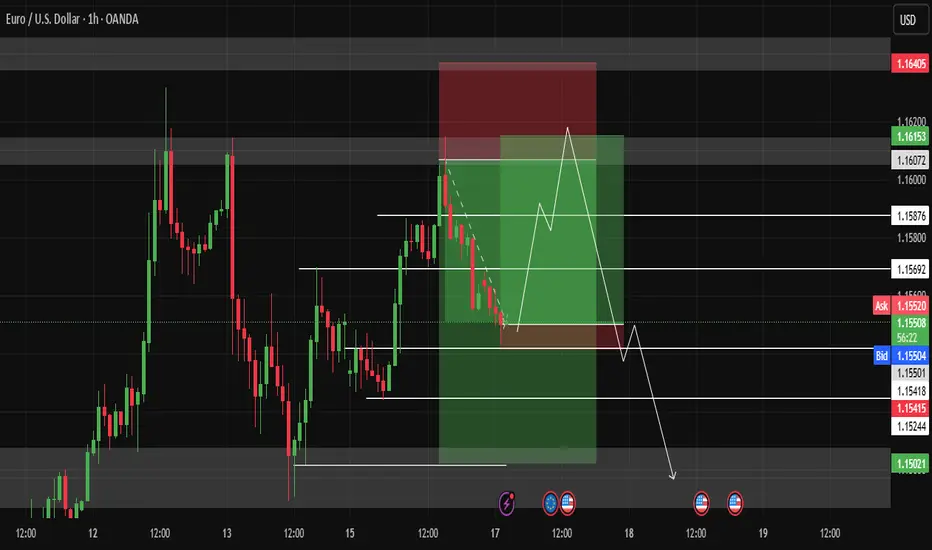
Opportunity for buying and selling EURUSDI see that EURUSD has confirmed strong support and resistance, so I took a sell and buy trade with it.
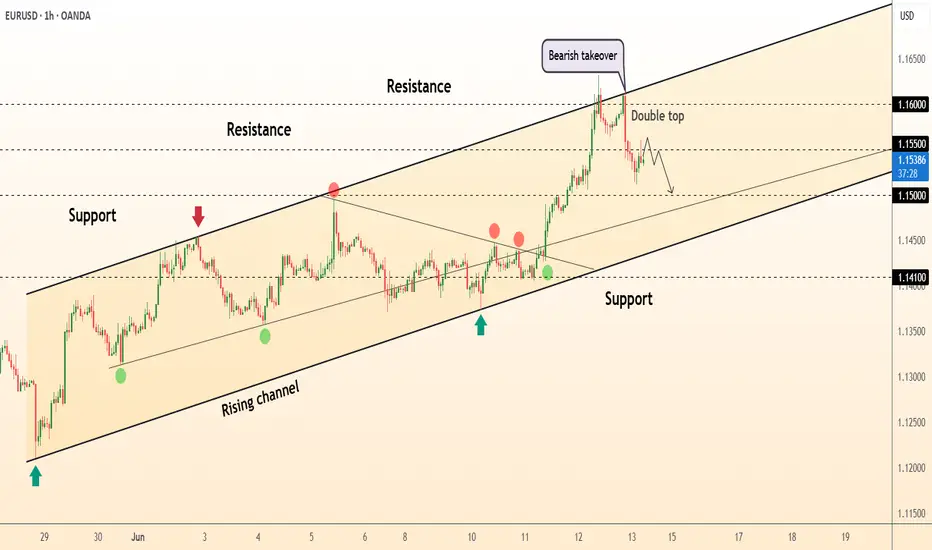
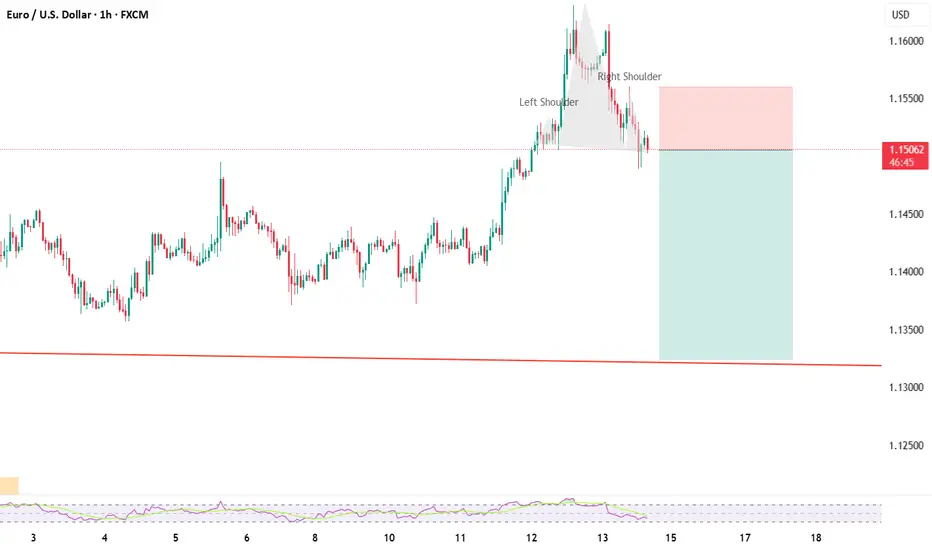
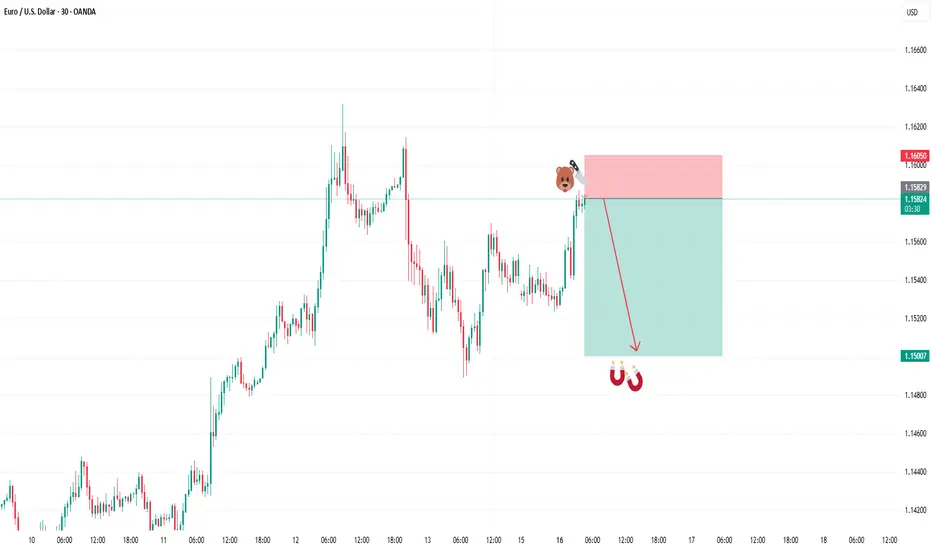
DeGRAM | EURUSD formed the double top📊 Technical Analysis
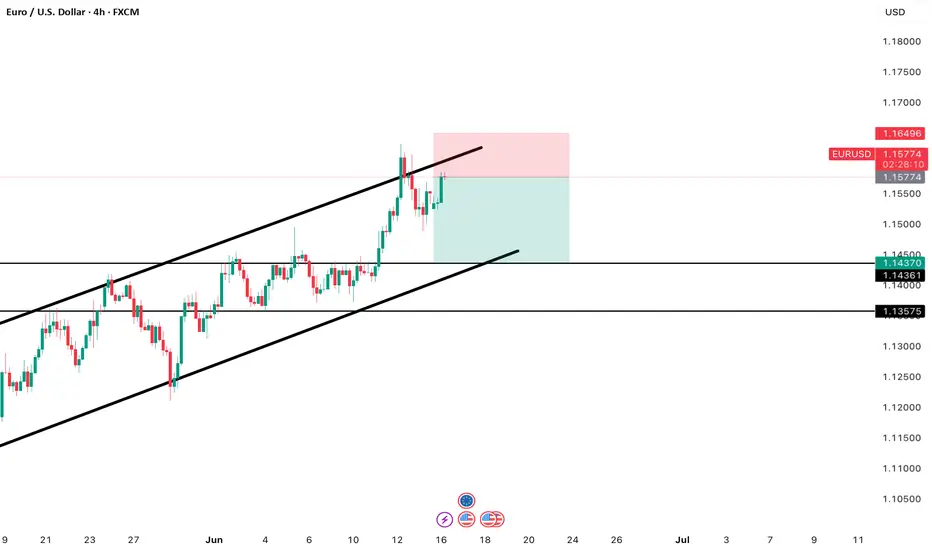
● A double-top printed at the channel roof (≈ 1.1600) and a bearish engulfing candle signal exhaustion; price is slipping back inside last week’s inner trend-median, turning 1.1550 into fresh resistance.
● Hourly RSI diverged lower and the grey return line from 1 June has broken; pattern depth points to 1.1500 support, with the channel mid-band / former triangle apex near 1.1470 as the next magnet.
💡 Fundamental Analysis
● Post-CPI profit-taking meets cautious ECB rhetoric: Lagarde reiterated “no preset easing path,” yet money-markets still price two Fed cuts by year-end, inviting near-term dollar reprieve.
✨ Summary
Short 1.1540-1.1560; break below 1.1520 targets 1.1500 → 1.1470. Bear view void on an H1 close above 1.1600.
-------------------
Share your opinion in the comments and support the idea with like. Thanks for your support!
EURUSD SELL OPPORTUNITY I see a sell opportunity now
Entry: 1.15600
Sl: 1.15750
TP: 1.15000
Comment your opinion pls
Like to support me with funds. Connect with me on X @shajudeakinoba1
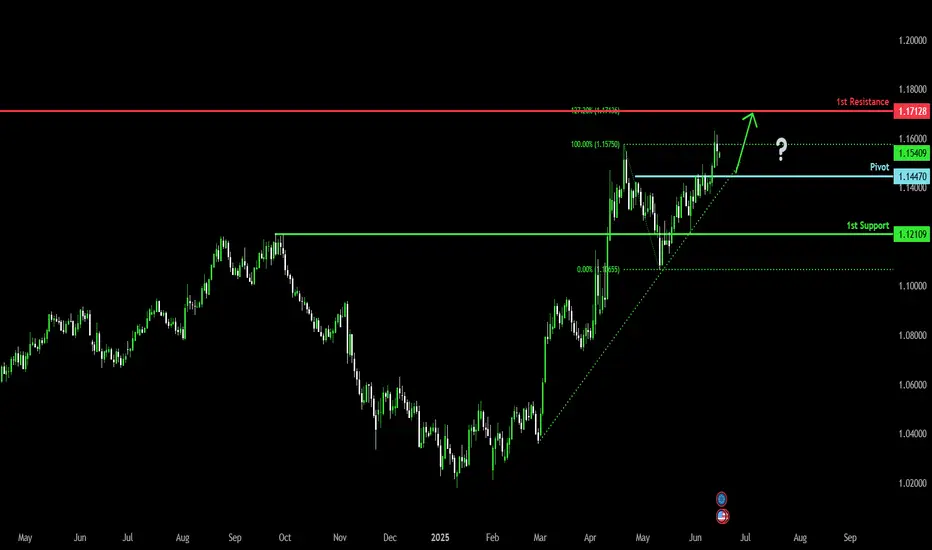
Bullish continuation?The Fiber (EUR/USD) is falling towards the pivot which acts as a pullback support and could bounce to the 1st resistance that lines up with the 127.2% Fibonacci resistance.
Pivot: 1.1447
1st Support: 1.1210
1st Resistance: 1.1712
Risk Warning:
Trading Forex and CFDs carries a high level of risk to your capital and you should only trade with money you can afford to lose. Trading Forex and CFDs may not be suitable for all investors, so please ensure that you fully understand the risks involved and seek independent advice if necessary.
Disclaimer:
The above opinions given constitute general market commentary, and do not constitute the opinion or advice of IC Markets or any form of personal or investment advice.
Any opinions, news, research, analyses, prices, other information, or links to third-party sites contained on this website are provided on an "as-is" basis, are intended only to be informative, is not an advice nor a recommendation, nor research, or a record of our trading prices, or an offer of, or solicitation for a transaction in any financial instrument and thus should not be treated as such. The information provided does not involve any specific investment objectives, financial situation and needs of any specific person who may receive it. Please be aware, that past performance is not a reliable indicator of future performance and/or results. Past Performance or Forward-looking scenarios based upon the reasonable beliefs of the third-party provider are not a guarantee of future performance. Actual results may differ materially from those anticipated in forward-looking or past performance statements. IC Markets makes no representation or warranty and assumes no liability as to the accuracy or completeness of the information provided, nor any loss arising from any investment based on a recommendation, forecast or any information supplied by any third-party.
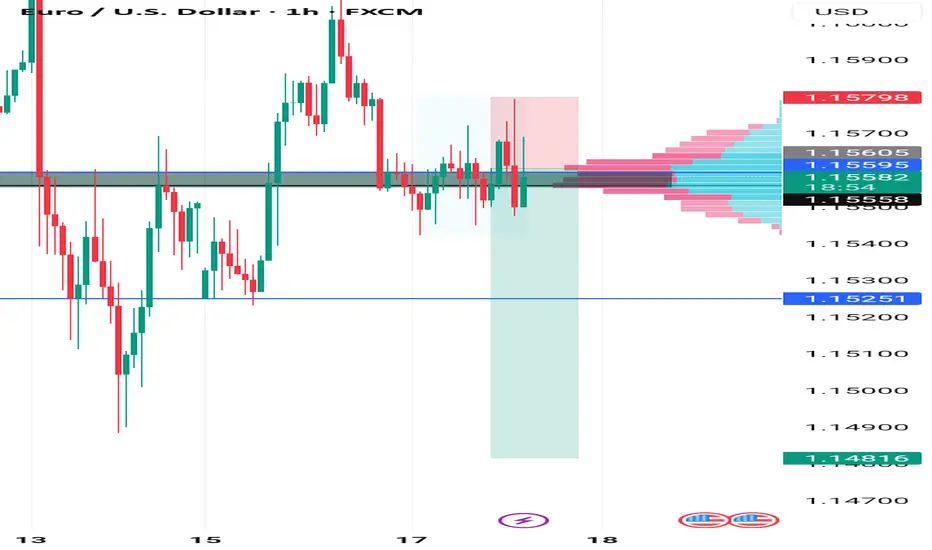
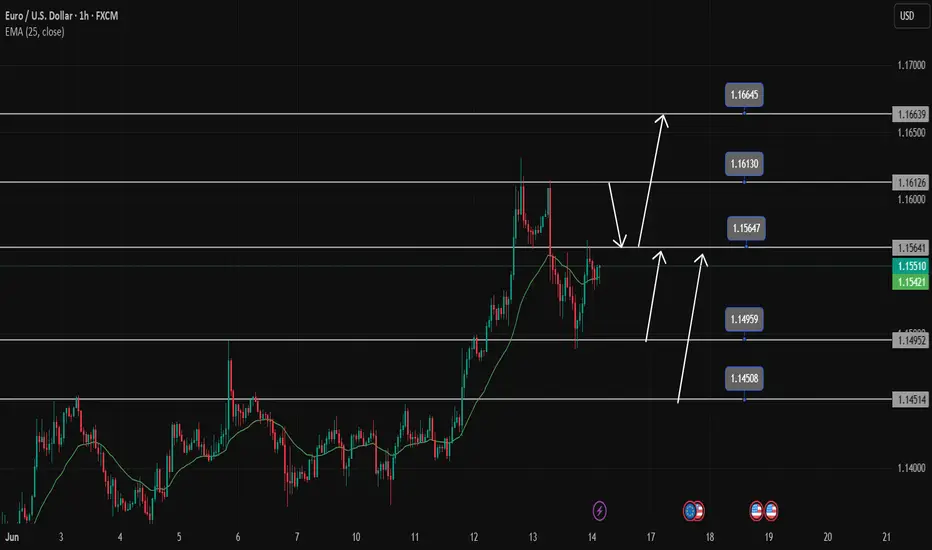
EURUSD is continuing its uptrendEURUSD is still in a strong uptrend. There was a drop in the Asian and European sessions on Friday but that was not enough to reverse the pair. The end of the US session saw the price being pushed up by the bulls from the 1.155 price zone and is stuck in this resistance zone.
The price continues to increase when breaking 1.155 will head towards the resistance of 1.161, the highest peak of last week. If there is a retest of 1.155, the price will head towards 1.166 next week to be able to use short-term SELL strategies
The BUY strategy is still prioritized as the EU is still in an uptrend. The main BUY zone of the pair is still waiting for 1.150 and lower is the breakout zone of 1.145
Resistance: 1.161, 1.166
Support: 1.150, 1.145
EUR/USD – Bearish Setup Activated
Price rejected key resistance and broke below the trendline, confirming a sell bias. Entered short after confirmation candle.
Targeting next support zone with strong RR.
Structure: Lower Highs & Lower Lows
Tools Used: Elliott Wave, SMC, Parallel Channel
Timeframe: ., 30m]
#ForexTrading #EURUSD #SmartMoney #PriceAction #SellSetup #TradingViewAnalysis"

eur/usdTRADE 5 long term i belive we are still bearish but long term retracement has been in order and is still going but it has hit a key resistance level that i dont belive it to break if it does break it we will look for it to hit the surport line and then use it as a entry, as fgor now though a engulfing candle pattern happend and i do belive us to go in the bearish movment back down lets see where it takes us

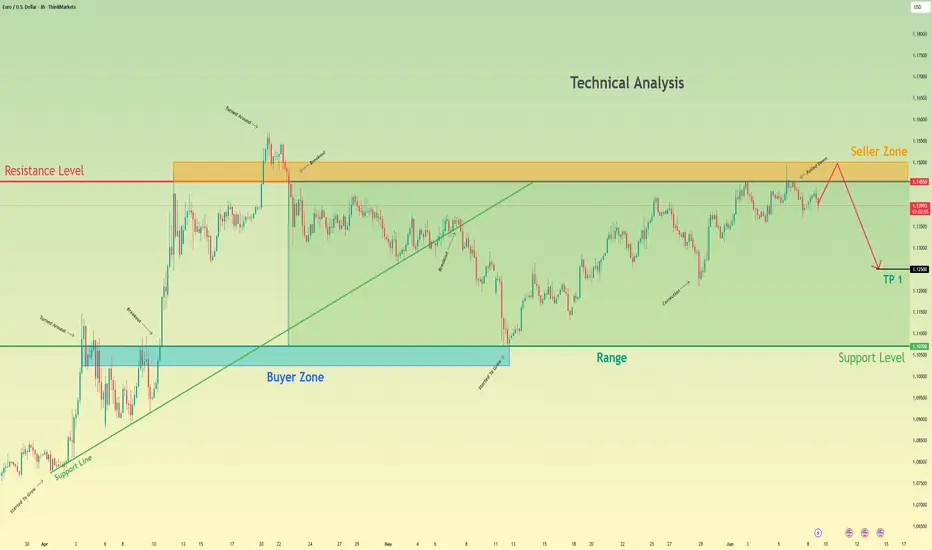
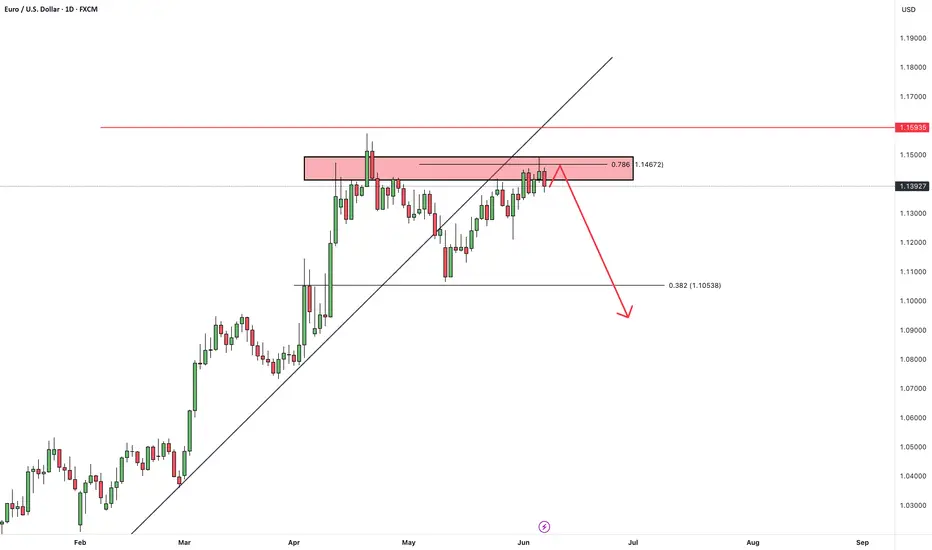
Euro may reach seller zone and then continue to declineHello traders, I want share with you my opinion about Euro. In this chart, the price started to grow, bouncing from the support line, and soon reached the support level, which coincided with the buyer zone. Then it declined to support line, making the correction and then made an impulse up from this line to the resistance level, breaking the 1.1070 level. After this movement, the Euro made a correction and then continued to grow and broke the resistance level, which coincided with the seller zone, and even rose higher than the seller zone. But soon Euro turned around and started to decline and broke the 1.1455 level again, after which it declined to the support line inside the range. Price little grew near this line, but later broke the support line and continued to decline. It fell to the support level, which is the bottom part of the range, and then started to grow. Euro later reached the top part of the range, which is the resistance level, and not long time ago turned around and started to decline. So, after looking for this chart, I think that the Euro may enter to seller zone and then continue to decline inside the range. For this case, I set my TP at 1.1250 points. Please share this idea with your friends and click Boost 🚀
Disclaimer: As part of ThinkMarkets’ Influencer Program, I am sponsored to share and publish their charts in my analysis.
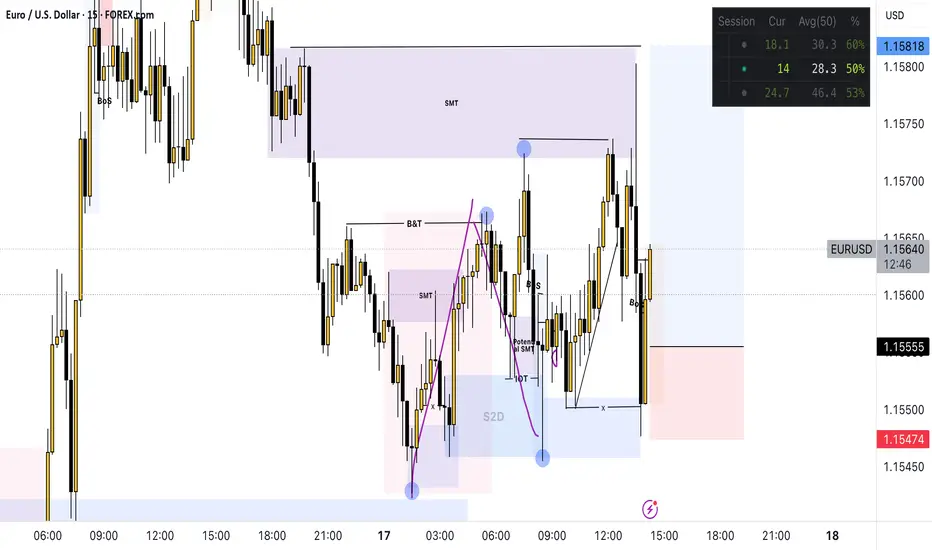
SELL EURUSDIn todays session we are monitoring EURUSD for selling opportunity. Our entry is at 1.15814 and stops are above 1.16050. Our target is 1.15000. Use proper risk management and stay safe fam.
EURUSDHello Traders! 👋
What are your thoughts on EURUSD?
EURUSD remains below a key resistance zone, and at this stage, it does not appear to have enough momentum to break through.
We are watching for potential sell setups around this area.
As long as there is no daily candle close above the resistance, we expect a pullback toward the specified support level.
If a daily candle closes above the resistance zone, the bearish scenario will be invalidated, and the structure may shift.
Don’t forget to like and share your thoughts in the comments! ❤️
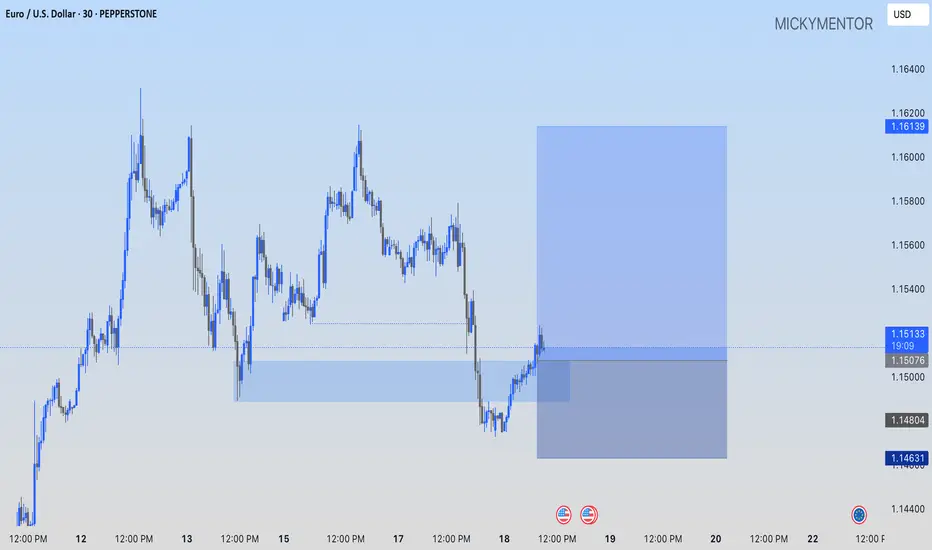
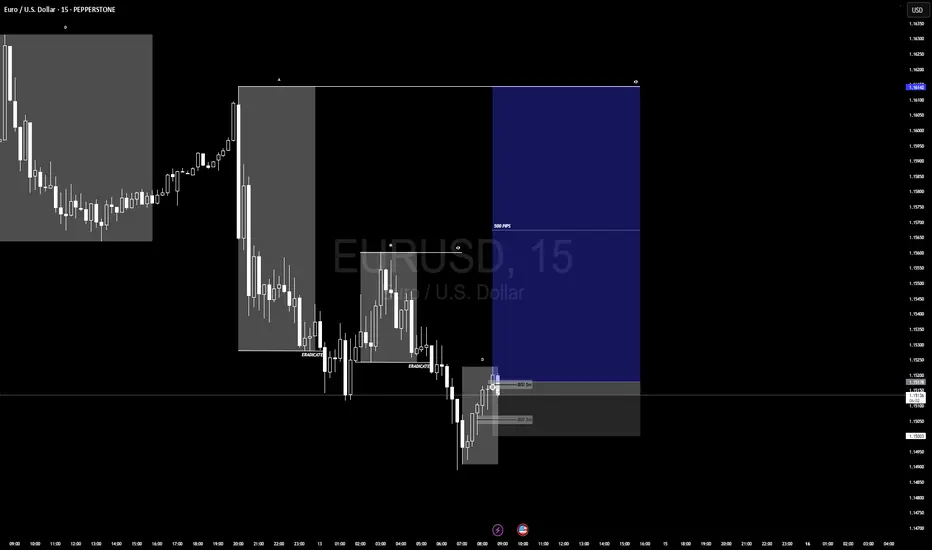
EURUSD: AN OPPORTUNITY TO BUY!! PEPPERSTONE:EURUSD I'm buying at current market price, I'll target the 1.16147 as my profit target.
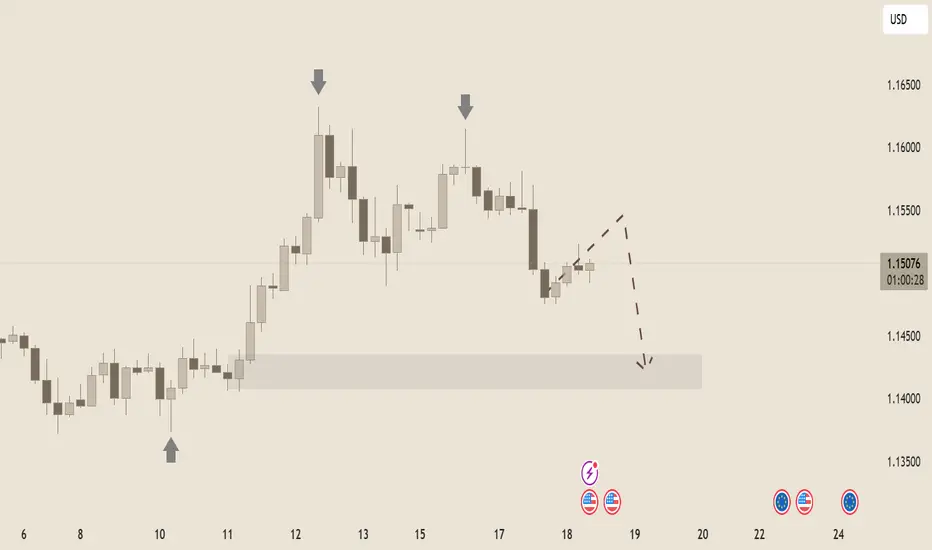
EUR/USD – Technical Price Forecast🔍 EUR/USD – Technical Price Forecast
As of June 18, 2025
Current Price: 1.15040
Bias: Bearish (Short-term)
Timeframe Context: Likely 4H or Daily
🧩 Market Structure Breakdown
🔺 Trend Context
Primary Trend (recent weeks): Bullish impulse from early June
Current Phase: Retracement / potential reversal
⬇️ Recent Price Action
Lower highs forming (arrows mark swing failure at ~1.1650 and ~1.1600).
Price has broken market structure to the downside around 1.1550 with a strong bearish candle.
Current retracement is weak and corrective, lacking momentum.
📐 Key Technical Levels
Level Type Observation
1.1650 Resistance Swing high / aggressive rejection
1.1600 Resistance Lower high + supply zone
1.1550 Supply zone Breakdown area
1.1500 Current zone Minor consolidation
1.1450–1.1400 Demand zone Prior accumulation zone (support)
1.1350 Next support Clean inefficiency below
📉 Liquidity & Order Flow Insight
Sell-side liquidity likely rests below 1.1400.
The recent bullish pullback appears to be a liquidity grab, not a reversal.
Imbalance created by recent bearish move remains unfilled.
📊 Candlestick Behavior
Strong bearish engulfing candle on the move from 1.1550 to 1.1480 indicates supply absorption.
Current candles are corrective and small-bodied — suggesting weak buying and potential continuation down.
🔮 Price Prediction / Forecast
Time Horizon Forecast Summary
Short-term (1–3 days) Expect minor bullish retracement to 1.1530–1.1550, followed by rejection.
Medium-term (3–7 days) Breakdown toward 1.1450, targeting liquidity below support zone.
Extended scenario If 1.1400 breaks cleanly, expect a drop toward 1.1350 and possibly 1.1300 as next support.
📌 Invalidation Level: A daily close above 1.1600 would invalidate this bearish scenario and imply further upside potential.
🧠 Strategy Implications (Pro Traders)
Sell the rally into 1.1530–1.1550 supply with stops above 1.1600.
Take profit levels:
TP1: 1.1450
TP2: 1.1400
TP3 (extension): 1.1350
Risk Management:
Risk-to-reward ratio ≥ 2:1. Confirm entry with bearish price action on lower timeframes (e.g., 1H).
⚠️ Macro Consideration
Multiple economic events approaching (U.S. and EU flags shown) — expect volatility. Hold trades cautiously around high-impact news.
EURUSD LONG SCAPLE5 Minutes timeframe
Entry:1.15182
Stoploss:1.15006
Takeprofit:1.16148
Entry model we identified a 5 minutes BISI and market is currently in the distribution phase we anticipate a reversal to the accumilation phase not financial advice but i risked 0.50% on this trade as im waiting for NQ! to present
EURUSD Sell- Go for sell if setup given
- just a small trade
- Refine entry with smaller SL for better RR, if your strategy allow
A Message To Traders:
I’ll be sharing high-quality trade setups for a period time. No bullshit, no fluff, no complicated nonsense — just real, actionable forecast the algorithm is executing. If you’re struggling with trading and desperate for better results, follow my posts closely.
Check out my previously posted setups and forecasts — you’ll be amazed by the high accuracy of the results.
"I Found the Code. I Trust the Algo. Believe Me, That’s It."
EU buysI'm going for buys now on EU TARGETING 1.15818. Im bullish from an intraday perspective due to the liquidity resting to the upside and the overall trend.
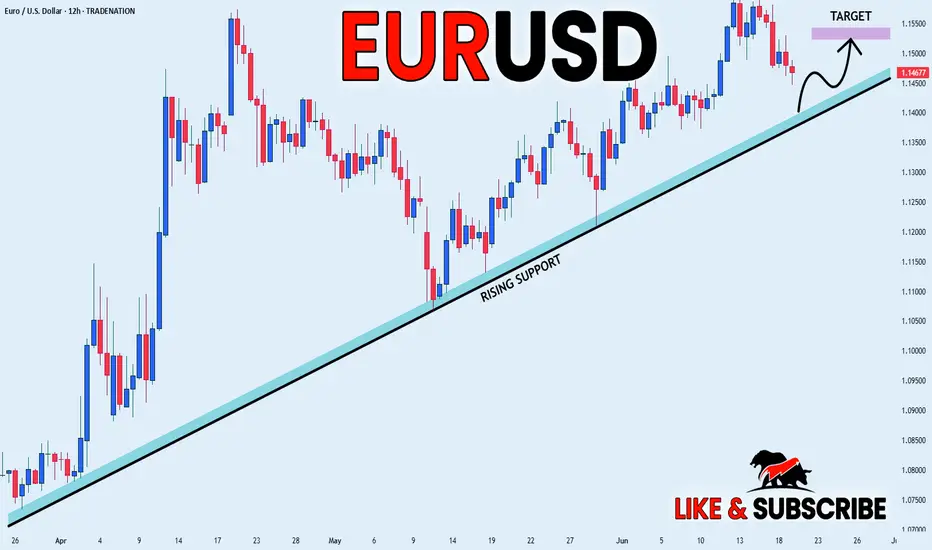
EUR_USD BULLISH BIAS|LONG|
✅EUR_USD is trading in an uptrend
With the pair set to retest
The rising support line
From where I think the growth will continue
LONG🚀
✅Like and subscribe to never miss a new idea!✅
Disclosure: I am part of Trade Nation's Influencer program and receive a monthly fee for using their TradingView charts in my analysis.
Important Week for EURUSDOn Friday, EURUSD reached a support level and bounced off it.
This week, the market is waiting for the Fed’s decision on interest rates.
The trend remains bullish for now, and the upcoming news will likely determine the next major move.
Today and tomorrow, we might see some sideways movement ahead of the key announcement.
Don't rush into new trades and avoid using large position sizes!

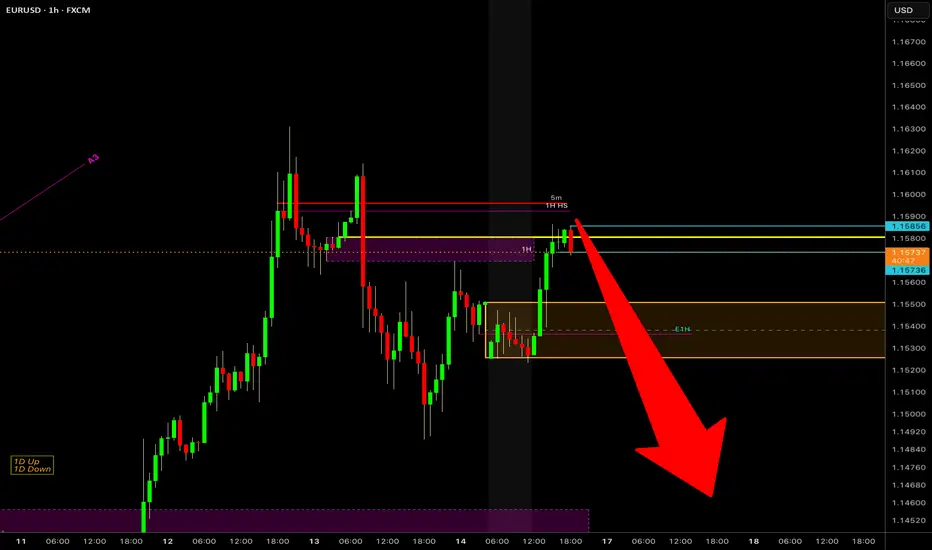
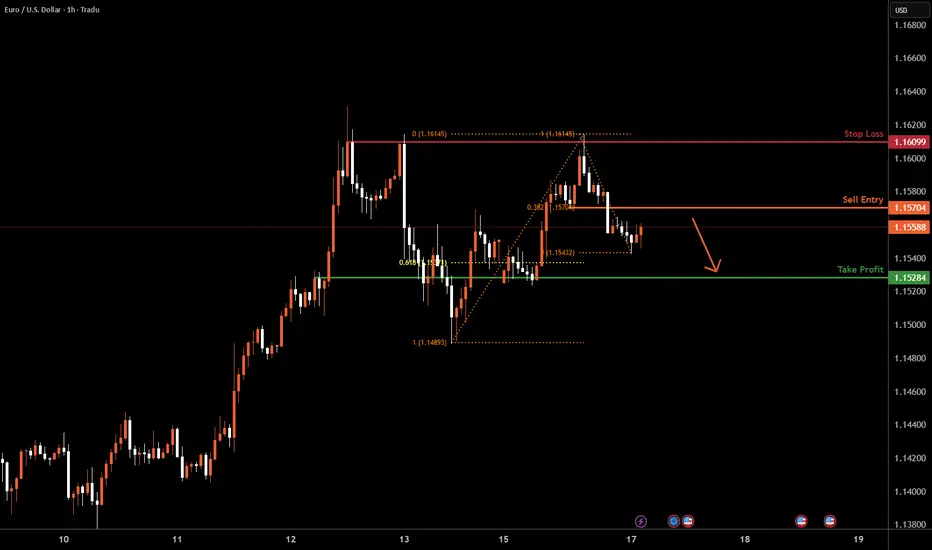
EURUSD H1 I Bearish Reversal Based on the H1 chart analysis, we can see that the price is rising toward our sell entry at 1.1570, which is a pullback resistance aligning with a 38.2% Fib retracement.
Our take profit will be at 1.1528, an overlap support level.
The stop loss will be placed at 1.1609, a multi-swing high resistance.
High Risk Investment Warning
Trading Forex/CFDs on margin carries a high level of risk and may not be suitable for all investors. Leverage can work against you.
Stratos Markets Limited (tradu.com ):
CFDs are complex instruments and come with a high risk of losing money rapidly due to leverage. 63% of retail investor accounts lose money when trading CFDs with this provider. You should consider whether you understand how CFDs work and whether you can afford to take the high risk of losing your money.
Stratos Europe Ltd (tradu.com ):
CFDs are complex instruments and come with a high risk of losing money rapidly due to leverage. 63% of retail investor accounts lose money when trading CFDs with this provider. You should consider whether you understand how CFDs work and whether you can afford to take the high risk of losing your money.
Stratos Global LLC (tradu.com ):
Losses can exceed deposits.
Please be advised that the information presented on TradingView is provided to Tradu (‘Company’, ‘we’) by a third-party provider (‘TFA Global Pte Ltd’). Please be reminded that you are solely responsible for the trading decisions on your account. There is a very high degree of risk involved in trading. Any information and/or content is intended entirely for research, educational and informational purposes only and does not constitute investment or consultation advice or investment strategy. The information is not tailored to the investment needs of any specific person and therefore does not involve a consideration of any of the investment objectives, financial situation or needs of any viewer that may receive it. Kindly also note that past performance is not a reliable indicator of future results. Actual results may differ materially from those anticipated in forward-looking or past performance statements. We assume no liability as to the accuracy or completeness of any of the information and/or content provided herein and the Company cannot be held responsible for any omission, mistake nor for any loss or damage including without limitation to any loss of profit which may arise from reliance on any information supplied by TFA Global Pte Ltd.
The speaker(s) is neither an employee, agent nor representative of Tradu and is therefore acting independently. The opinions given are their own, constitute general market commentary, and do not constitute the opinion or advice of Tradu or any form of personal or investment advice. Tradu neither endorses nor guarantees offerings of third-party speakers, nor is Tradu responsible for the content, veracity or opinions of third-party speakers, presenters or participants.
DeGRAM | EURUSD double bottom📊 Technical Analysis
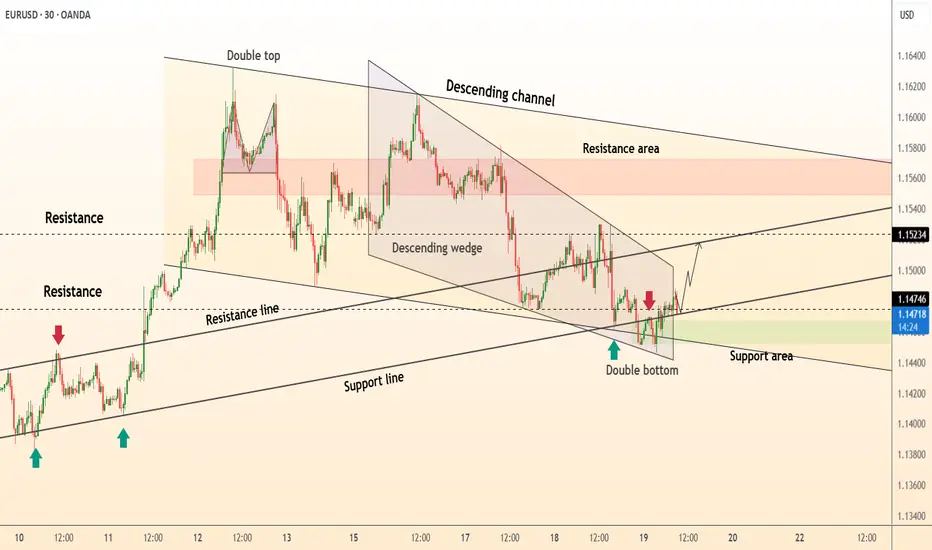
● The price is currently testing the upper resistance of a descending wedge pattern after forming a clear double bottom formation. This double bottom occurred precisely at a confluence of support, where the long-term ascending support line intersects with the lower boundary of the wedge, indicating a strong potential for a bullish reversal from the 1.1450-1.1470 area.
● This recent bullish price action follows a prior "double top" pattern that initiated the corrective move downwards into the current wedge. A decisive breakout and hold above the wedge's resistance would invalidate the recent bearish pressure and confirm that buyers are taking control, with the first significant target being the horizontal resistance line near 1.1523.
💡 Fundamental Analysis
● Market attention is centered on the upcoming U.S. Federal Reserve policy meeting. While no rate change is expected, forward guidance is key. Current market sentiment, as noted by analysts at RoboForex and FreshForex, is pricing in the possibility of a Fed rate cut later this year, which could place downward pressure on the US Dollar.
● Conversely, the Euro is finding support from a comparatively hawkish European Central Bank (ECB). Recent reports indicate that the probability of an ECB rate cut has diminished, suggesting a policy divergence that favors EUR strength against the USD, underpinning the technical case for a move higher.
✨ Summary
Long entry on a confirmed 30-minute candle close above the descending wedge resistance (~1.1485); initial target 1.1523 → 1.1560. The bullish outlook is invalidated on a close below the double bottom support at 1.1450.
-------------------
Share your opinion in the comments and support the idea with a like. Thanks for your support
EUR/USD TrendlineEUR/USD broke below its ascending trendline and failed to reclaim resistance at 1.14876. The pair is now showing signs of bearish pressure as it trades below key resistance.
If selling pressure continues, the next supports to watch are 1.14616 and 1.14353.
A confirmed break above 1.15319 would invalidate this bearish outlook.
🔻 Resistance: 1.14876 – 1.15020
🔻 Support 1: 1.14616
🔻 Support 2: 1.14353
🔻 Stop Loss: 1.15319
🔻 Timeframe: 1H
🔻 Bias: Bearish, below 1.14876
This is a technical idea only – not financial advice.
