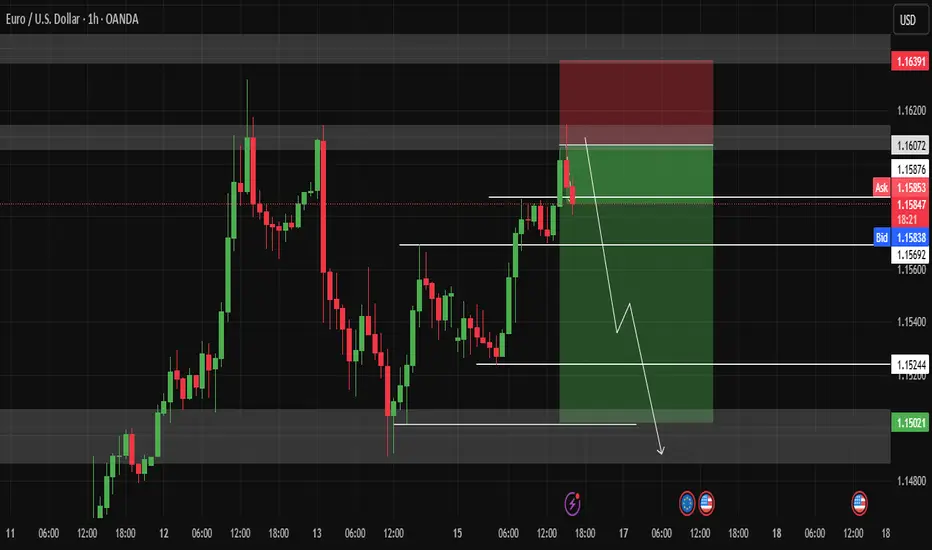
EUR/USD CRAZZYY BULLISH BIAS (SMC Perspective) | 1H Outlook🔍 Analysis Summary:
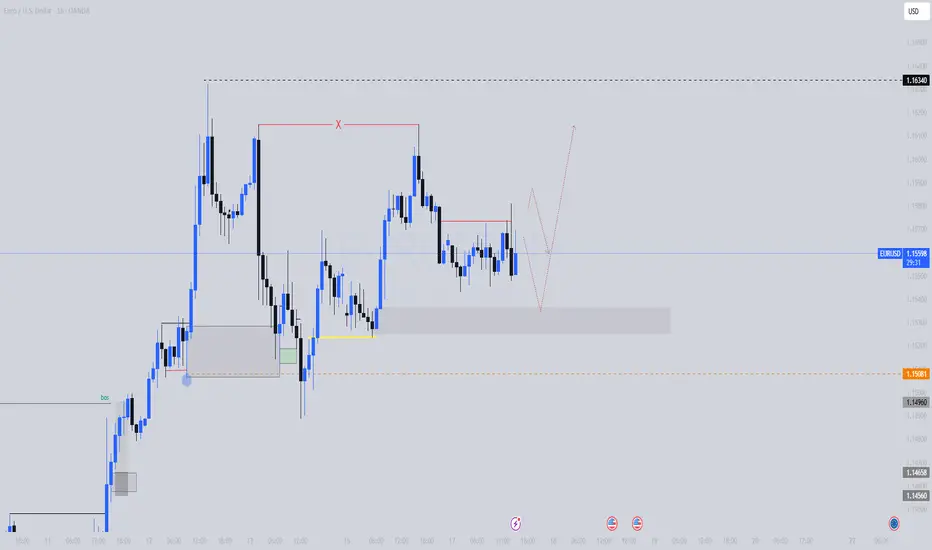
Price is consolidating above a clear demand zone after breaking previous structure to the upside.
We’ve seen liquidity engineered above the swing high (marked X), followed by internal structure developing.
I’m watching for a sweep into demand (grey zone) between 1.1520 – 1.1540, followed by a bullish reaction.
Expecting a bullish BOS (Break of Structure) on the lower timeframe to confirm continuation to 1.16340.
📌 Key Levels:
Demand Zone: 1.1520 – 1.1540
Liquidity Sweep: Above recent highs (1.1596)
Target Zone: 1.16340
Invalidation: Clean break below 1.1500
🗓️ Fundamental Drivers to Watch:
USD Weakness – Driven by:
Recent soft CPI & PPI data (cooling inflation)
Increased chances of Fed rate cuts (starting September 2025)
Risk-on market sentiment pushing money out of the USD
Upcoming News Events:
Wed 19 June – Fed Chair Powell Speaks 🗣️
→ Any dovish tone supports the bullish EUR/USD case
Thu 20 June – Initial Jobless Claims 📉
→ A higher-than-expected print could confirm labor market weakness = USD bearish
Fri 21 June – Flash Manufacturing/Services PMI (EUR & USD)
→ EUR strength + weak US data can fuel upside
🧠 My Plan:
Watch for a liquidity sweep into demand
Wait for bullish confirmation on M15 or M5
Target previous high & continuation toward 1.16340
💬 Follow for more SMC-based breakdowns. Let’s stay sharp and react, not predict.
#EURUSD #SMC #SmartMoney #LiquiditySweep #ForexTrading #OrderBlocks #sam_trades_smc #PriceAction #FOMC #Fed #USD
USDEUX trade ideas
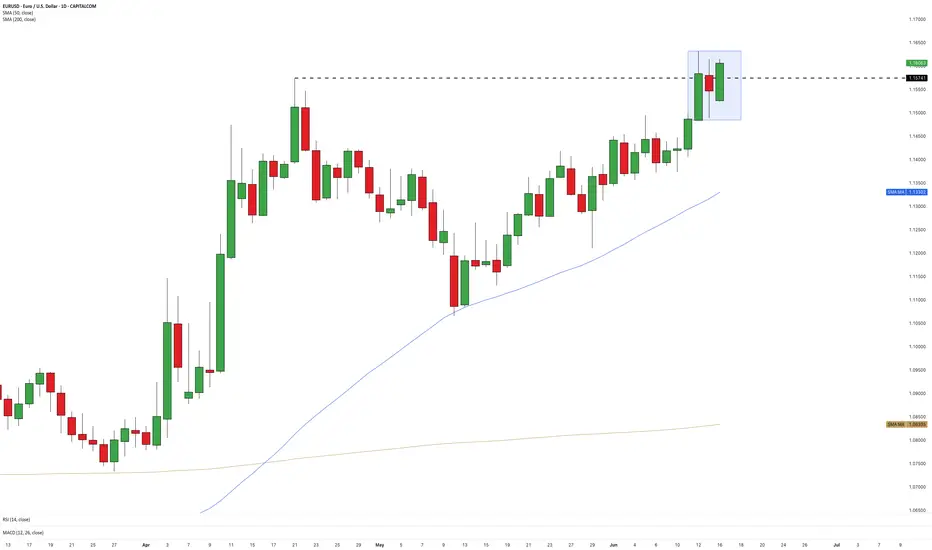
EUR/USD Forms Inside Day at Key ResistanceWith the greenback under pressure, we take a look at EUR/USD, which has just formed an inside day pattern at key resistance. As both macro headwinds and high-impact data loom, the next breakout or fakeout could set the tone for the week ahead.
Dollar under pressure ahead of high-stakes week
The dollar is reeling after Donald Trump reignited global trade tensions, pushing the currency to its weakest level in three years. His comments about reintroducing reciprocal tariffs within weeks have triggered a sharp decline in the greenback, which fell over 0.8% against a basket of major peers. Alongside this, geopolitical jitters over Iran and reports that the US may reassess its Aukus defence pact have further dampened sentiment, with traders increasingly questioning the strength of America’s international alliances.
The weakening in the dollar has been exacerbated by weaker-than-expected inflation, which has encouraged market participants to bet more heavily on interest rate cuts from the Fed later this year. Futures now price in two quarter-point cuts, undermining the dollar’s yield advantage. Meanwhile, the euro has found support from signs that the ECB may be nearing the end of its cutting cycle, adding relative strength to the single currency. All eyes now turn to Tuesday’s US industrial production figures, followed by EU inflation data and the Fed’s interest rate decision on Wednesday, as traders look for fresh direction.
Compression at resistance: All eyes on Thursday’s range
Last week’s rally saw EUR/USD push into a key level, with price retesting resistance created by the April highs. Although the pair briefly broke through on Thursday with a close above the level, Friday’s session was far more cautious. Price action stayed entirely within Thursday’s range, forming an inside day pattern that now acts as a pressure point for the next directional move.
This setup reflects a temporary standoff between bullish momentum and longer-term resistance. Inside days often precede breakouts, but they can also lure in traders only to reverse violently. The key now lies in how price reacts to the boundaries of Thursday’s range. A close above it, particularly on strong volume, would be a clear signal of continuation and likely invite further buying. A close below it on strong volume would mark a failed breakout and open the door to a short setup.
For those trading this setup, Thursday’s high and low now form essential levels. Not only do they serve as breakout triggers, but they also offer logical zones for stop placement. In short, the market is coiled, the fundamentals are volatile, and price is poised.
EUR/USD Daily Candle Chart
Past performance is not a reliable indicator of future results
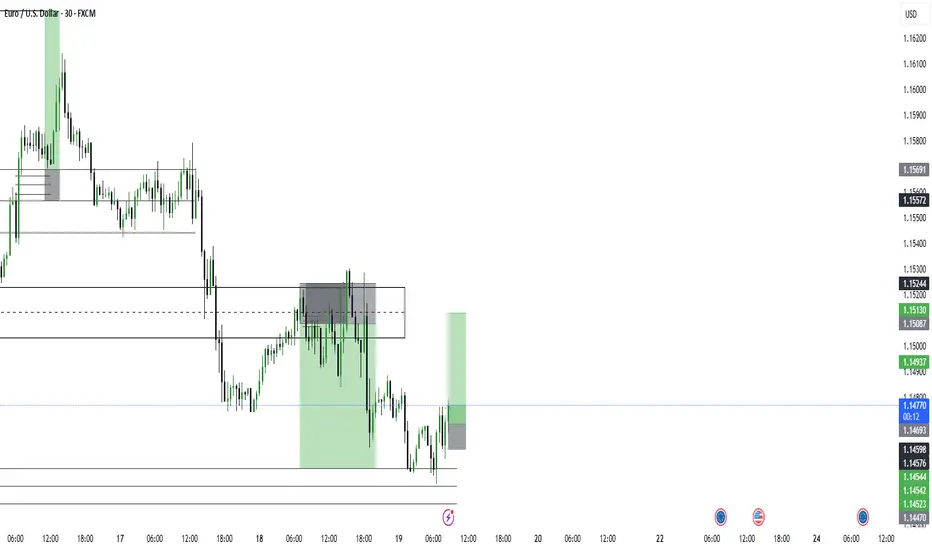
EUR/USD Hourly Candle Chart
Past performance is not a reliable indicator of future results
Disclaimer: This is for information and learning purposes only. The information provided does not constitute investment advice nor take into account the individual financial circumstances or objectives of any investor. Any information that may be provided relating to past performance is not a reliable indicator of future results or performance. Social media channels are not relevant for UK residents.
Spread bets and CFDs are complex instruments and come with a high risk of losing money rapidly due to leverage. 85.24% of retail investor accounts lose money when trading spread bets and CFDs with this provider. You should consider whether you understand how spread bets and CFDs work and whether you can afford to take the high risk of losing your money.
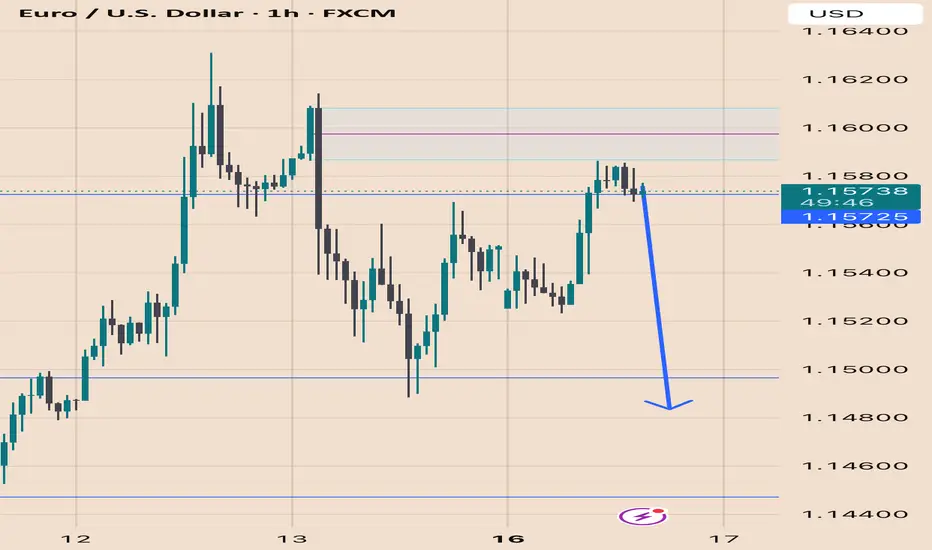
London Session - Sell Idea on EUWe see price entering a 4hr & 1hr engulfing candle stick. Price is also beginning to downtrend on the 1hr time frame. I've adjusted my trading time to early morning on the east coast. I'm noticing I'm more productive. My original wakeup time is 3:33am but I woke up at 4:44am this Am. I felt rushed to keep going but I'm not trying to hard, I will set alerts as price enters our zone, I'm expecting price to trigger before 7am. Then break our CTL. Easily 1:3 risk to reward.

insight on eurusdbased on higher TF FVG Zone this is a valid buy trade, lot of conflueces influenced this entry. feel free to jump on it.
SELL before BUY Planning to short EURUSD before entering a buy position to capitalize on potential market movements FX:EURUSD

EURUSD LONGPrice swept below support around 1.1473, grabbing liquidity and quickly bouncing back — this is a classic Wyckoff spring setup.
📌 Key Levels
Entry: Around 1.1500
Stop Loss: Below 1.1424 (spring low)
Target 1: 1.1567 (range high)
Target 2: 1.1614 (measured move)
🔍 Why I like this setup:
Fake breakdown (spring) and quick recovery
Buyers showed up right after the sweep
Expecting price to return to the top of the range and possibly break higher . This a trade we hold
💡 A spring is where smart money steps in after trapping sellers — I'm following them.
“I always say that you could publish my rules in the newspaper and no one would follow them. The key is consistency and discipline.”

EURUSD IdeaHere we are waiting for the price to come to our supply zone at 1.16117-1.16344 from where we may enter sell according to the required market structure form .
i will provide the confirmation in thegroup before i place my order .
Please follow to support me !
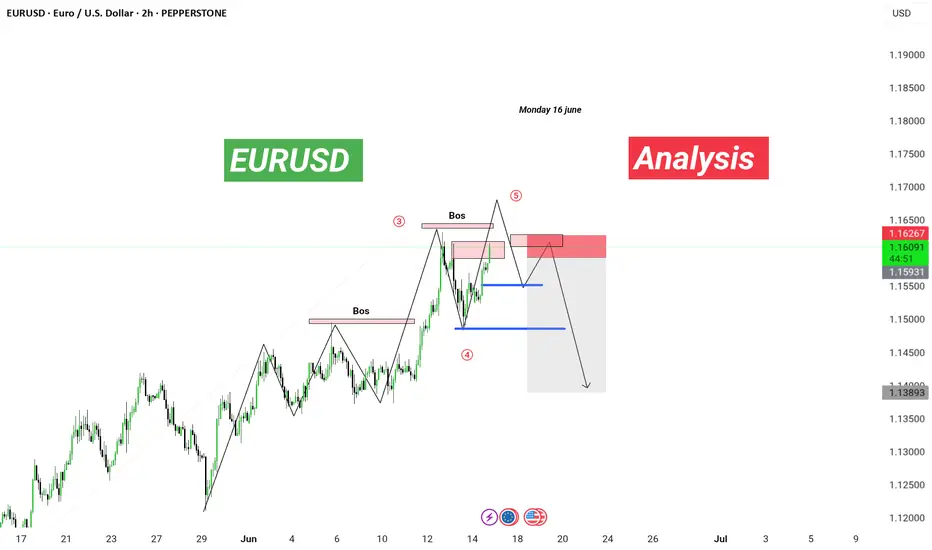
EURUSd a big move down
📉 EUR/USD Analysis | 2H Timeframe
Wave 5 in play! 🚨
Structure shift confirmed with BOS at key supply zone. Expecting liquidity sweep and a bearish reversal 📉
🧠 Smart Money + Elliott Wave Combo:
🔹 BOS at Wave 3 ✅
🔹 Wave 4 retracement held
🔹 Anticipating Wave 5 top-out and reversal
🔹 Targeting major demand zones (blue lines)
🔻 Potential Sell Setup Loading…
📆 Monday, 16 June | 2H Chart
🔍 PEPPERSTONE: EUR/USD
💬 Drop your thoughts below or DM “WAVE” to learn this strategy!
—
🔖 #eurusd #forexanalysis #elliottwave #smartmoneyconcepts #forextrader #fxsignals #technicalanalysis
Eurusd The eurusd has reached a premium level so now it’s selling. After purging minor liquidity in LTF.
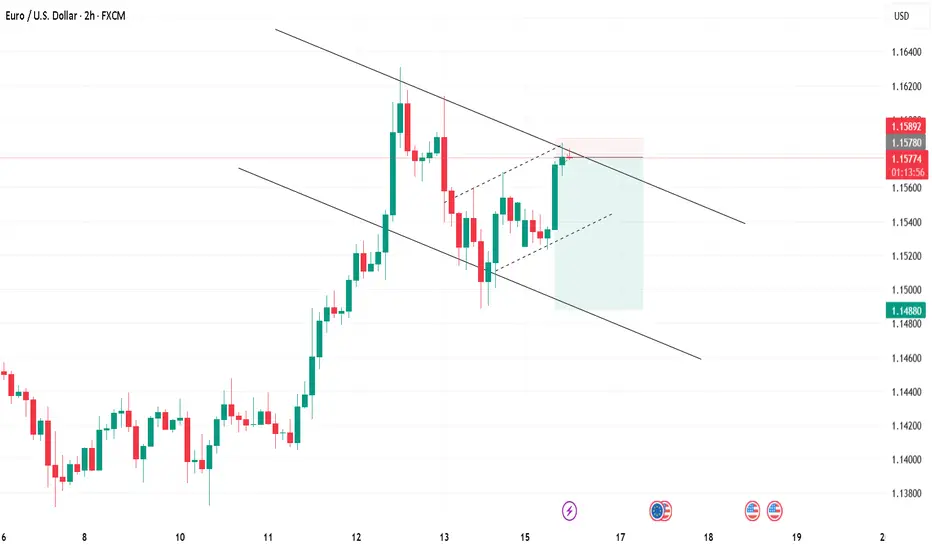
SELL EURUSDEURUSD. We are following the price action inside this bullish flag channel. Price should fall to the demand trend line before continuing higher. Target 1,1488
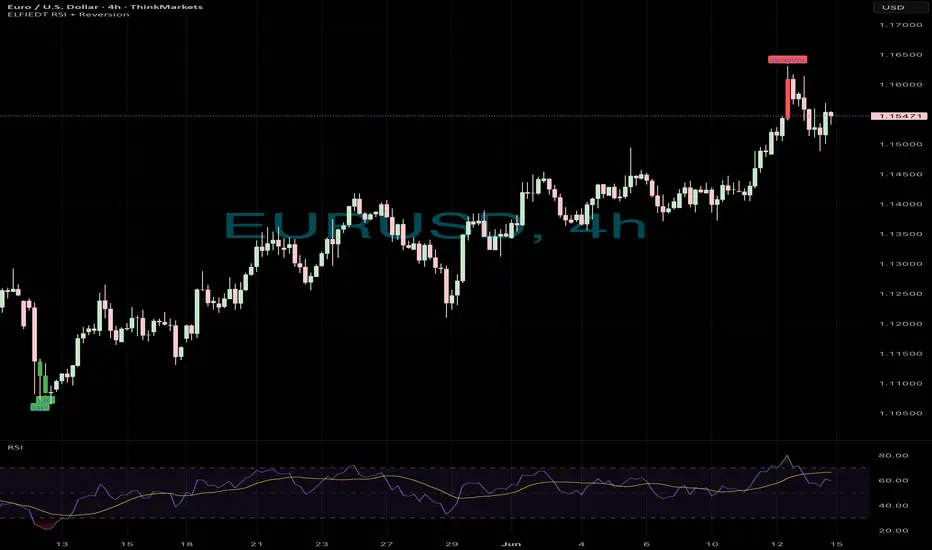
Long run……📈 EURUSD 4H – From Long to Short: Managing the Full Move
This chart shows the power of the ELFIEDT RSI + Reversion Strategy not only in identifying strong short-term reversion trades but also in guiding traders through longer-term swing positions when holding a trade from exhaustion signal to exhaustion signal.
⸻
🟢 Buy Signal – Early Reversal Opportunity
Back on the left of the chart, the strategy printed an “UP” signal after a heavy selloff:
• Price had broken well below the lower volatility band
• RSI entered deeply oversold territory
• A strong bounce followed, confirming the shift in momentum
This setup offered a great opportunity for position traders to enter early on a larger move — and it played out exceptionally well.
⸻
🔺 Trend Continuation Through Higher Lows
After the buy signal, price continued to climb with higher highs and higher lows, allowing the position to be managed with:
• A trailing stop-loss below swing lows
• Partial profit-taking along the way
• Or simply holding for a strategy-based exit
⸻
🔻 Sell Signal – Opposite Reversion Appears
Eventually, the price topped out after a steep rally, and the strategy printed a clear “DOWN” signal:
• Price had pushed far above the upper deviation band
• RSI signaled overbought exhaustion
• A pullback quickly followed
This offered two strategic options for long-term traders:
1. Close the long position fully, locking in gains from the original buy signal
2. Flip the bias and enter a short reversion trade, following the same principles in reverse
⸻
📌 Trade Management Commentary:
• Holding from “UP” to “DOWN” would have captured the full reversion-to-reversion swing — a large, clean multi-week trend
• No need to predict tops or bottoms — just follow the signals and let the market guide you
• For traders who prefer swing or position strategies, using the ELFIEDT signal pairs (buy → sell or sell → buy) can offer a rule-based exit system tied directly to volatility and momentum extremes
⸻
🎯 Takeaway:
The ELFIEDT RSI + Reversion Strategy is not just for scalps or intraday setups — it can also support longer-term trend plays, providing clear visual signals that help eliminate emotional exits and allow trades to mature naturally.
CHECK EURUSD SIGNAL READ CAPTAINTrade Setup Details:
Entry Price: 1.15040 (marked in grey)
Current Price (as per screenshot): 1.15046
Stop Loss: 1.14870 🔻
Take Profit Levels:
TP1: Around 1.15260
TP2: Around 1.15440
Last Target: 1.15730🎯

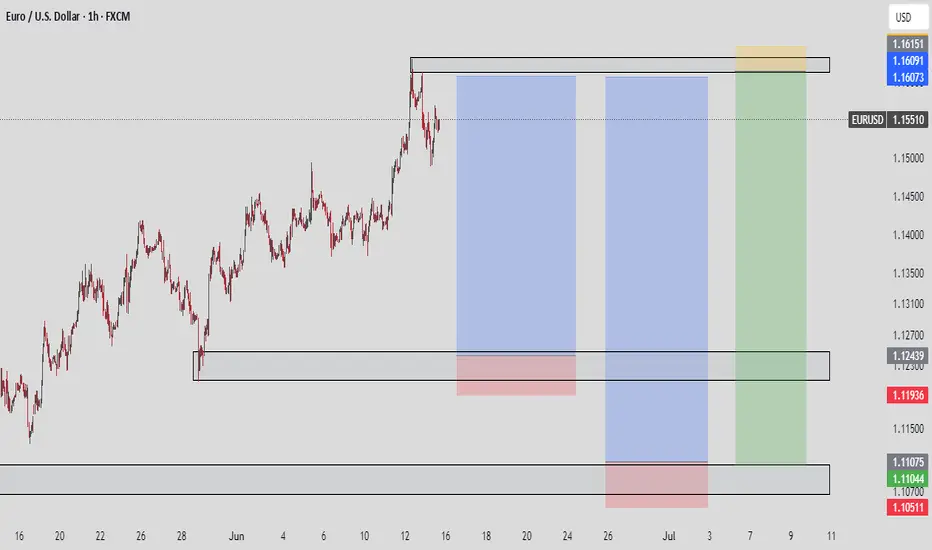
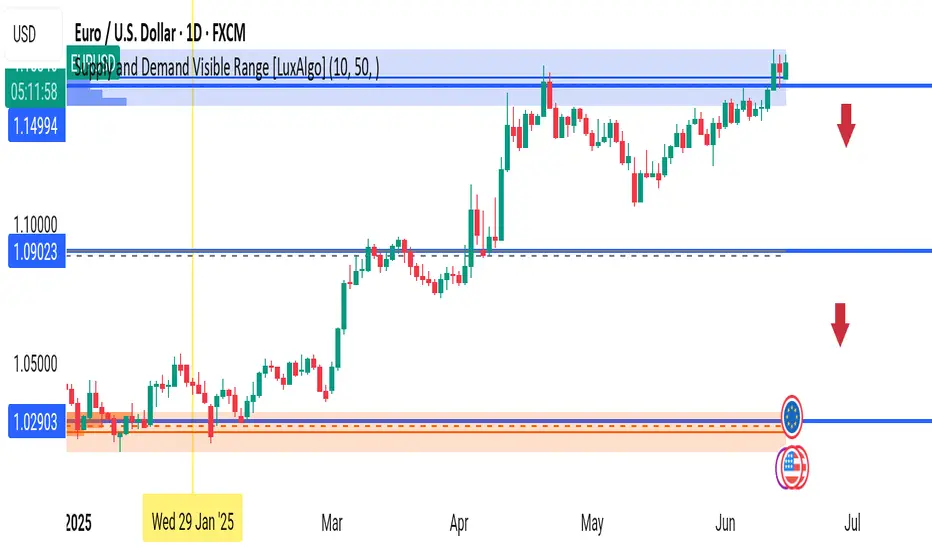
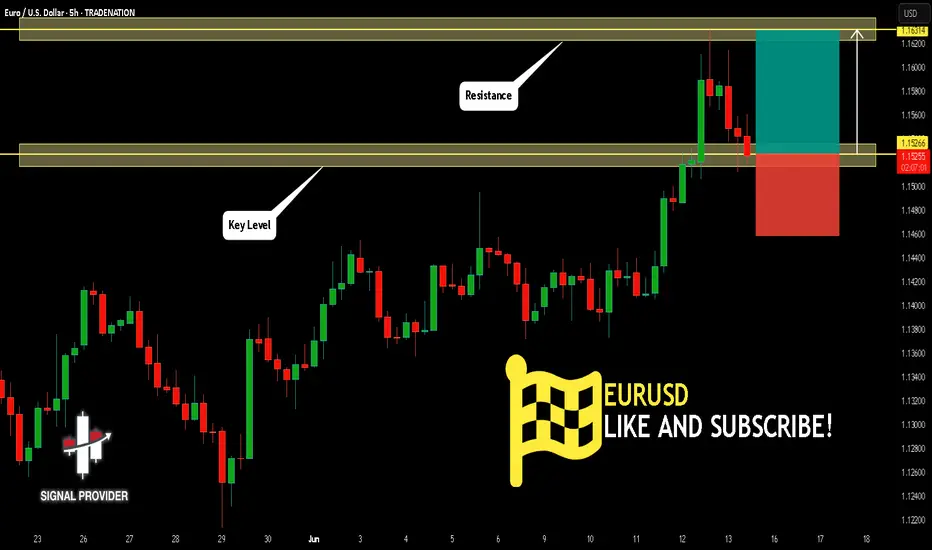
EURUSD at Key Resistance – Bull Trap or Breakout Incoming?The Euro has rallied into a major supply zone at 1.15800+, a level that hasn’t been broken since mid-2023. As price trades within this supply range, traders are eyeing either a strong breakout or a potential rejection back toward demand.
🟦 Key Supply Zone: 1.14994 – 1.16100
🟧 Major Demand Zones:
• 1.09023 (mid-range)
• 1.02903 (long-term support & prior consolidation base)
⚖️ Current Outlook:
• EURUSD is showing strength, but bullish momentum is slowing at resistance.
• A rejection candle from here could signal downside toward 1.0900 and even 1.0290.
• Break and close above 1.16100 on the daily would confirm bullish continuation toward untested zones.
🗓️ Marked Date: January 29, 2025 – Previous structure shift & start of bullish wave
💡 Watch Closely:
Price behavior around the current supply zone will determine direction for weeks ahead. Risk/reward now favors patient traders — wait for confirmation!
🧠 Chart Tools:
LuxAlgo Supply & Demand Visible Range
Timeframe: Daily (1D)
🚨 Potential Scenarios:
🔺 Breakout = Target 1.1800+
🔻 Rejection = Drop toward 1.0900 – 1.0300
👇 What’s your bias here? Are the bulls done or just getting started?
#EURUSD #ForexSignals #LuxAlgo #SupplyAndDemand #PriceAction #ForexStrategy #BreakoutOrRejection #FrankFx #TradingViewAnalysis #SmartMoneyTraders
Bullish bounce off pullback support?The Fiber (EUR/USD) has bounced off the pivot and could rise to the 1st resistance.
Pivot: 1.1444
1st Support: 1.1369
1st Resistance: 1.1587
Risk Warning:
Trading Forex and CFDs carries a high level of risk to your capital and you should only trade with money you can afford to lose. Trading Forex and CFDs may not be suitable for all investors, so please ensure that you fully understand the risks involved and seek independent advice if necessary.
Disclaimer:
The above opinions given constitute general market commentary, and do not constitute the opinion or advice of IC Markets or any form of personal or investment advice.
Any opinions, news, research, analyses, prices, other information, or links to third-party sites contained on this website are provided on an "as-is" basis, are intended only to be informative, is not an advice nor a recommendation, nor research, or a record of our trading prices, or an offer of, or solicitation for a transaction in any financial instrument and thus should not be treated as such. The information provided does not involve any specific investment objectives, financial situation and needs of any specific person who may receive it. Please be aware, that past performance is not a reliable indicator of future performance and/or results. Past Performance or Forward-looking scenarios based upon the reasonable beliefs of the third-party provider are not a guarantee of future performance. Actual results may differ materially from those anticipated in forward-looking or past performance statements. IC Markets makes no representation or warranty and assumes no liability as to the accuracy or completeness of the information provided, nor any loss arising from any investment based on a recommendation, forecast or any information supplied by any third-party.

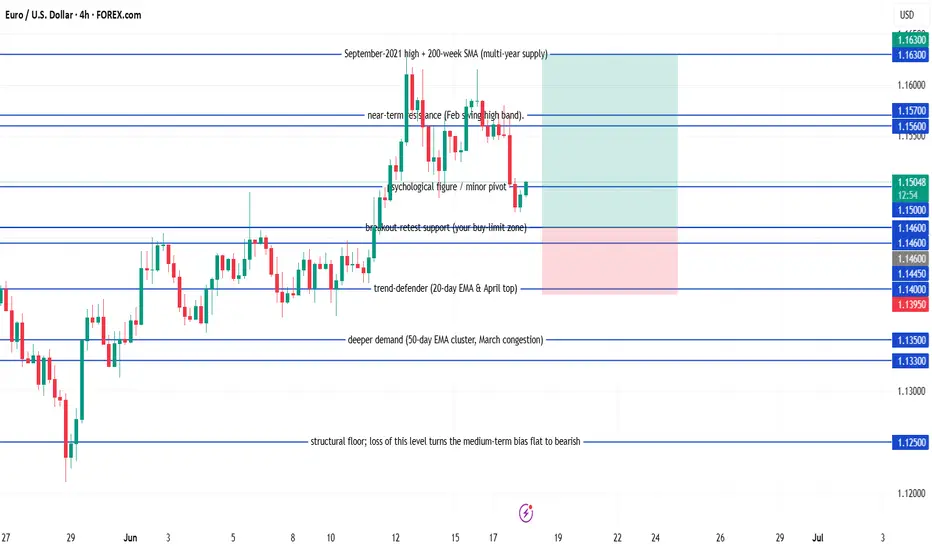
EUR/USD Buy EUR/USD pull-back long
Buy-limit at 1.1460
Stop-loss at 1.1395
Take-profit 1 at 1.1560 – when this first target is reached, move the stop to breakeven
Take-profit 2 at 1.1630
Condition: keep the order active only while the daily candle continues to close at or above 1.1445.
Expiry: if the order hasn’t been filled after five full trading days, cancel it and reassess.
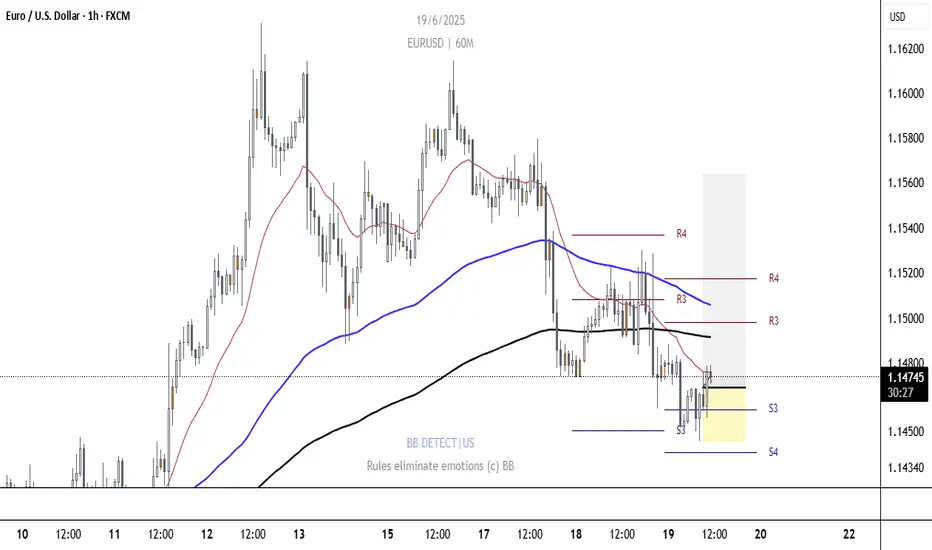
EURUSD: Sharing of the Latest Trading StrategyAll the trading signals today have resulted in profits!!! Check it!!!👉👉👉
Fundamental Analysis:
Global leaders gathering at the G7 summit in Canada has boosted investor risk appetite, favoring a stronger euro.
The U.S. Federal International Trade Court’s ruling that Trump’s tariff actions were illegal has weakened the U.S. dollar to some extent.
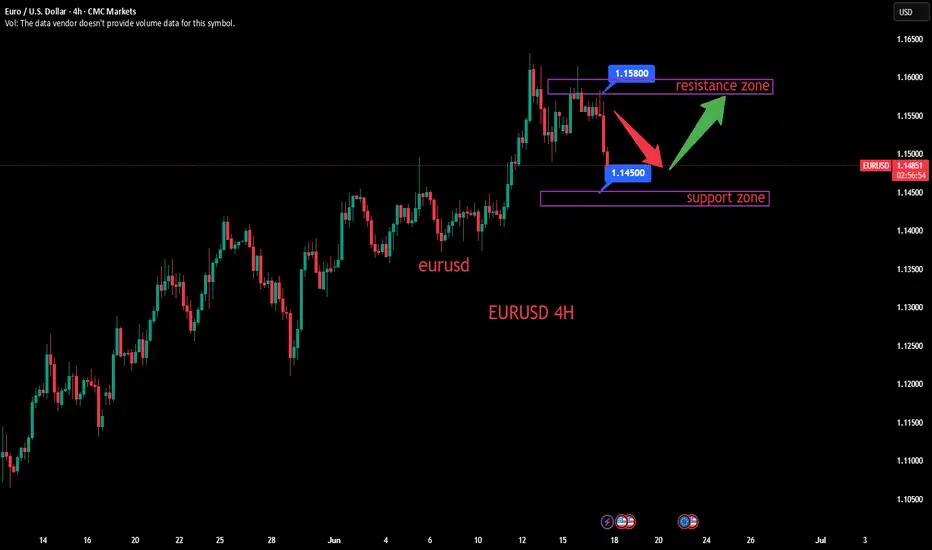
Technical Analysis (4-Hour Chart):
Overall trend is neutral with a slight bullish bias. Bollinger Bands move horizontally, while short-term moving averages show signs of forming a bullish arrangement.
The MACD has formed a death cross, but green momentum has flattened. The RSI has risen to around 50, and the KD indicator forms a golden cross with upward divergence.
Trading Strategy:
Initiate light long positions near 1.1450, setting a stop-loss below 1.1400 and targeting around 1.1550.
buy@ 1.14300–1.14500
TP:1.15500-1.15800
Share accurate trading signals daily—transform your life starting now!
👇 👇 👇 Obtain signals👉👉👉
Opportunity for selling EURUSDI see that EURUSD has confirmed strong resistance, so I took a sell trade with it.
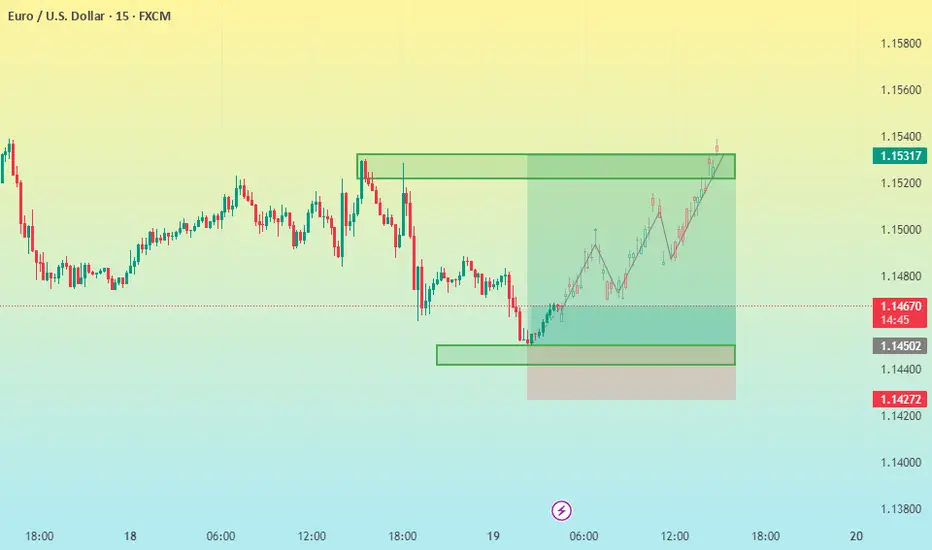
EURUSD 15M CHART PATTERNHere's a structured summary of your EUR/USD trade setup:
---
📈 EUR/USD Buy Setup
Entry (Buy): 1.14660
Take Profit Targets:
1. TP1: 1.14940
2. TP2: 1.15100
3. TP3: 1.15330
Stop Loss: 1.14260
---
⚖ Risk-Reward Ratios
Let’s break down the potential Risk:Reward (R:R) for each target:
Risk per trade: 1.14660 – 1.14260 = 40 pips
R:R for each TP level:
TP1 (1.14940): (1.14940 – 1.14660) = 28 pips → R:R = 0.7:1
TP2 (1.15100): (1.15100 – 1.14660) = 44 pips → R:R = 1.1:1
TP3 (1.15330): (1.15330 – 1.14660) = 67 pips → R:R = 1.7:1
---
🧠 Strategy Suggestions
Scaling Out: You could take partial profits at each TP level to lock in gains and manage risk.
SL Management: Consider moving stop loss to breakeven after TP1 is hit.
Volatility Awareness: Watch for any economic events or Fed/ECB news that might increase volatility.
---
Would you like a position size calculator or a chart visualization for this setup?
EURUSD bullish swing setup on 1HWe have bullish bias on EURUSD, daily and all TF bellow are bullish. Currently we sitting at low point and good idea to pick buy trade. We have 15 min bullish divergence. We already on breakeven.
EURUSD Is Bullish! Buy!
Here is our detailed technical review for EURUSD.
Time Frame: 5h
Current Trend: Bullish
Sentiment: Oversold (based on 7-period RSI)
Forecast: Bullish
The market is approaching a significant support area 1.152.
The underlined horizontal cluster clearly indicates a highly probable bullish movement with target 1.163 level.
P.S
The term oversold refers to a condition where an asset has traded lower in price and has the potential for a price bounce.
Overbought refers to market scenarios where the instrument is traded considerably higher than its fair value. Overvaluation is caused by market sentiments when there is positive news.
Disclosure: I am part of Trade Nation's Influencer program and receive a monthly fee for using their TradingView charts in my analysis.
Like and subscribe and comment my ideas if you enjoy them!
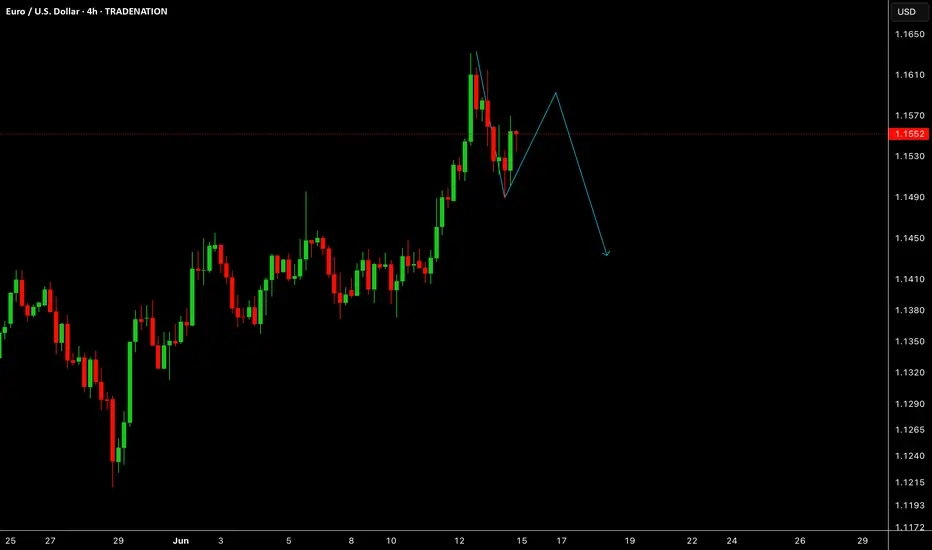
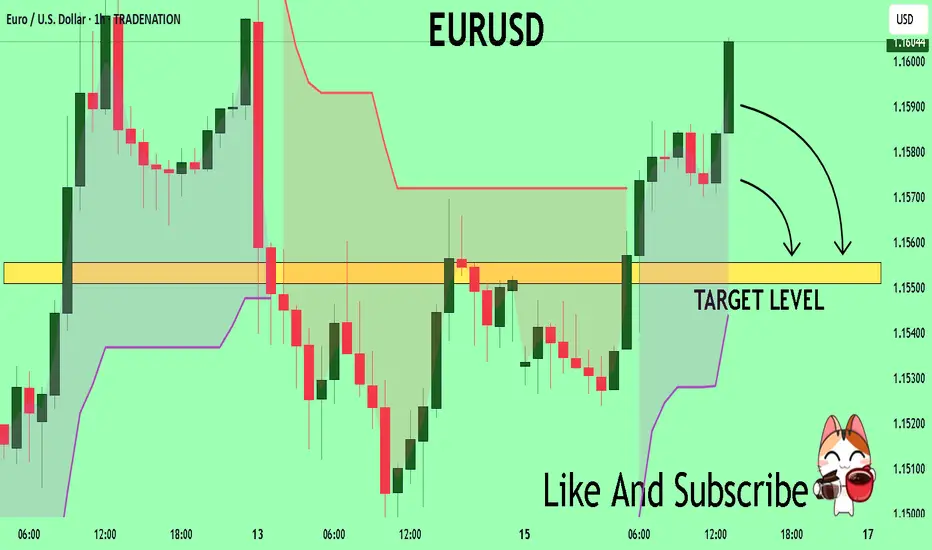
EURUSD The Target Is DOWN! SELL!
My dear subscribers,
This is my opinion on the EURUSD next move:
The instrument tests an important psychological level 1.1588
Bias - Bearish
Technical Indicators: Supper Trend gives a precise Bearish signal, while Pivot Point HL predicts price changes and potential reversals in the market.
Target - 1.1555
About Used Indicators:
On the subsequent day, trading above the pivot point is thought to indicate ongoing bullish sentiment, while trading below the pivot point indicates bearish sentiment.
Disclosure: I am part of Trade Nation's Influencer program and receive a monthly fee for using their TradingView charts in my analysis.
———————————
WISH YOU ALL LUCK
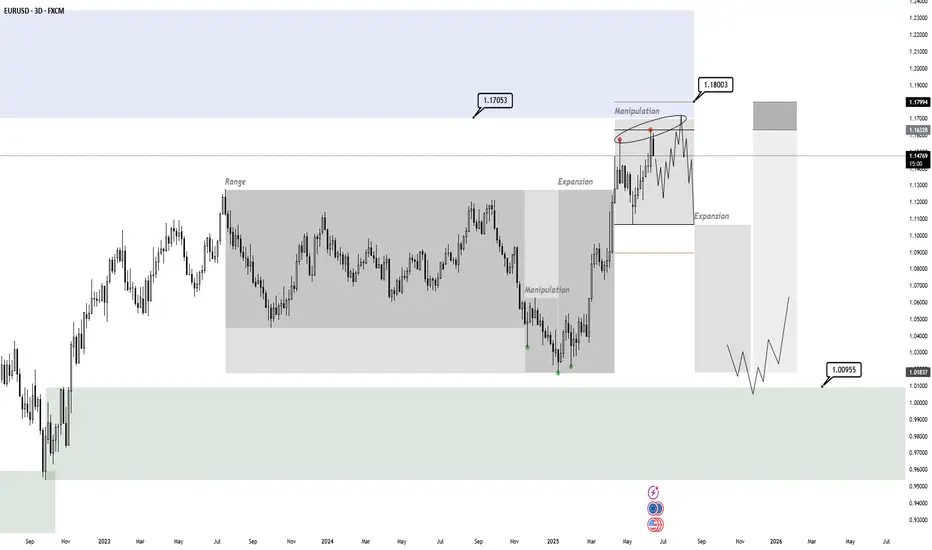
EURUSD PO3If a range forms in this area with distribution into HTF supply, there is a chance of a bearish PO3. One target for this could be the range demand starting in 2022. It is too early to predict this local distribution, as this has only been the first deviation. However, if it does not exceed the deviation limit and the supply, I will continue to monitor it. Starting in January 2025, there was a bullish PO3 that has already reached its technical target. However, it could expand further, invalidate this setup, and keep this demand for later. I will either discard or update this idea depending on developments.
EURUSDEURUSD needs a correction, we are expecting this correction to start in this week.
Disclosure: We are part of Trade Nation's Influencer program and receive a monthly fee for using their TradingView charts in our analysis.