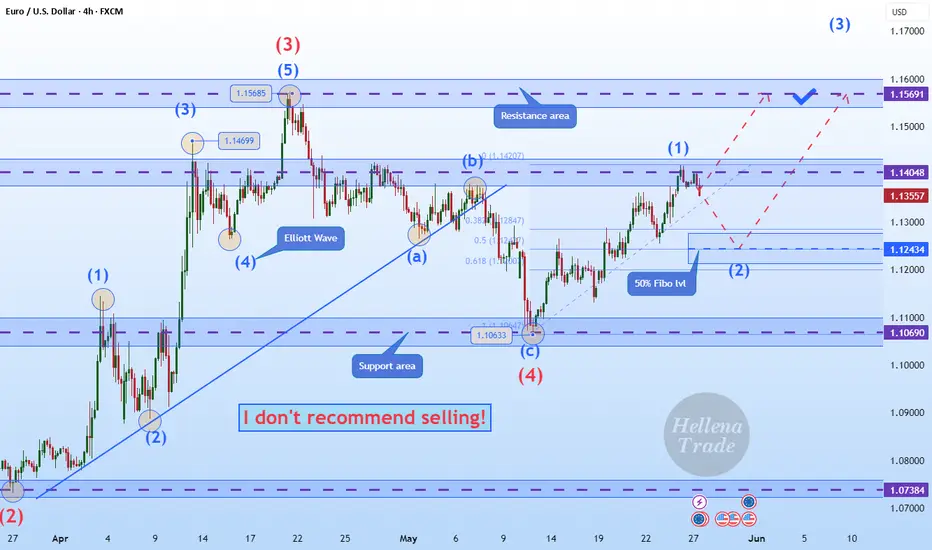
Hellena | EUR/USD (4H): LONG to the resistance area 1.15691.Colleagues, I believe that wave “5” of higher order has actively started an upward movement.
At the moment I see movement in wave “1” of medium order and it means that a correction in wave “2” to the area of 50% Fibonacci level (1.12434) is expected. But I would still advise to consider only upward movement and use pending limit orders.
I see the maximum of wave “3” - resistance area 1.15691 as the target.
Manage your capital correctly and competently! Only enter trades based on reliable patterns!
USDEUX trade ideas
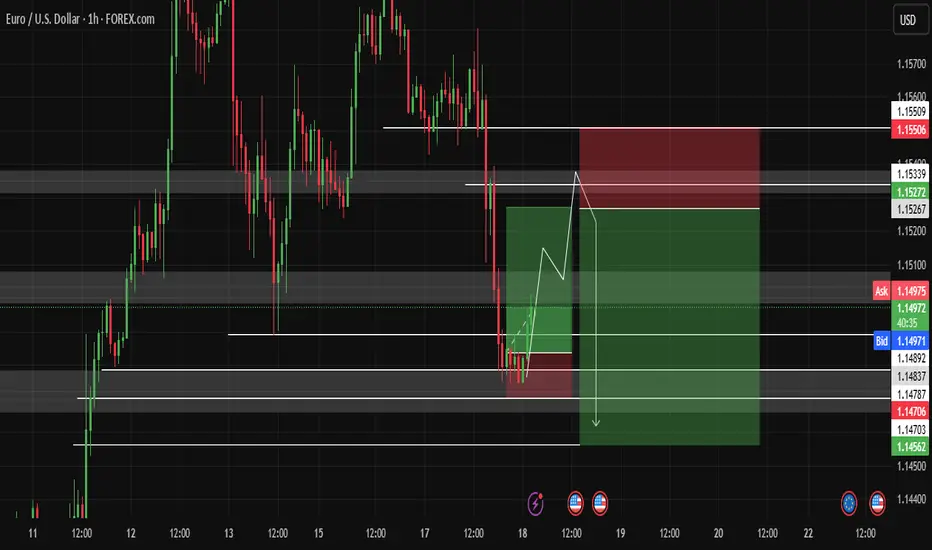
Buying USDBase on the momentum change yesterday on USD.
While EUR is presenting a clear double top with break and on retest

EUR/USD 1H Time Frame – Bearish Trend FormingEUR/USD 1H Time Frame – Bearish Trend Forming
The EUR/USD pair continues to exhibit a bearish trend on the 1-hour chart, indicating increasing downside pressure. The price remains below key resistance levels, suggesting that sellers are still in control.
Technical Overview:
Resistance zone 1.15200
Support Level 1.14400
do you know some tips about this analysis check free and share in comments Thanks.

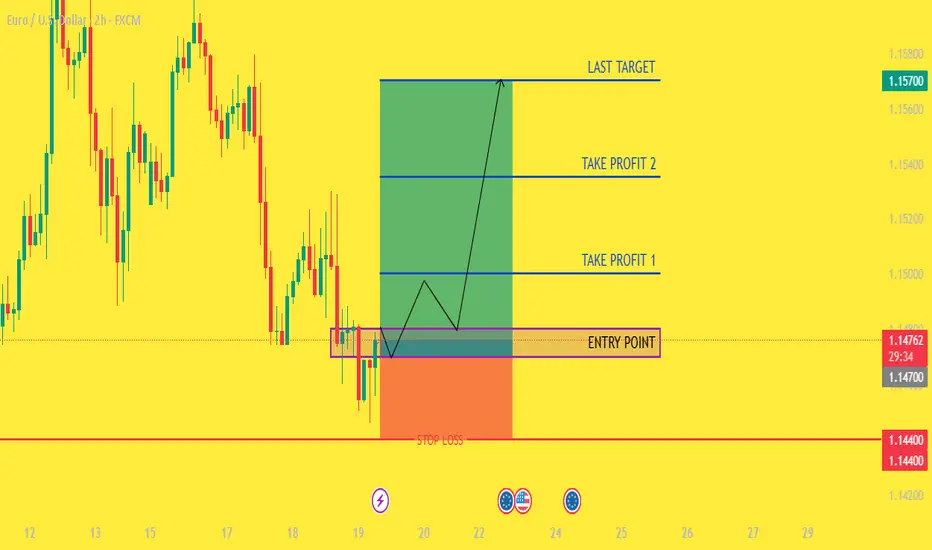
CHECK EURUSD SIGNAL READ CAPTAIN(eurusd) buy zone
(trade satup)
entry point (1.14800) to (1.14700) 📊
first target (1.15000)📊
2nd target (1.15350) 📊
last target (1.15700) 📊
stop loss (1.14400)❌
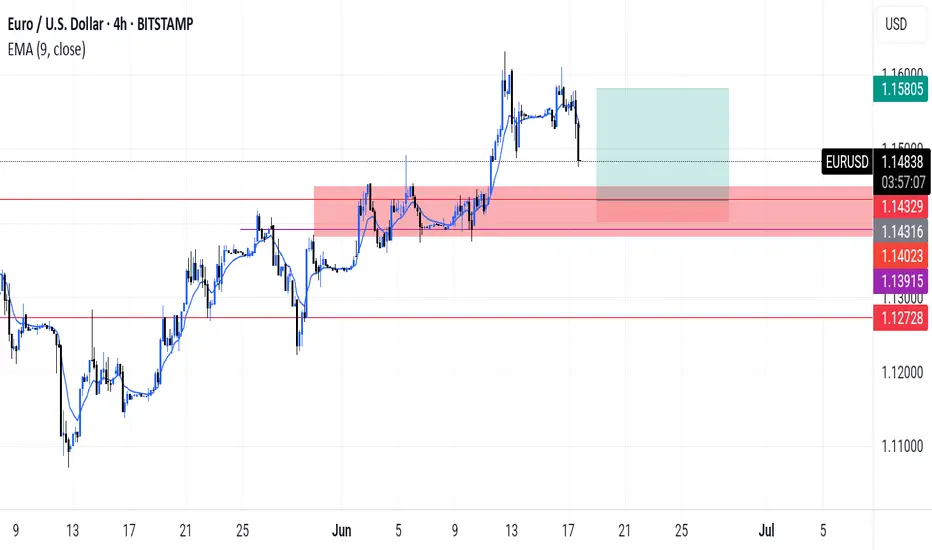
EURUSD - SHORT We have built up quite a lot of liquidity before our major supply zone.
Will give an update in the morning after seeing where price is at

fomc or fomo? crash or rally? let us know! free transparentfomc or fomo?
crash or rally?
let us know!
free transparent no edit no delete
🐉We value full transparency. All wins and fails fully publicized, zero edit, zero delete, zero fakes.🐉
🐉Check out our socials for some nice insights.🐉
information created and published doesn't constitute investment advice!
NOT financial advice

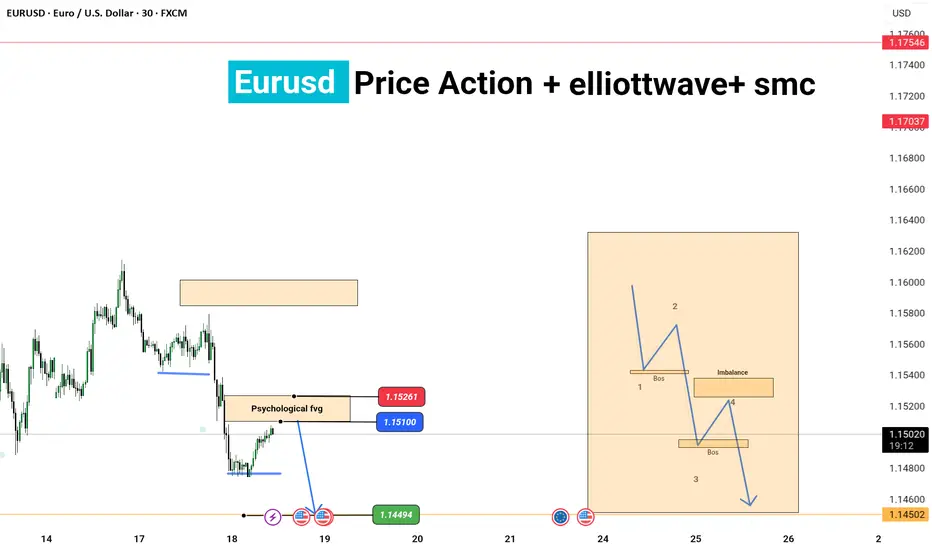
EURUSD: Price Action + Elliott Wave + SMC Analysis
"Hello traders!
Today, we're diving deep into EURUSD with a comprehensive analysis combining Price Action, Elliott Wave principles, and Smart Money Concepts (SMC).
On the chart, we observe key price action elements including:
* A 'Psychological FVG' (Fair Value Gap) around the 1.15100 - 1.15261 area, which could act as a potential resistance or reversal poin
* A target or support level identified around 1.14494 and further down at 1.14502.
Looking ahead, the diagram on the right illustrates a potential Elliott Wave structure integrated with SMC concepts:
* We see proposed waves leading to a 'BOS' (Break of Structure) indicating a shift in market control.
* An 'Imbalance' zone is highlighted, suggesting an area where price might seek to rebalance before continuing its move.
* The overall structure points towards a continued bearish momentum after potential retracements.
Key Takeaways:
* Watch the identified FVG for potential reactions.
* Monitor for further BOS confirmations to validate the bearish outlook.
* The 'Imbalance' zone could offer shorting opportunities if price retests it.
This analysis provides a multi-faceted approach to understanding potential future price movements in EURUSD. Always remember to manage your risk effectively.
What are your thoughts on this analysis? Share your insights in the comments below!
#EURUSD #Forex #PriceAction #ElliottWave #SMC #TradingAnalysis #TechnicalAnalysis #MarketOutlook #ForexTrading"
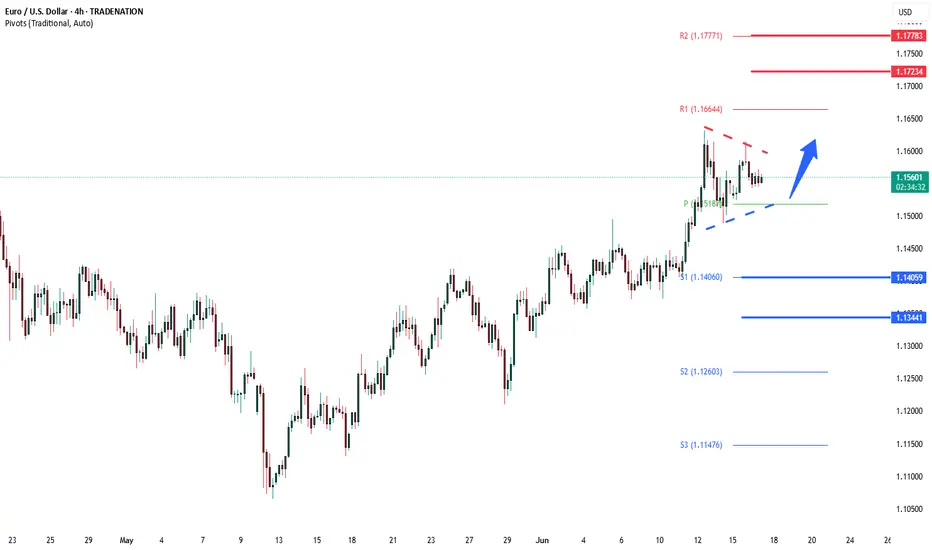
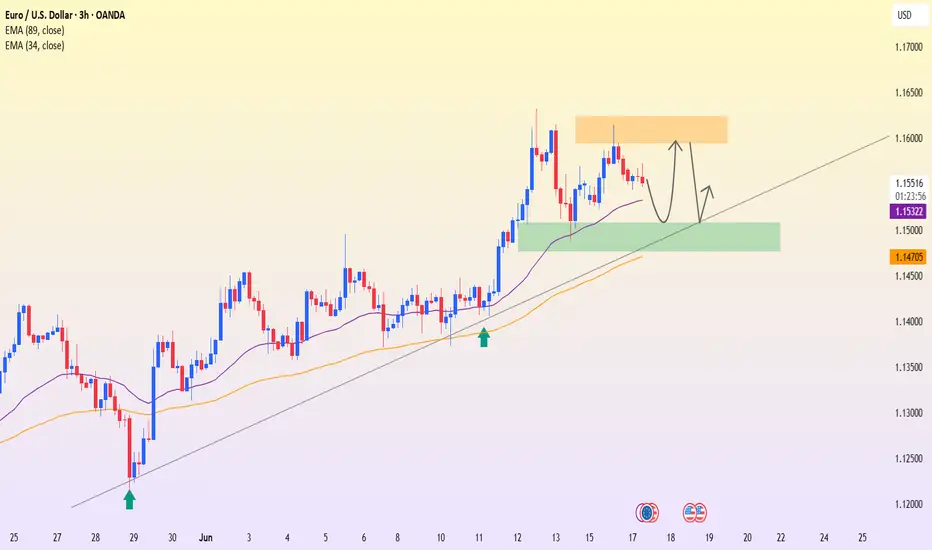
EURUSD Coiling pattern, energy build up support at 1.1520EUR/USD Technical Analysis
Trend Overview:
EUR/USD continues to exhibit bullish price action, supported by a rising trend structure. The recent intraday movement shows signs of sideways consolidation, suggesting a potential continuation pattern rather than reversal.
Key Support Level:
1.1520 – Marks the lower boundary of the previous consolidation range and serves as a critical pivot for directional bias.
Bullish Scenario (Primary Bias):
A corrective pullback into the 1.1520 zone followed by a bullish reversal would confirm continued upward momentum.
Upside targets include:
1.1664 – Near-term resistance.
1.1723 – Mid-term target.
1.1780 – Long-term resistance aligned with prior highs.
Bearish Scenario (Invalidation):
A decisive break and daily close below 1.1520 would invalidate the current bullish outlook.
This would signal a shift toward a deeper correction, targeting:
1.1460 – Initial retracement level.
1.1345 – Major support zone on a broader timeframe.
Conclusion:
The broader trend in EUR/USD remains bullish, with the 1.1520 level acting as a key support threshold. A bounce from this level would support continued upside movement toward 1.1780. However, a confirmed break below 1.1520 would shift momentum to the downside and expose the pair to a deeper retracement.
This communication is for informational purposes only and should not be viewed as any form of recommendation as to a particular course of action or as investment advice. It is not intended as an offer or solicitation for the purchase or sale of any financial instrument or as an official confirmation of any transaction. Opinions, estimates and assumptions expressed herein are made as of the date of this communication and are subject to change without notice. This communication has been prepared based upon information, including market prices, data and other information, believed to be reliable; however, Trade Nation does not warrant its completeness or accuracy. All market prices and market data contained in or attached to this communication are indicative and subject to change without notice.
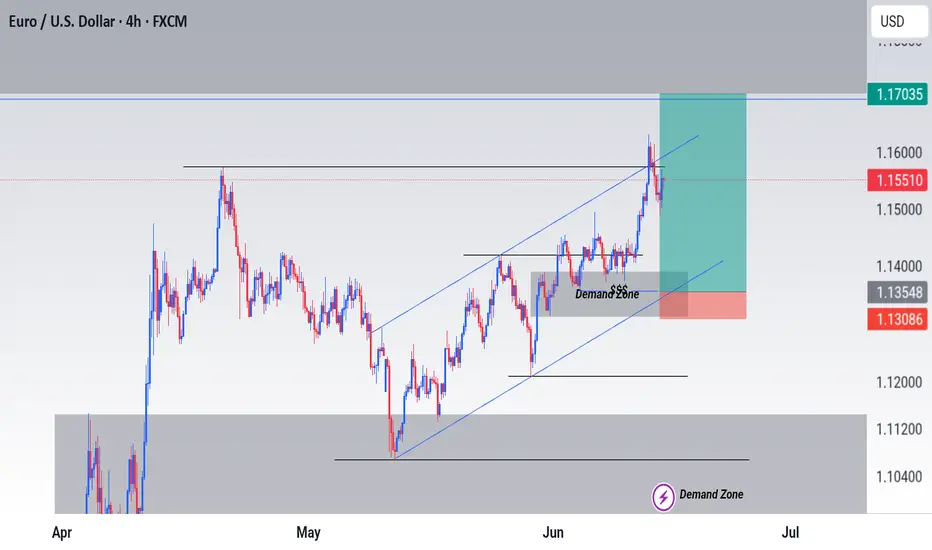
EURUSD, GBPUSD - Outlook for next weekEURUSD - So we have 2x 4 hour POI's (Points Of Interest). Will be looking at potential reversals at both POI's however, within the first POI we have an area of potential liquidity that could look to be taken before we make out move back to the upside.
Therefor, the second POI could look to be our more solid option for our buying options at some point next week.
GBPUSD - This pair looks to be building its liquidity now for potential trades to the upside as today on the lower TF's it was setting quite a few traps for the potential longs and the traders that would have been shorting the breaks below structure to the left.
If you have any questions for me please do let me know

EURUSD: Market of Buyers
The charts are full of distraction, disturbance and are a graveyard of fear and greed which shall not cloud our judgement on the current state of affairs in the EURUSD pair price action which suggests a high likelihood of a coming move up.
Disclosure: I am part of Trade Nation's Influencer program and receive a monthly fee for using their TradingView charts in my analysis.
❤️ Please, support our work with like & comment! ❤️
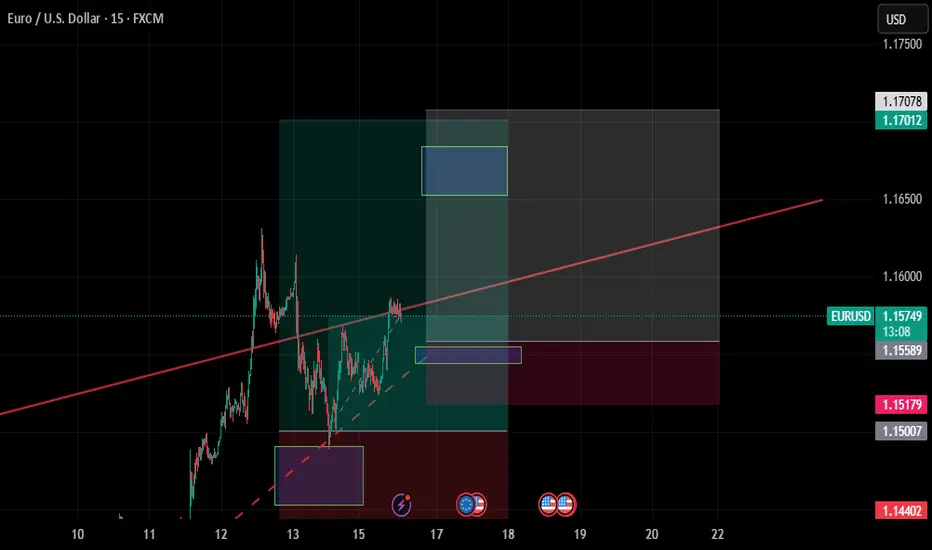
long on EURUSD 15m*The content on this analysis is subject to change at any time without notice, and is provided for the sole purpose of assisting traders to make independent investment decisions.
EURUSD – Healthy pullback within a strong uptrendEURUSD is undergoing a temporary correction after a strong bullish move, but the pair remains above key technical support levels such as the EMA34 and the ascending trendline. The 1.15070 zone now acts as a potential buy area—where demand may return if confirmation signals appear.
Market sentiment is leaning toward the expectation that the Fed may cut interest rates soon due to weaker-than-expected U.S. retail sales data, which has weighed on the USD and indirectly supported the euro. Meanwhile, the ECB continues to maintain a stable policy stance, further reinforcing the current bullish trend.
If the price holds above the green support zone, the next target could be around 1.15940. If this support breaks, traders should watch price behavior at the trendline before making the next trading decision.
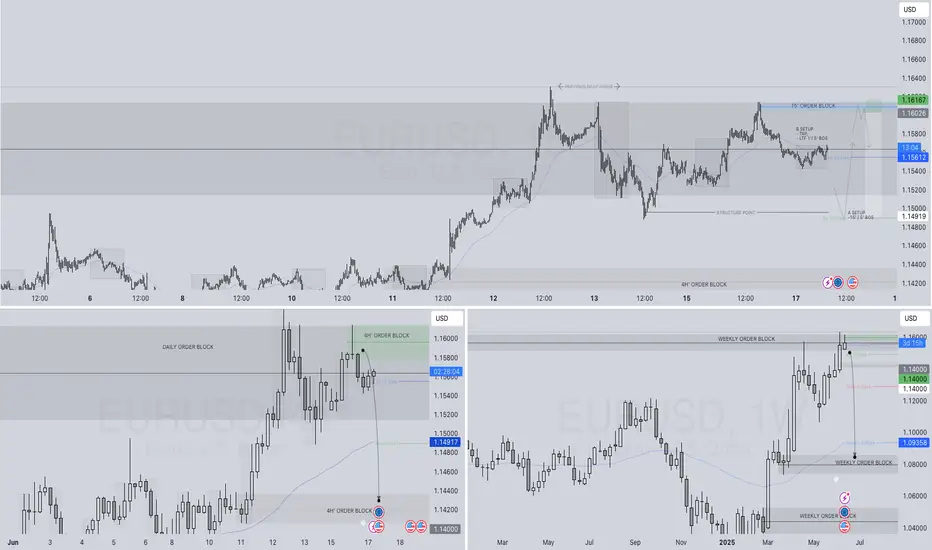
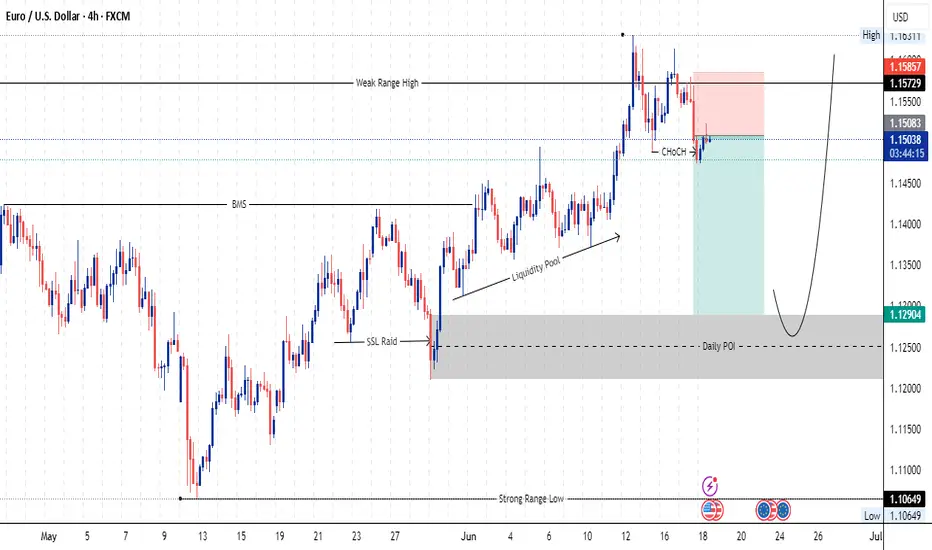
EURUSD SHORT FORECAST Q2 W25 D17 Y25EURUSD SHORT FORECAST Q2 W25 D17 Y25
Professional Risk Managers👋
Welcome back to another FRGNT chart update📈
Diving into some Forex setups using predominantly higher time frame order blocks alongside confirmation breaks of structure.
Let’s see what price action is telling us today!
💡Here are some trade confluences📝
✅Weekly order block rejection
✅15' order block
✅4 hour order block identified
✅Tokyo ranges to be filled
🔑 Remember, to participate in trading comes always with a degree of risk, therefore as professional risk managers it remains vital that we stick to our risk management plan as well as our trading strategies.
📈The rest, we leave to the balance of probabilities.
💡Fail to plan. Plan to fail.
🏆It has always been that simple.
❤️Good luck with your trading journey, I shall see you at the very top.
🎯Trade consistent, FRGNT X
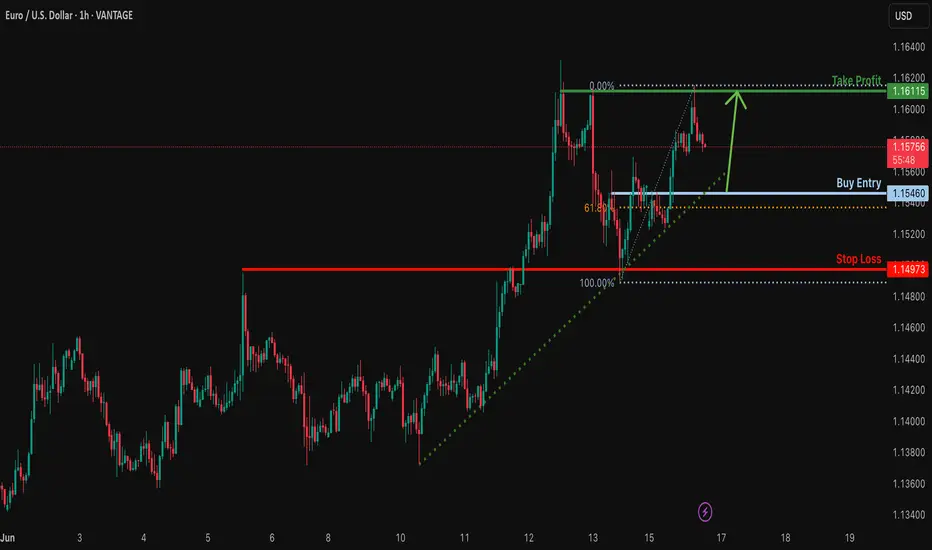
Bullish bounce?EUR/USD is falling towards the support level which is a pullback support that is slightly above the 61.8% Fibonacci retracement and could bounce from this level to our take profit.
Entry: 1.1546
Why we like it:
There is a pullback support level that is slightly above the 61.8% Fibonacci retracement.
Stop loss: 1.1497
Why we like it:
There is an overlap support level.
Take profit: 1.1611
Why we like it:
There is a pullback resistance.
Enjoying your TradingView experience? Review us!
Please be advised that the information presented on TradingView is provided to Vantage (‘Vantage Global Limited’, ‘we’) by a third-party provider (‘Everest Fortune Group’). Please be reminded that you are solely responsible for the trading decisions on your account. There is a very high degree of risk involved in trading. Any information and/or content is intended entirely for research, educational and informational purposes only and does not constitute investment or consultation advice or investment strategy. The information is not tailored to the investment needs of any specific person and therefore does not involve a consideration of any of the investment objectives, financial situation or needs of any viewer that may receive it. Kindly also note that past performance is not a reliable indicator of future results. Actual results may differ materially from those anticipated in forward-looking or past performance statements. We assume no liability as to the accuracy or completeness of any of the information and/or content provided herein and the Company cannot be held responsible for any omission, mistake nor for any loss or damage including without limitation to any loss of profit which may arise from reliance on any information supplied by Everest Fortune Group.
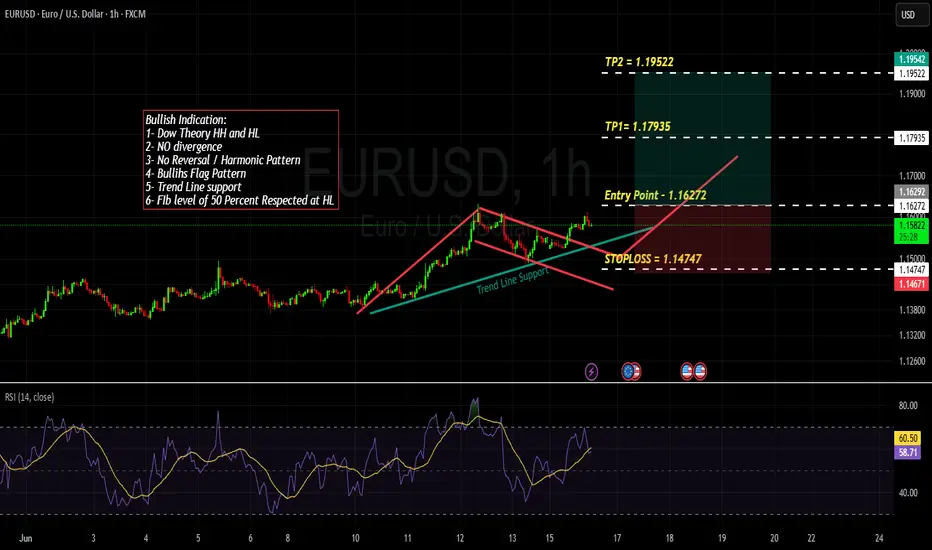
EURUSD - Bullish Continuation ConfluencesStory : Market is making series of HH and HL with a trendline support respect. Market has respected Fib level of 50% on HL at 1.14747 level. Currently there is no divergence therefore we are ignoring any reversal or Harmonic pattern. however, Bullish Flag pattern can be seen on the chart. Also the Seasonal of this pair is Bullish in the month of June based on last 15 years data
Anticipate : I anticipate that market will keep moving in bullish trend.
Plan : We plan our entry on the break of neckline which is 1.16272 and with our R:R of 1:1 & 1:2 plan our TPs accordingly at 1.17935 and 1.19252 as marked in the chart.
Pull the trigger Guyz and grab your profit.
DO like, share and comment if you liked tha analysis.
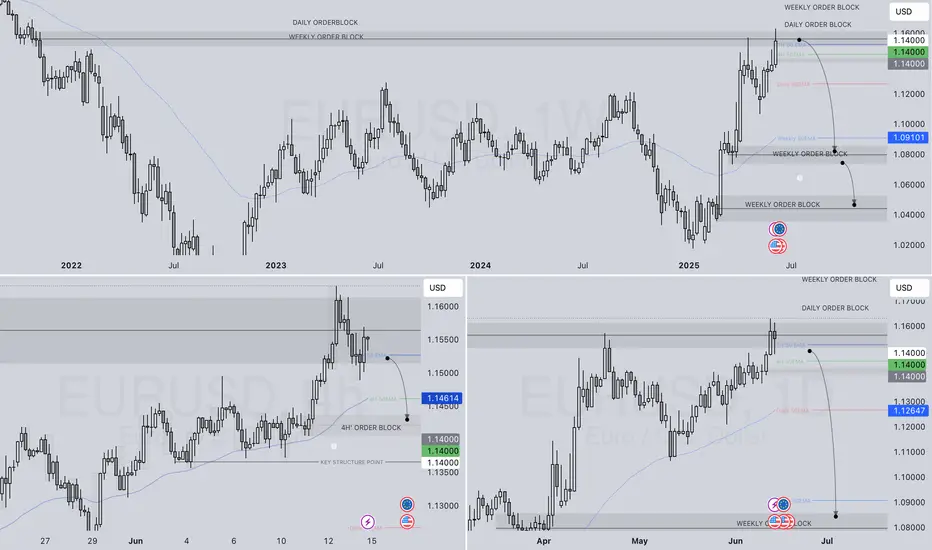
EURUSD WEEKLY HTF FORECAST Q2 W25 Y25EURUSD WEEKLY HTF FORECAST Q2 W25 Y25
Professional Risk Managers👋
Welcome back to another FRGNT chart update📈
Diving into some Forex setups using predominantly higher time frame order blocks alongside confirmation breaks of structure.
💭NOTE- If price closes above the key weekly/ daily order block with daily close- re evaluation will be required.
🔑 Remember, to participate in trading comes always with a degree of risk, therefore as professional risk managers it remains vital that we stick to our risk management plan as well as our trading strategies.
📈The rest, we leave to the balance of probabilities.
💡Fail to plan. Plan to fail.
🏆It has always been that simple.
❤️Good luck with your trading journey, I shall see you at the very top.
🎯Trade consistent, FRGNT X
My Thoughts #016HTF
The pair is in a bullish trend
In the trend it's currently making a new HH on the lower time frame.
LTF
Since it's making a HH it means it's in a bullish trend
Currently in the bullish it's making a HL
It could sell and drop lower to invalidate the set up
Use proper risk management
Let's do the most
Up down up and downWe are in a bullish channel and have just retested the support and got our confirmation. We will likely see one more retest at resistance before dropping significantly, on the way down I anticipate a fakeout before dropping more. So basically just going to bounce between some lines then drop

EURUSD,GBPUSD and USDJPY Analysis todayHello traders, this is a complete multiple timeframe analysis of this pair. We see could find significant trading opportunities as per analysis upon price action confirmation we may take this trade. Smash the like button if you find value in this analysis and drop a comment if you have any questions or let me know which pair to cover in my next analysis.

This is my views on EURUSD so far.I have not yet taken a single position on this pair because price has not yet met my execution requirements. Overall views on the pair are short term bullish to the Weekly/Monthly POI's then I will be looking for a long term bearish structure.
euro/usdtrade 5 as u can see from our last trade 5 its where we want it and the entry level is where my take profit is once it hits this mark asre be looking for a reaction agaist the red daily surport/resitance line and let it be used as a surport line to retrace and possibly make a new high but are aim would be just to test the highest high on the charts
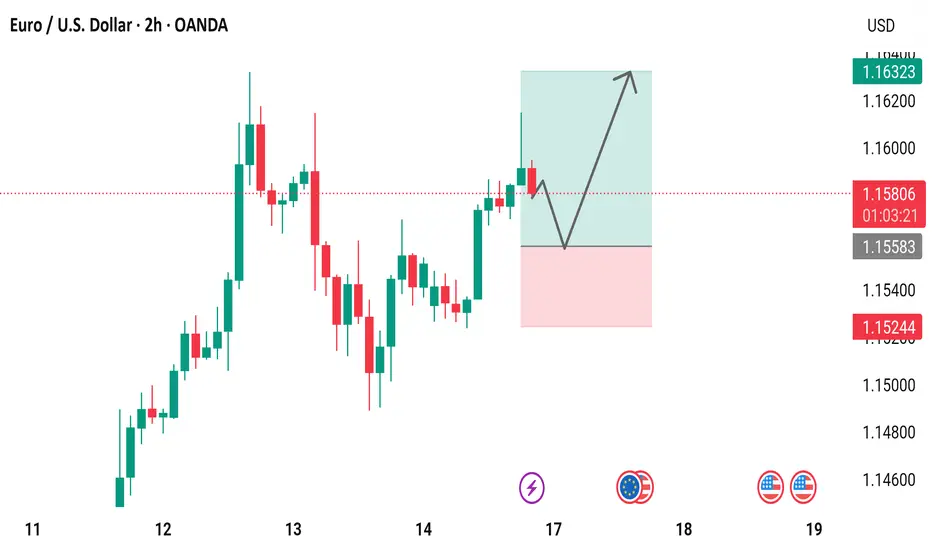
EUR/USD 2-Hour Chart Analysis2-hour candlestick analysis of the Euro/US Dollar (EUR/USD) pair, with a recent uptrend from a low of 1.15244 to 1.15816 (+0.26%). A breakout above the resistance level is highlighted, suggesting potential bullish momentum.