EURUSD is in uptrend within up channelEURUSD is in uptrend within up channel. US dollar is continously weakening due to political crisis in cities.
USDEUX trade ideas

Price action Looks like these trade have changed as I'm looking at eurusd I see trand is still bullish the last break of structure is on upside

EURUSD pushing away from 2025 highsAfter creating a new 2025 high last week, MARKETSCOM:EURUSD is now in a slight correction mode. Will the bears take control from here? Let's have a look.
FX_IDC:EURUSD
Let us know what you think in the comments below.
Thank you.
77.3% of retail investor accounts lose money when trading CFDs with this provider. You should consider whether you understand how CFDs work and whether you can afford to take the high risk of losing your money. Past performance is not necessarily indicative of future results. The value of investments may fall as well as rise and the investor may not get back the amount initially invested. This content is not intended for nor applicable to residents of the UK. Cryptocurrency CFDs and spread bets are restricted in the UK for all retail clients.

CHECK EURUSD SIGNAL READ CAPTAIN Key Levels:
Entry Point: Around 1.15150
Stop Loss: 1.15300
Take Profit 1: 1.15000
Take Profit 2: 1.14900
Last Target: 1.14800

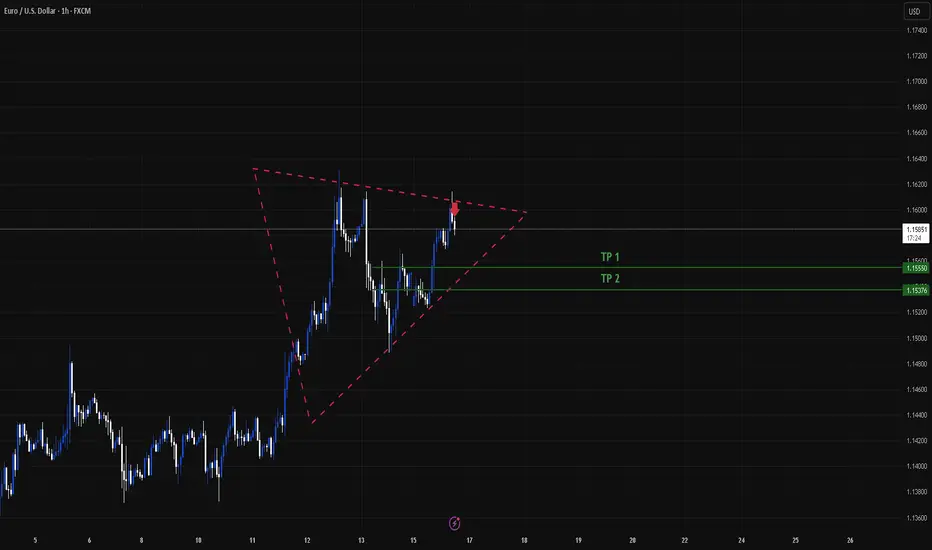
Bullish momentum to extend?EUR/USD has reacted off the resistance level which is a pullback resistance and could rise from this level to our take profit.
Entry: 1.1451
Why we like it:
There is a pullback support level.
Stop loss: 1.1386
Why we like it:
There is a pullback support level.
Take profit: 1.1558
Why we like it:
There is a pullback resistance level.
Enjoying your TradingView experience? Review us!
Please be advised that the information presented on TradingView is provided to Vantage (‘Vantage Global Limited’, ‘we’) by a third-party provider (‘Everest Fortune Group’). Please be reminded that you are solely responsible for the trading decisions on your account. There is a very high degree of risk involved in trading. Any information and/or content is intended entirely for research, educational and informational purposes only and does not constitute investment or consultation advice or investment strategy. The information is not tailored to the investment needs of any specific person and therefore does not involve a consideration of any of the investment objectives, financial situation or needs of any viewer that may receive it. Kindly also note that past performance is not a reliable indicator of future results. Actual results may differ materially from those anticipated in forward-looking or past performance statements. We assume no liability as to the accuracy or completeness of any of the information and/or content provided herein and the Company cannot be held responsible for any omission, mistake nor for any loss or damage including without limitation to any loss of profit which may arise from reliance on any information supplied by Everest Fortune Group.

EURUSD BermundaHi guys, this is EURUSD short idea for make some pips...
I hope it will be interesting.
ABC Bullish Hello awesome traders, hope you're having a great week!
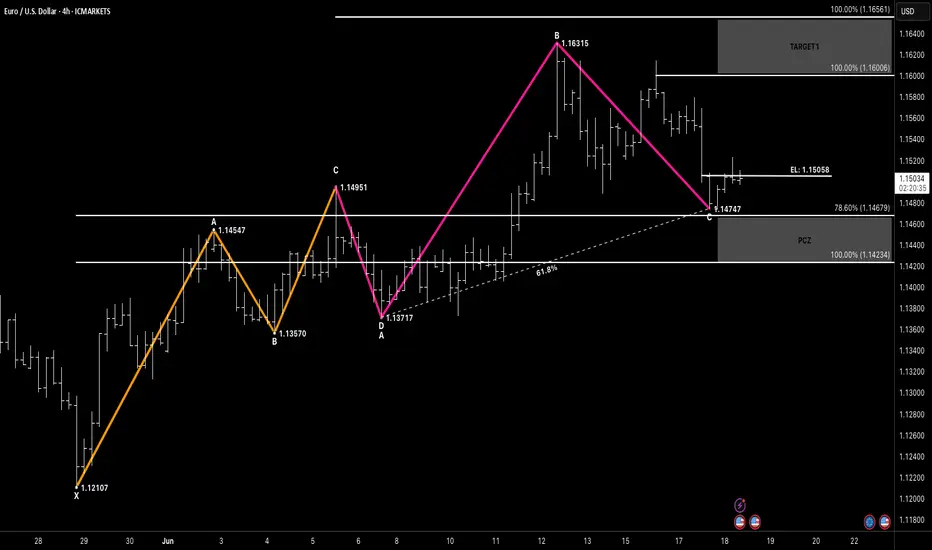
We’ve got a clean ABC bullish setup unfolding beautifully on EURUSD 4H:
🔶 Pattern: ABC Bullish
🕓 Timeframe: 4H
⚡️ Structure: AB=CD completion at 61.8% with PRZ confluence
📍 Entry Level: 1.15058 (confirmed breakout + retest)
🎯 Target 1: 1.16006 (AB=CD)
🎯 Target 2: 1.16561 (extended projection)
🛑 Invalidation: Below 1.13717 (D-point)
Technical Highlights:
✅ 61.8% retracement support at D
✅ 78.6% BC retracement
✅ Price bounced cleanly and is consolidating above EL
✅ Momentum build above structure, higher lows in play
📊 Watching for continuation toward 1.1600 and beyond if structure holds.
Trade smart, protect capital, and let the pattern do the work!
Opportunity for buying EURUSDEURUSD touched strong support, so I think it will rise further, as shown.
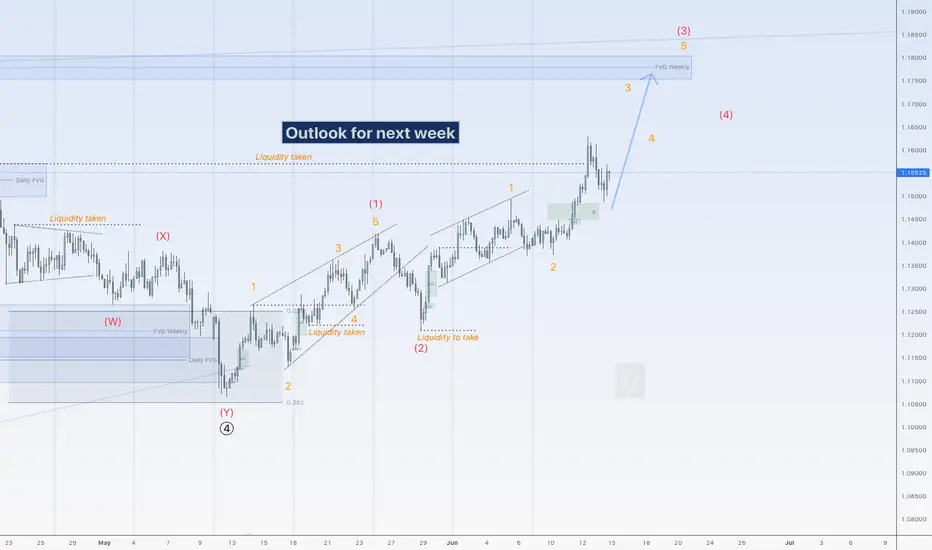
More upside for EUHi traders,
Last week EU made a small correction to the downside but after that it went up again.
This could be wave 3 (red).
So if this is true, next week we could see more upside to finish wave 3 into the Weekly FVG.
Let's see what the market does and react.
Trade idea: Wait for the finish of a small correction down on a lower time frame to trade longs.
If you want to learn more about trading with FVG's, liquidity sweeps and Wave analysis, then make sure to follow me.
This shared post is only my point of view on what could be the next move in this pair based on my technical analysis.
Don't be emotional, just trade your plan!
Eduwave
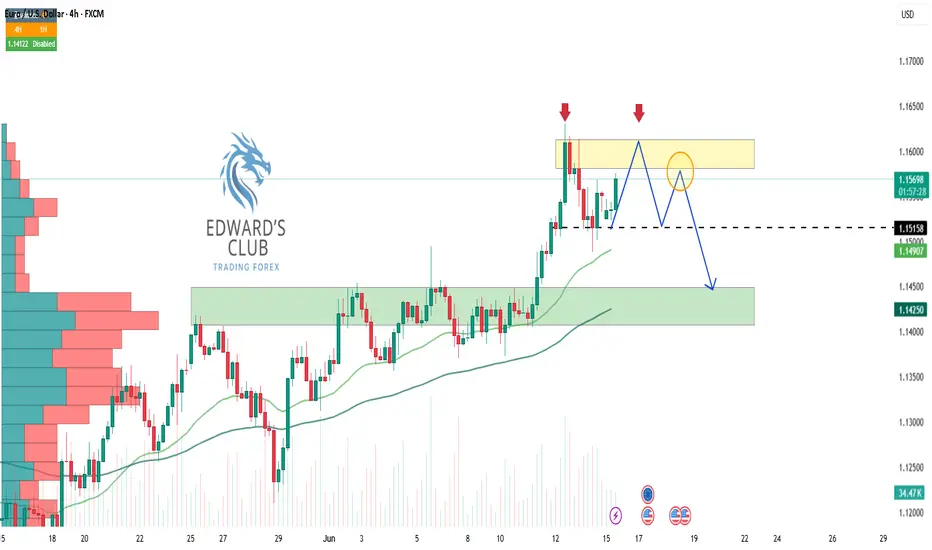
EURUSD – Follow-Up UpdateEURUSD traded above the 1.1573 level on Thursday, marking a second break to the upside following the earlier trend-changing pattern — a potential sign of bullish continuation.
However, on the 1H/M15 chart, we've observed a minor ABC corrective decline (pullback). We’re now watching for a break below 1.1511, which could signal the start of a short-term bearish move.
🎯 Short-Term Target:
The next key level is 1.1214, a weekly structural support zone and the low of the previous trend-changing pattern.
📌 Key Zones to Watch:
Bearish confirmation: Break below 1.1511
Medium-term target: 1.1214
Stay alert to price action around these levels.
Trade safe, and have a blessed weekend.

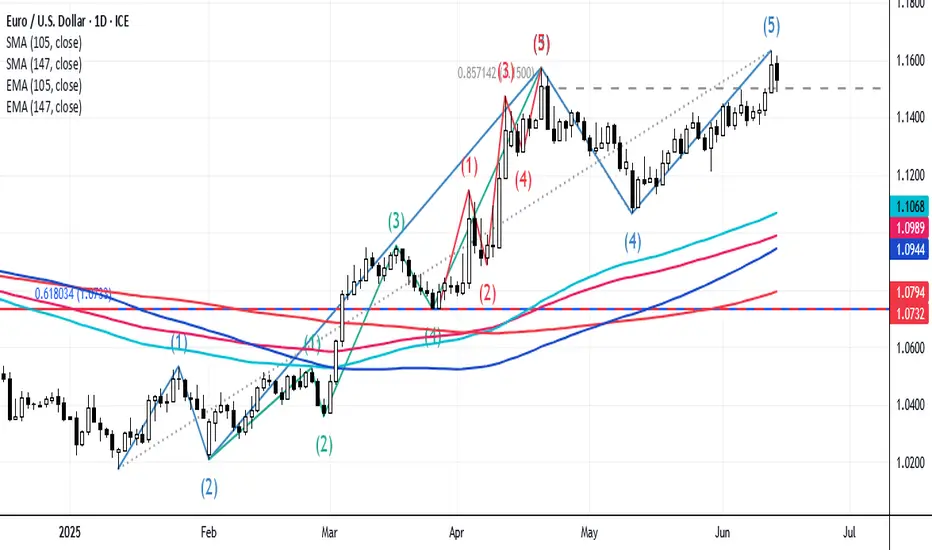
EURUSD topped? This Elliott wave count says YES!In our previous analysis, we were EURUSD bearish, and although we are trading about 2 cents higher now than when that analysis was published, we are still convinced that these high hills are shortable.
The pair, in our opinion, has finished a complete 5-wave Elliott formation earlier this week, and we prefer the short, with 2 targets that seem particularly interesting:
1. The flat correction target around 1.1065
2. The bottom of wave 4 of a lesser degree, at 1.0733, which is equal to, exactly & down to the pip, to the 61.8% retracement for the whole 5-wave sequence!
We will continue to be bearish for as long as 1.1704 is not clearly penetrated.
Whether the price penetrates 1.1704 & we give up, or, the market moves into our profit zone, we will post updates every week or so. Stay tuned!
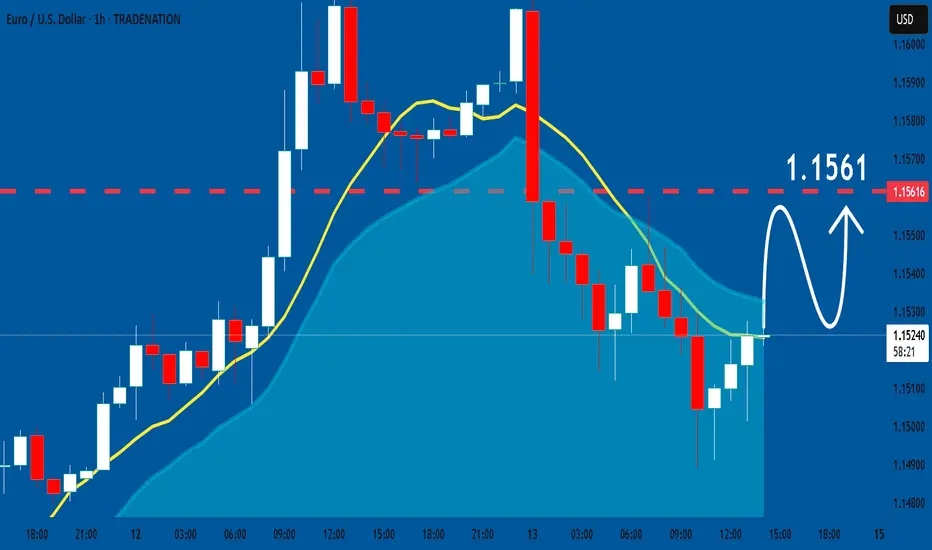
EURUSD: Bulls Will Push Higher
Remember that we can not, and should not impose our will on the market but rather listen to its whims and make profit by following it. And thus shall be done today on the EURUSD pair which is likely to be pushed up by the bulls so we will buy!
Disclosure: I am part of Trade Nation's Influencer program and receive a monthly fee for using their TradingView charts in my analysis.
❤️ Please, support our work with like & comment! ❤️
EURUSD 16 June – Technical Rebound or Liquidity Trap? EURUSD 16 June – Technical Rebound or Liquidity Trap?
The EURUSD pair has shown sharp movements after testing key resistance near 1.1607. While the price action may appear bullish at first glance, deeper analysis suggests we might be facing either a continuation of the uptrend or a strategic liquidity hunt.
🌍 Macro & Fundamental Overview
The ECB remains hawkish with rates still high, but recent commentary hints at a more dovish tone possibly leading to rate cuts in late Q3 2025.
Meanwhile, the Federal Reserve maintains its cautious stance, holding off on rate cuts due to sticky core inflation.
This divergence in policy expectations creates a neutral to slightly USD-favorable bias, depending on upcoming economic data.
⏳ Bottom line: EURUSD remains in a choppy environment with compression–expansion cycles, and no confirmed macro-driven trend yet.
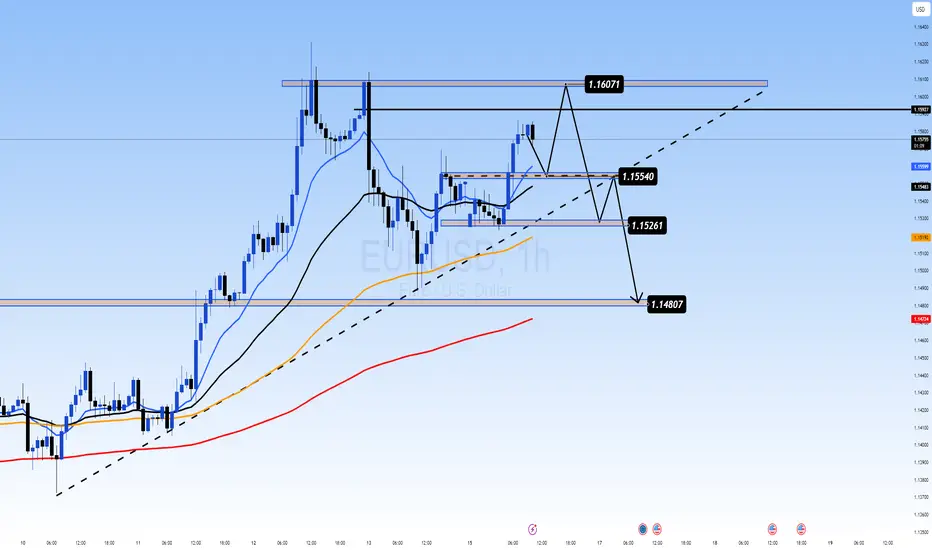
📉 Technical Outlook (H1 Chart)
Price Structure: The pair is moving within a short-term ascending channel, but current price is testing the upper boundary.
EMA Analysis (13/34/89/200): Still supports an uptrend, but flattening out — potential bearish crossover if price fails to hold.
Key Resistance:
1.1607: Major resistance and local top (double rejection zone).
Critical Support Zones:
1.15540: Minor structural support — a decisive level for intraday direction.
1.15261 & 1.14807: Unfilled FVG zones and liquidity pools that may get targeted if the price breaks lower.
🎯 Trade Setup Ideas
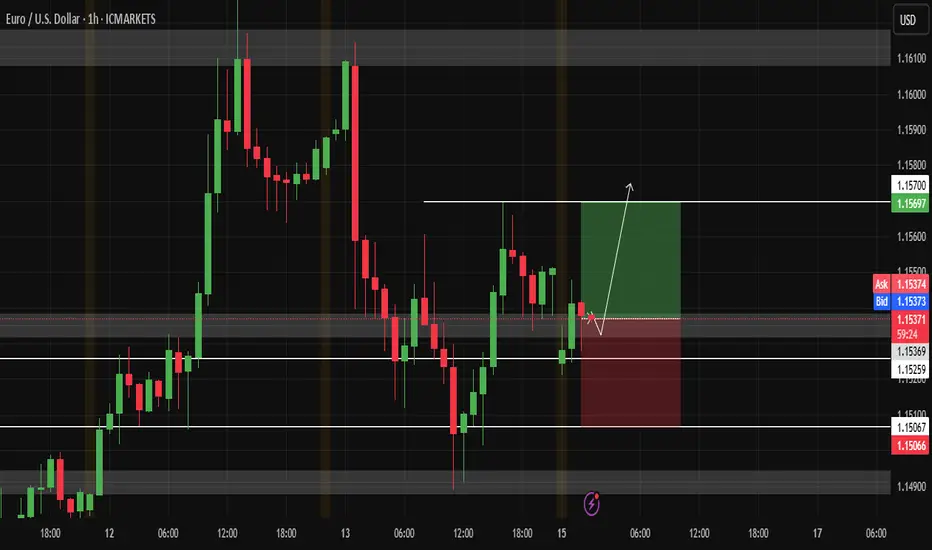
📘 Scenario A – BUY from 1.15540 support (bullish continuation)
Entry: 1.15540 (upon bullish candle confirmation or strong bounce)
Stop Loss: 1.15200
Take Profits: 1.15850 → 1.16070 → 1.16300+
✅ Ideal if European sentiment remains positive or if USD weakens across the board.
📕 Scenario B – SELL if price breaks and retests 1.15540
Entry: 1.15540 (after a breakdown + rejection retest)
Stop Loss: 1.15720
Take Profits: 1.15261 → 1.14807 → possibly 1.1450
✅ Best used if USD gains strength or EUR shows weakness after economic releases.
🧠 Market Psychology
The market is currently reactive to any shift in tone from ECB and Fed, causing price whipsaws near key zones.
Smart traders will avoid chasing breakouts and instead focus on reaction zones like 1.15540 for confirmation-based trades.
Watch for fakeouts, as institutional players may be hunting liquidity before choosing direction.
📌 Final Thoughts
EURUSD is in a sensitive zone, and 1.15540 is the intraday pivot. Holding above could trigger a push toward 1.1607 and higher. But failure to hold would likely attract sellers toward the 1.1480–1.1450 liquidity range.
🎯 Discipline is key. Avoid emotional entries. Let the market come to your level — and execute only with confirmation.
EURUSD InsightWelcome, subscribers!
Please share your personal opinions in the comments. Don’t forget to hit the booster and subscribe!
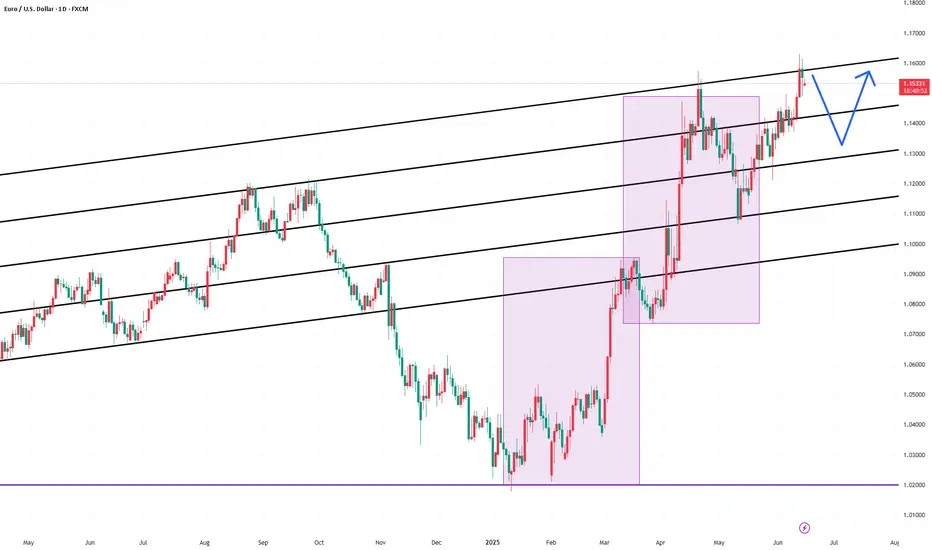
Key Points
- On the 13th, Israel highlighted the risk of a broader conflict across the Middle East following Iran's retaliatory attacks in response to Israeli preemptive strikes on Iran’s nuclear facilities and key military targets.
- The Bank of Japan (BOJ) is expected to announce a plan to slow the pace of government bond purchase reductions at its upcoming monetary policy meeting.
- Political risk in the U.S. has intensified as protests condemning the Trump administration have erupted across the country. Combined with tax-related issues, the "Sell USA" sentiment is gaining momentum.
Key Economic Events This Week
+ June 17: BOJ interest rate decision, U.S. May retail sales
+ June 18: U.K. May Consumer Price Index (CPI), Eurozone May CPI, FOMC meeting outcome
+ June 19: BOE interest rate decision
EURUSD Chart Analysis
The recent rally has extended up to the 1.16000 resistance level, which marks the trend high. It currently appears to be pulling back due to resistance at this level, and there's a strong possibility of a short-term decline toward the 1.13000 level. However, if the pair breaks above the current resistance, the short-term trend may shift bullish, potentially targeting the 1.17500 level. A new strategy should be established promptly to account for this scenario.
ELLIOTT WAVE EURUSD H4 update
EW Trade Set Up H4
minute wave ((ii)) is running.
the
The upside move from 1.1070a of 120525 to 1.1635a of 120625 does not seem a motive wave , so a sideways (flat) correction of the minute wave ((ii)) is more likely
key levels (area)
1.1590
1.1538
1.1366 POC
1.1169
1.1080

EUR/USD Slips — Setup or Selloff?EUR/USD kicked off the week under pressure, hovering near 1.1540 during the Asian session. The drop comes as the U.S. dollar regains strength, driven by safe-haven demand amid rising geopolitical tensions in the Middle East.
In times like these, the greenback shines — and riskier currencies like the euro naturally take a hit. If the situation escalates further, the pair could extend its decline in the near term.
But let’s flip the perspective: while some see risk, others see opportunity. This dip might just be the pullback that buyers have been waiting for — especially if the fundamentals shift or tensions ease. Timing, as always, is everything.
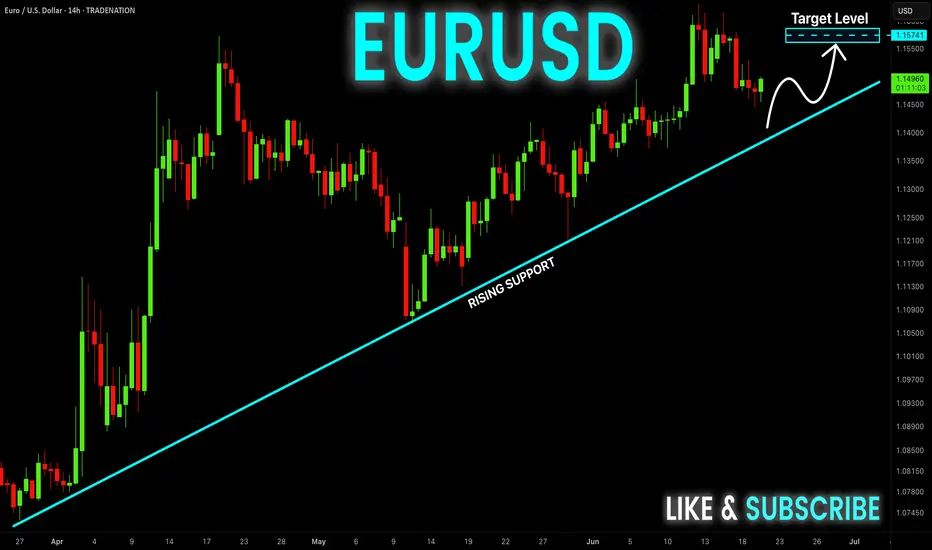
EUR-USD Will Keep Growing! Buy!
Hello,Traders!
EUR-USD is trading in an
Uptrend along the rising
Support and the pair will
Soon retest the support
From where we will be
Expecting a bullish rebound
And a bullish continuation
Buy!
Comment and subscribe to help us grow!
Check out other forecasts below too!
Disclosure: I am part of Trade Nation's Influencer program and receive a monthly fee for using their TradingView charts in my analysis.
OTEUM EXPERT CALL: EUR/USD – June Finale Setup We’re eyeing the last intramonth swing of June, expected to bleed into early July. Our playbook: let the market cough up one final risk-off spike on the Iran headlines 🌪️📰, then scoop up positions in the value zone (red box) for the next bullish leg 🚀.
Patience first, trigger later 🕰️🎯—wait for price to hit the sweet spot, load up, and ride the firework into summer. Stay nimble; geo-shock headlines can flip the board fast ⚠️.
#EURUSD #Intramonth #RiskOff #ValueHunt #OTEUM

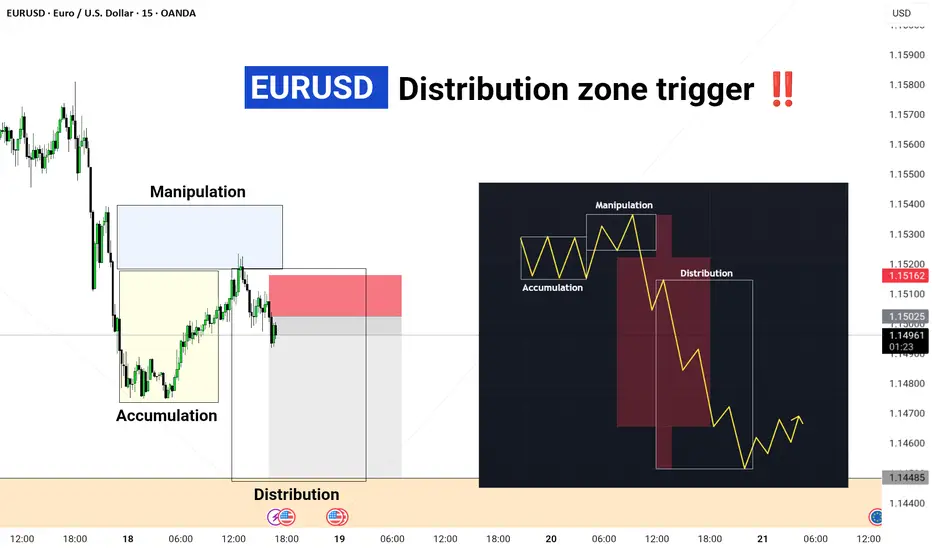
Distribution Zone Triggered⏰ Timeframe: 15-Minute (M15)
💱 Pair: EUR/USD
📍 Event: Distribution Zone Triggered ‼️
🔍 Market Structure Breakdown: 1️⃣ Accumulation Phase 🟨
📌 Smart money builds long positions
📌 Stops hunted below support
2️⃣ Manipulation Phase 🟦
📌 Liquidity grab above resistance
📌 Trap set for retail buyers
3️⃣ Distribution Phase 🟥
📌 Entry for institutional sellers
📌 Shift in order flow to bearish bias
📊 What’s next?
🔻 Price likely heading to lower demand zones
🔄 Expecting continuation move post-distribution
🧠 Powered by Smart Money Concepts + Wyckoff Logic
🎯 Trader's Tip: Always wait for confirmation inside distribution to avoid false entries!
#EURUSD #DistributionZone #SmartMoney #WyckoffLogic #LiquidityGrab #SMCTrading
EURUSD SHORT FORECAST Q2 W25 D16 Y25EURUSD SHORT FORECAST Q2 W25 D16 Y25
Professional Risk Managers👋
Welcome back to another FRGNT chart update📈
Diving into some Forex setups using predominantly higher time frame order blocks alongside confirmation breaks of structure.
Let’s see what price action is telling us today!
💡Here are some trade confluences📝
✅Weekly order block
✅15' order block
✅1 hour order block
✅Tokyo ranges to be filled
🔑 Remember, to participate in trading comes always with a degree of risk, therefore as professional risk managers it remains vital that we stick to our risk management plan as well as our trading strategies.
📈The rest, we leave to the balance of probabilities.
💡Fail to plan. Plan to fail.
🏆It has always been that simple.
❤️Good luck with your trading journey, I shall see you at the very top.
🎯Trade consistent, FRGNT X
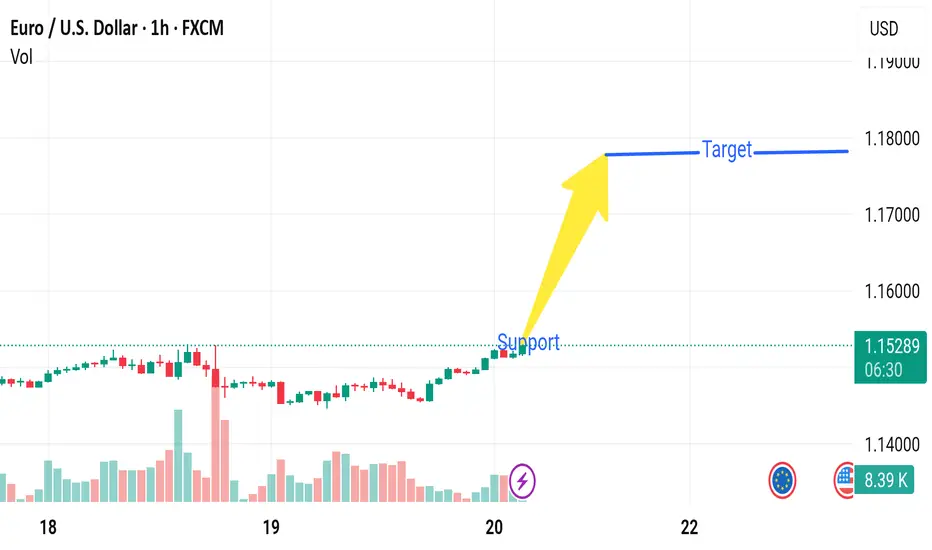
Market next move 🟥 Disrupted Analysis: Bearish Divergence on EUR/USD (1H)
Weak Support Zone:
The price labeled as "Support" was never a well-tested zone. It appears to be a minor structure, and the bounce lacks strong confirmation or significant volume.
Volume Decline During Rise:
The recent upward candles show shrinking volume, a sign that the buying momentum is weakening, not strengthening. Bulls are losing energy.
Potential Double Top Formation:
If price action near current levels stalls, a double top could form, which is a classic bearish reversal pattern. Watch for rejection below 1.1550.
Bearish Target Zone (if reversal begins):
First target: 1.1450 (minor support)
Break below that opens 1.1370 zone (volume support area)
---
📉 Disrupted Price Path (Opposing the Yellow Arrow)
Rejection
↓
┌─────────┐
│ ▼
│ Pullback to "Support"
▼ │
Breakdown │
▼ │
Target Zone ▼
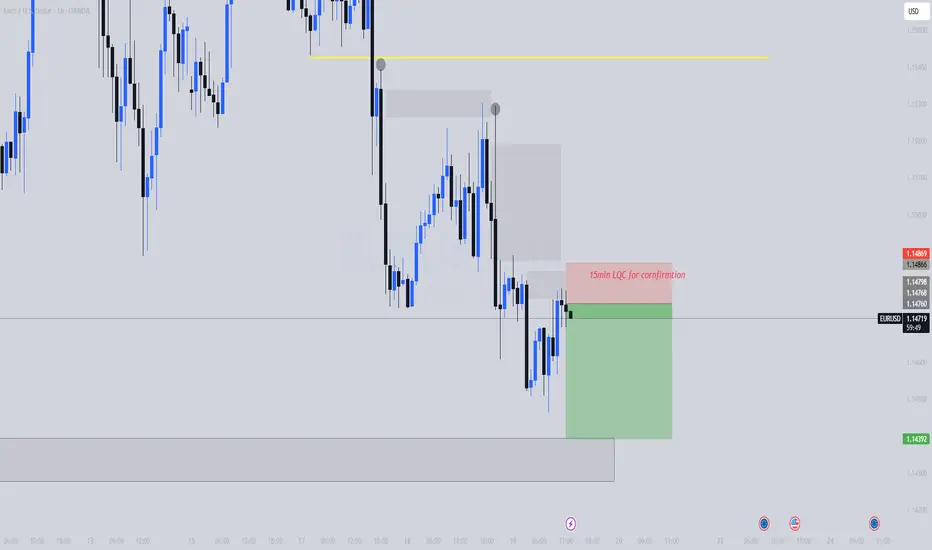
EUR?USD correctional sellsAfter anticipating the E/U buys with our previous trade market went against us after collecting Liquidity and we are currently looking for seller into our Point of interest on the qhr timeframe... trade is a bit more riskier bcoz of mininum cornfirmation given
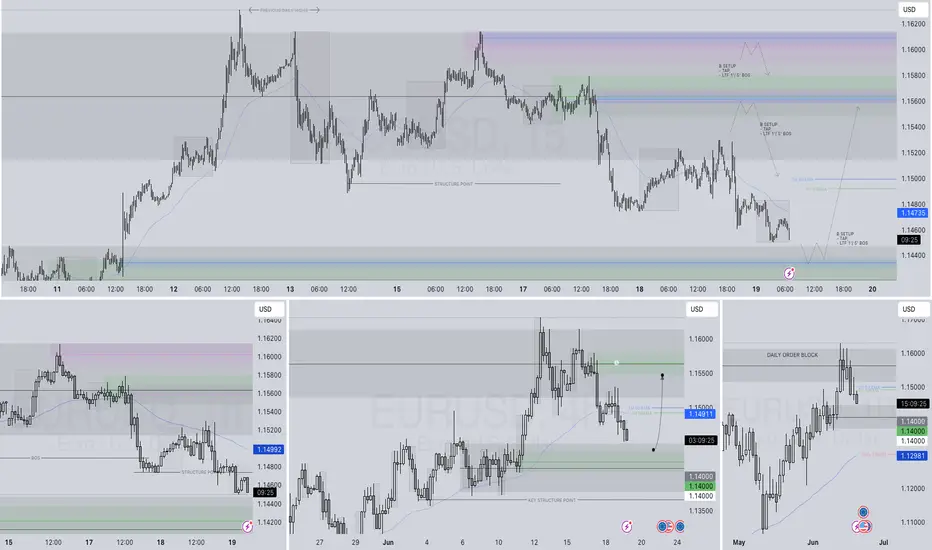
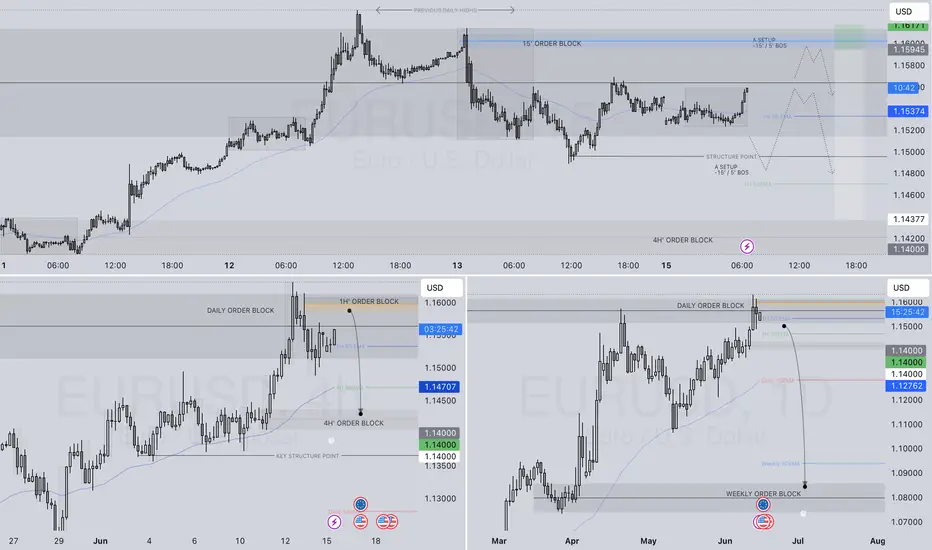
EURUSD SHORT & LONG FORECAST Q2 W25 D19 Y25EURUSD SHORT & LONG FORECAST Q2 W25 D19 Y25
Professional Risk Managers👋
Welcome back to another FRGNT chart update📈
Diving into some Forex setups using predominantly higher time frame order blocks alongside confirmation breaks of structure.
Let’s see what price action is telling us today!
💡Here are some trade confluences📝
✅Weekly order block rejection
✅15' order block
✅4 hour order block identified
✅Daily Order block identified
🔑 Remember, to participate in trading comes always with a degree of risk, therefore as professional risk managers it remains vital that we stick to our risk management plan as well as our trading strategies.
📈The rest, we leave to the balance of probabilities.
💡Fail to plan. Plan to fail.
🏆It has always been that simple.
❤️Good luck with your trading journey, I shall see you at the very top.
🎯Trade consistent, FRGNT X