Forecast USDJPY This is not financial advice. Educational purpose only."
I am preparing to take a short position on USDJPY starting next week, in alignment with the upcoming rollover of futures contracts. My analysis is based on a combination of technical, macroeconomic, behavioral, and institutional elements.
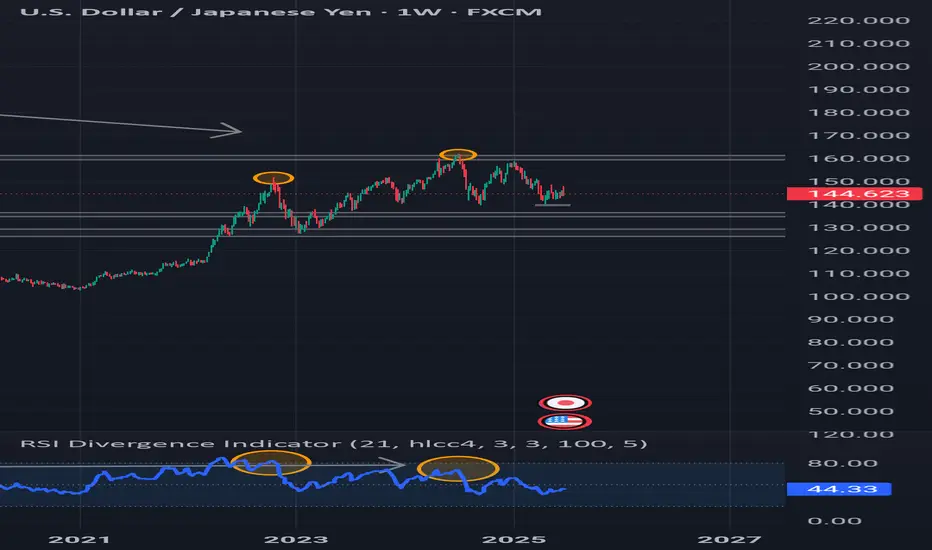
From a technical perspective, a clear bearish reversal divergence is visible on the weekly chart using the 21-period RSI based on HLCC/4. While the price is making higher highs, momentum is weakening, indicating a loss of bullish strength. This setup is reinforced by a long-term continuation divergence that has been forming since the major tops of 1971, suggesting a possible terminal phase in the current cycle.
COT data supports this view. Large speculators have been steadily reducing their long positions on USDJPY over recent weeks. More significantly, these same institutional players have begun accumulating long positions on Japanese yen futures (6J), often a precursor to a monetary rotation. The upcoming rollover of futures contracts next week could trigger a more pronounced shift in institutiona positioning.
Macroeconomic data from the United States also confirms a slowdown. Core PCE came in at 0.1%, below expectations. Nonfarm Payrolls underperformed, and the ISM Services Index dropped below 50, signaling contraction. In contrast, Japan maintains stable inflation around 2.3%, which gives the Bank of Japan room to begin policy normalization. The yield differential is starting to narrow, a historically bearish factor for USDJPY.
Finally, market sentiment remains skewed. Retail traders are still heavily positioned long on USDJPY. Such imbalances, where retail crowds are long and institutional players are exiting, often precede sharp reversals.
If the expected institutional reallocation materializes after the futures rollover, I will enter a short position. Technical, fundamental, and cyclical factors are now fully aligned.
"This is a personal market view. Always do your own research before making trading decisions."
USDJPY trade ideas
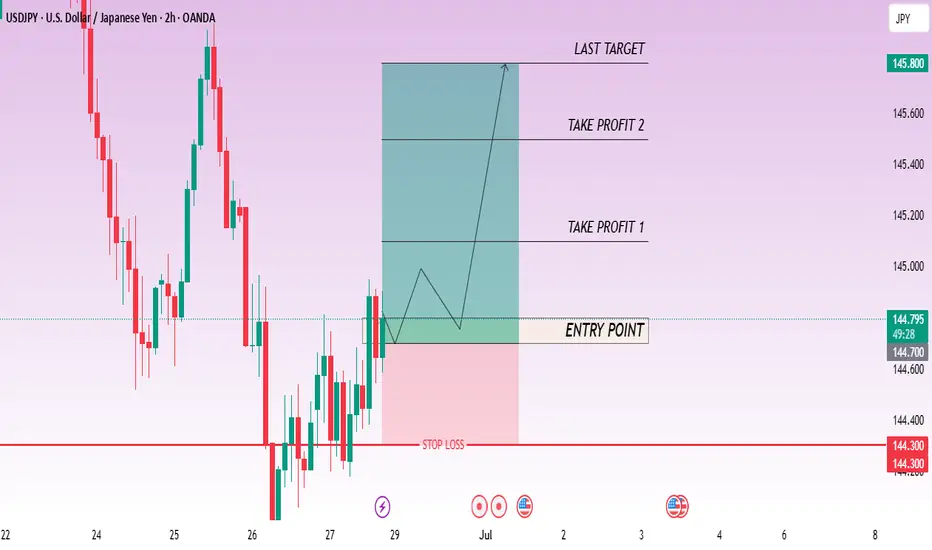
CHECK USDJPY SIGNAL READ CAPTAINbuy Setup)
Entry Zone: Around 144.800\144.700
Stop Loss: 144.300
Take Profits:
TP1: ~145.100
TP2: ~145.500
Final Target: 145.800
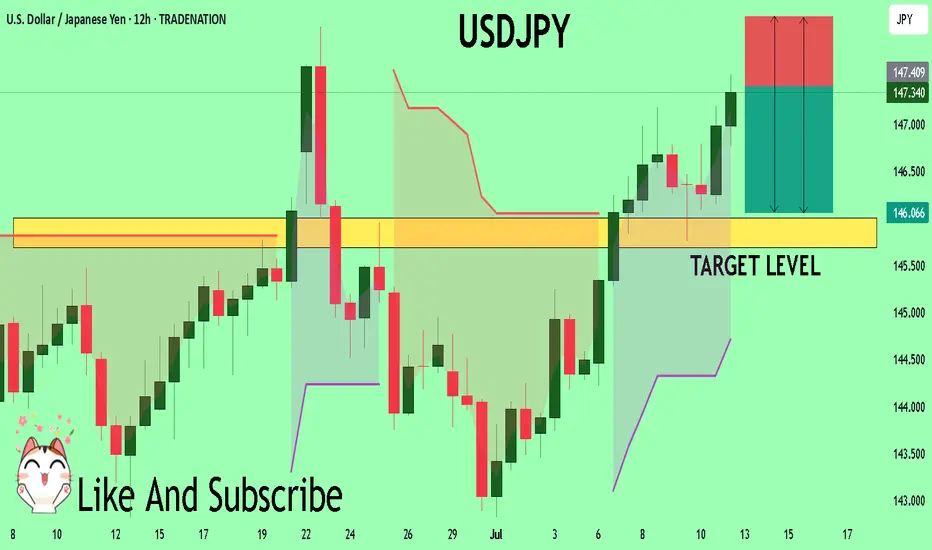
USDJPY The Target Is DOWN! SELL!
My dear friends,
Please, find my technical outlook for USDJPY below:
The price is coiling around a solid key level - 147.41
Bias - Bearish
Technical Indicators: Pivot Points High anticipates a potential price reversal.
Super trend shows a clear sell, giving a perfect indicators' convergence.
Goal - 146.00
Safe Stop Loss - 148.14
About Used Indicators:
The pivot point itself is simply the average of the high, low and closing prices from the previous trading day.
Disclosure: I am part of Trade Nation's Influencer program and receive a monthly fee for using their TradingView charts in my analysis.
———————————
WISH YOU ALL LUCK
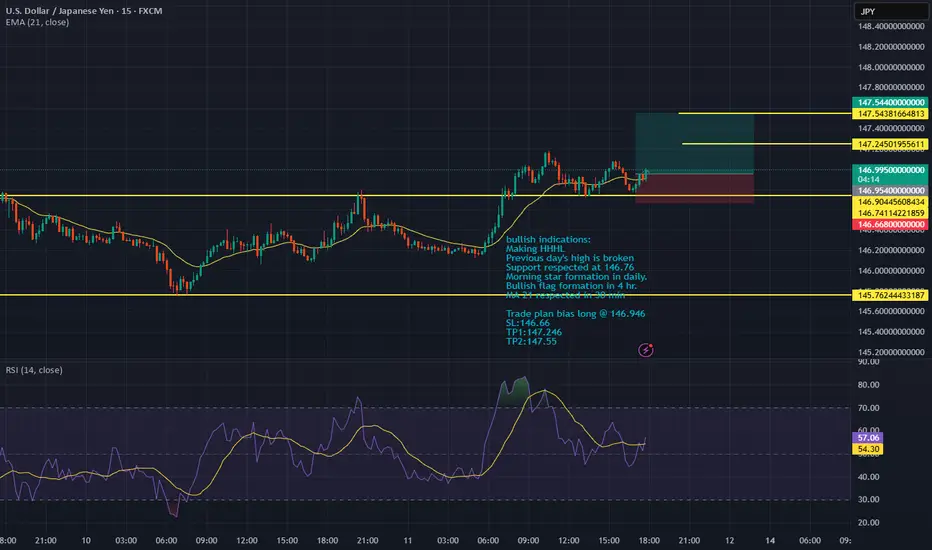
USDJPY-bias long bullish indications:
Making HHHL
Previous day's high is broken
Support respected at 146.76
Morning star formation in daily.
Bullish flag formation in 4 hr.
MA 21 respected in 30 min
Trade plan bias long @ 146.946
SL:146.66
TP1:147.246
TP2:147.55
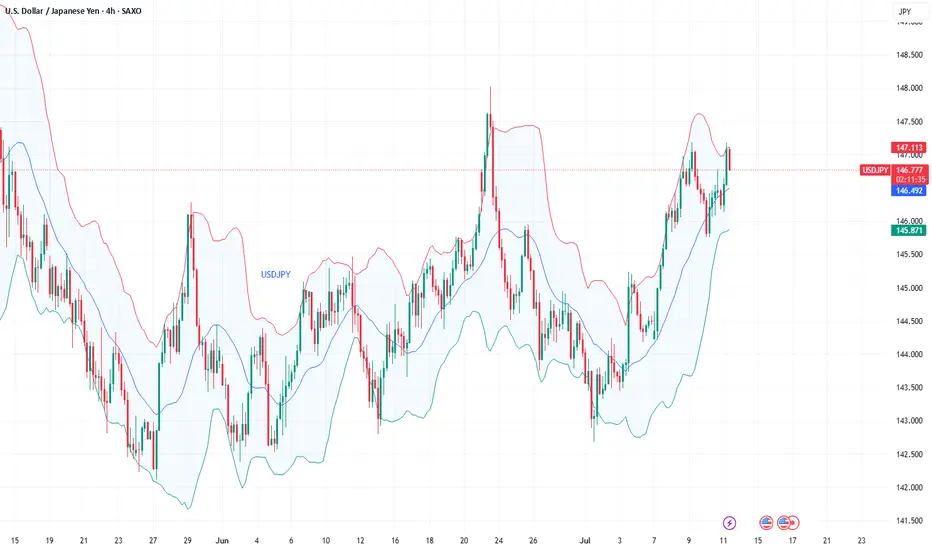
Fundamental Market Analysis for July 11, 2025 USDJPYThe dollar is holding steady at 146.500 against the yen: another rise in US yields and stable demand for safe US assets following comments from the Fed are fueling appetite for the USD, while demand for the JPY remains sluggish.
The tariff front exacerbates the imbalance: the White House has already imposed 25% tariffs on Japanese goods, and new ideas for “umbrella” tariffs are heightening fears of a trade war, forcing investors to flow into financing currencies. Reuters notes that the yen weakened to 146.400, recording a weekly decline of more than 1%.
At the same time, the Bank of Japan is not yet ready for aggressive tightening: a decline in inflation to 1.8% y/y and weak real wage dynamics make it difficult to raise rates above 0.5%. The divergence in monetary policy and expectations for Japanese macro data (machine tool orders, industrial production) until July 14 form the fundamental basis for the pair's growth to 147.500 and above, while the risks of correction are limited to the 145.900 zone.
Trading recommendation: BUY 146.500, SL 145.900, TP 147.500
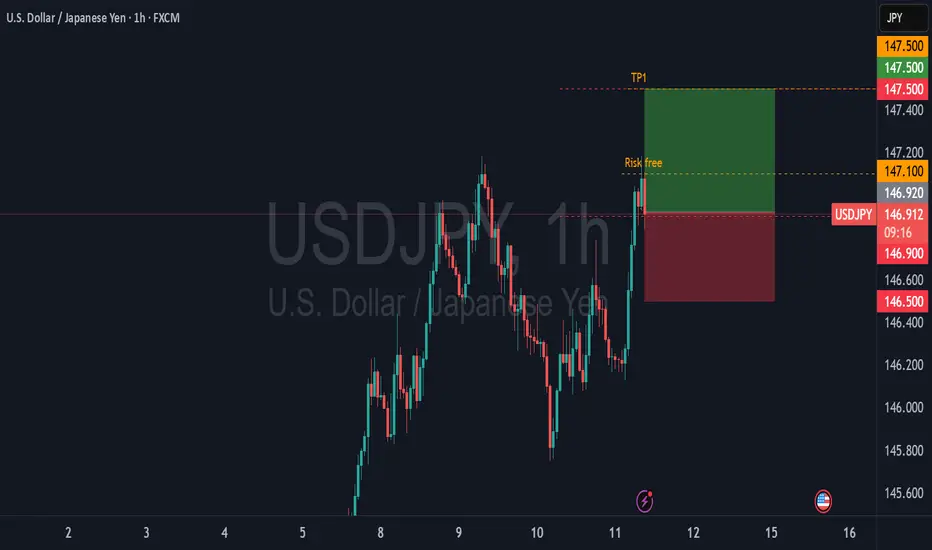
Let’s enter this position with **confidence and discipline**.✅ **The price has cleanly pulled back to 146.900**, which is exactly what we were waiting for.
We are in the **right zone, right signal, right timing.**
Let’s go. 💪📈
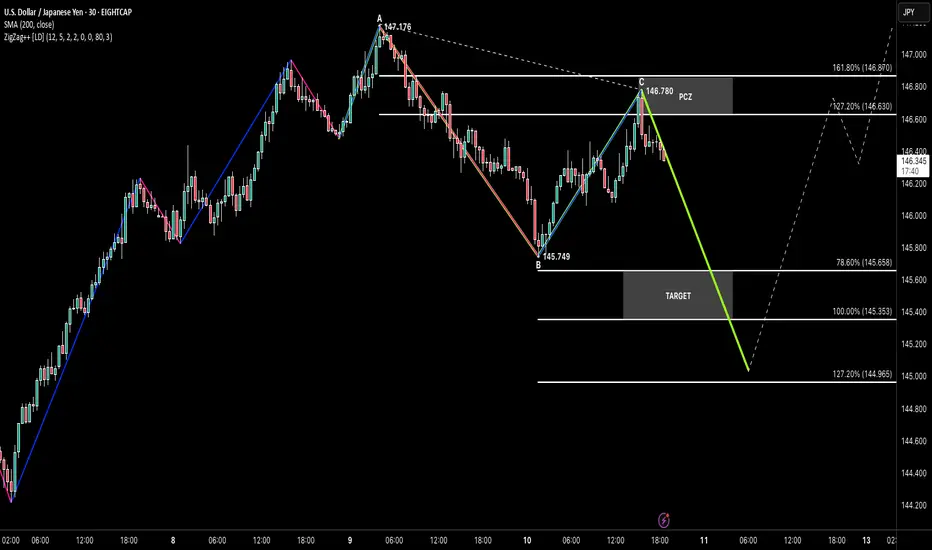
ABCHello traders! 👋
I hope you’re having a fantastic trading week so far. Let’s take a look at the USDJPY setup unfolding right now — and it’s all about classic symmetry.
📌 Setup Breakdown
We’re seeing a textbook ABC Bearish Continuation:
🔹 AB: Sharp move down
🔹 BC: Clean correction back into structure
🔹 CD (Projected): Symmetrical to AB, aiming toward the target zone
Price just tapped into the PCZ (Potential Completion Zone) around the 127.2%–161.8% fib projections — showing early rejection and setting up a potential move lower.
🎯 Target Zone
First Objective: 100% projection (~145.35)
Extended Target: 127.2% (~144.96)
With structure clear and risk above C, the symmetry is doing all the talking.
🧠 Key Factors
✅ Classic ABC symmetry
✅ Strong reaction at PCZ
✅ Risk well-defined
✅ Trend continuation potential
No guesswork — just measured movement within structure.
💬 Final Thoughts
If this plays out, it would be a clean continuation play in line with the overall flow. As always, let the chart guide you — not emotion.
📚 Pattern → Zone → Reaction → Follow-through
Wishing everyone smooth trades ahead. Let’s keep it simple and professional.
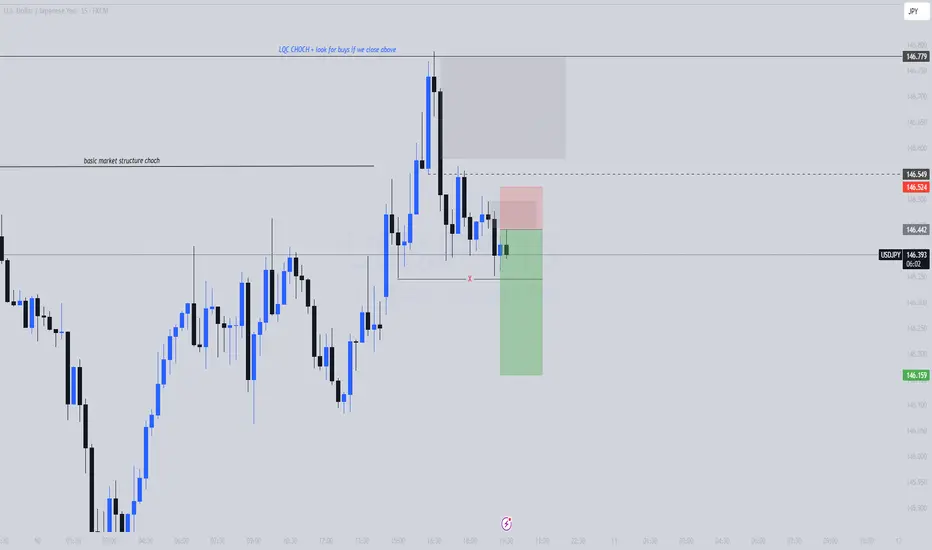
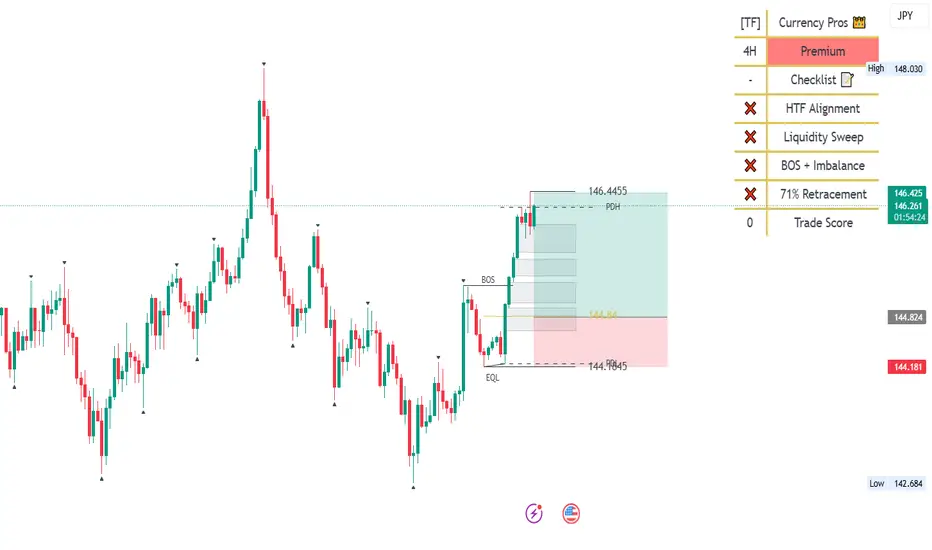
USDJPY| 15| Liquidity Grab + Choch reaction Price formed a basic CHoCH after sweeping sell-side liquidity and creating a temporary low. A short setup was taken from a lower timeframe supply zone, aligned with bearish order flow and rejection at imbalance.
🔹 Sell-side Liquidity Sweep
🔹 CHoCH Confirmation
🔹 Rejection from Supply
🔹 Expecting bearish continuation if price holds below 146.52
Invalidation: If price closes above the LQ CHoCH zone, I’ll shift bias to longs. Until then, I’m holding the short narrative.
#SMC #USDJPY #OrderFlow #LiquiditySweep #FXTradingClub #PriceAction #CHoCH

USD/JPY: A High-Clarity Setup in a Coiling MarketFor weeks, the market has been choppy and difficult, grinding accounts down with indecisive price action. Many traders are getting stomped by the noise. This post is designed to cut through that chaos with a single, high-clarity trade idea based on a powerful fundamental story and a clean technical picture.
The focus is on the USD/JPY, where a major catalyst (US CPI) is about to meet a tightly coiling chart pattern.
The Fundamental Why 📰
Our entire thesis is now supported by both qualitative and quantitative analysis. The core driver is the profound monetary policy divergence between the U.S. and Japan, which manifests as a powerful Interest Rate Differential.
The Core Driver: The Bank of Japan maintains its ultra-easy policy while the Fed is in a "hawkish hold," creating a significant interest rate gap of over 400 basis points that fuels the carry trade.
Quantitative Validation: Our new analysis confirms this is the primary driver. We found a strong positive correlation of 0.54 between the USD/JPY exchange rate and this Interest Rate Differential. This provides a robust, data-backed reason for our long bias.
This creates a fundamental chasm between the two currencies, representing a compelling long-term tailwind for USD/JPY.
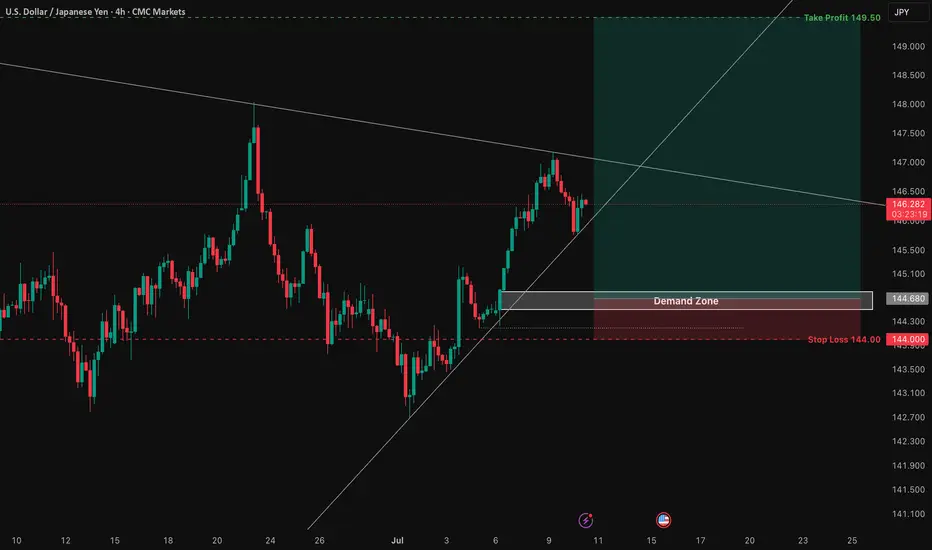
The Technical Picture 📊
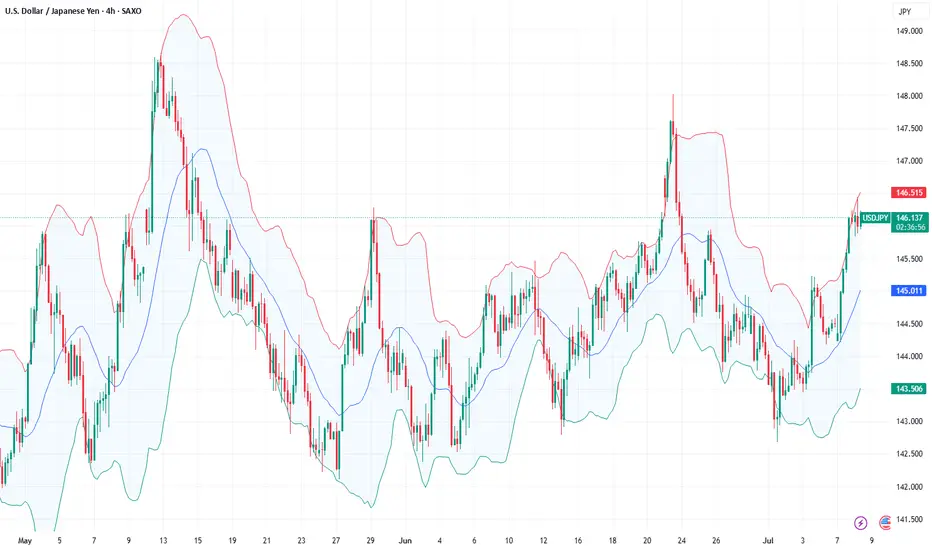
The 4-hour chart perfectly visualizes the market's current state.
The Coiled Spring: Price is consolidating in a tight symmetrical triangle. This represents a balance between buyers and sellers and a build-up of energy. A breakout is imminent.
The Demand Zone: Our entry is not random. We are targeting a dip into the key demand zone between 144.50 - 144.80. This area is significant because it aligns with the 50-day moving average, a level that offers a more favorable risk/reward ratio.
The Underlying Conflict: It's important to note the long-term bearish "Death Cross" on the daily chart (50 MA below 200 MA). Our thesis is that the immense fundamental pressure—now validated by our quantitative study—will be strong enough to overwhelm this lagging technical signal.
The Plan & Setup 🎯
This is a conditional setup, and our analysis confirms the proposed levels are well-reasoned. We are waiting for the market to confirm our thesis before entering.
The Setup: 📉 Long (Buy) USD/JPY. We are looking for price to dip into our demand zone and then break out of the triangle to the upside.
Entry Zone: 👉 144.50 - 144.80. Watch for a 4H candle to show support in this area.
Stop Loss: ⛔️ 144.00. A break below this level would signal that the immediate bullish structure has failed and invalidates the trade thesis.
Take Profit: 🎯 149.50. This target is strategically set just below the major 150.00 psychological handle, a level where institutional orders are likely clustered.
This setup provides a clear, logical plan to engage with the market's next big move. It's all signal, no noise. Trade smart, and manage your risk.
Quick Breakdown For USDJPY AND USDCADIf you are interested in joining our free community feel free to contact me!!

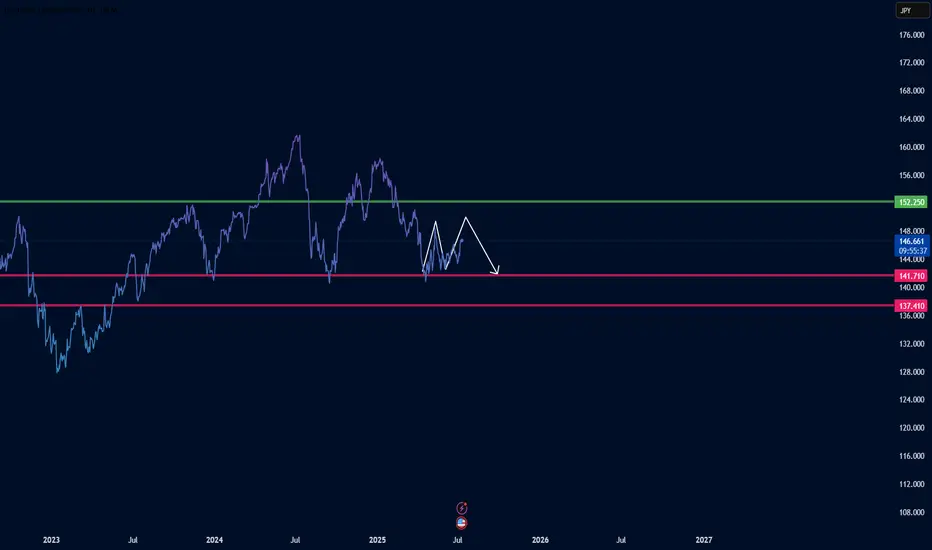
Bears On The Prowl, Key Supports In FocusAnalysis
USDJPY has faced downward pressure recently and is currently trading below a key resistance level around 152.250. This level acts as a significant barrier to upward movements, and the inability to decisively break above it reinforces our bearish outlook.
Key Observations
🔹 Dominant Bearish Pressure: Despite fluctuations, bulls (buyers) seem to be struggling to maintain higher levels, while bears (sellers) are asserting pressure.
🔹 Key Resistance: The 152.250 level serves as a strong resistance. As long as the price remains below this level, the bearish view will prevail.
🔹 Crucial Supports: The levels of 141.710 and 137.410 are acting as critical support zones for this pair. A break below either of these levels could pave the way for further declines.
🔹 Momentum Indicators: (Here, you can add details about specific indicators that confirm your bearish view. For example: "The RSI is moving towards oversold territory, suggesting continued downside momentum," or "The MACD is showing a bearish crossover, indicating potential for further weakness.")
Potential Scenarios
🔴 Primary Scenario (Bearish): As long as USDJPY remains below the 152.250 resistance, we anticipate continued downward pressure. The bears' initial target will be to test and break the 141.710 support.
🔻 Break of First Support: If the 141.710 support is broken decisively (with strong candles and significant volume), this would be a strong bearish signal. In this scenario, the next target for the price would be to test the lower support at 137.410. A break below this level could lead to even deeper declines.
🟢 Alternative Scenario (Bullish): Should USDJPY manage to decisively break above the 152.250 resistance and sustain itself above it, our bearish view would be temporarily invalidated, and we might see a corrective upward movement. However, until this occurs, the focus remains on the bearish scenario.
Fundamental Considerations
🔘 US-Japan Interest Rate Differential: The significant interest rate differential between the US Federal Reserve and the Bank of Japan continues to be a major factor. Any shift in market expectations regarding the monetary policies of these two central banks could impact USDJPY.
🔘 Bank of Japan (BoJ) Policy: Any signs of a change in the BoJ's ultra-loose monetary policy (e.g., an interest rate hike or a reduction in asset purchases) could strengthen the JPY and put downward pressure on USDJPY.
🔘 US Economic Data: Upcoming US economic data, particularly inflation figures and statements from Federal Reserve officials, could influence the dollar's value and, consequently, USDJPY.
🍀HAVE PROFITABLE TRADES🍻
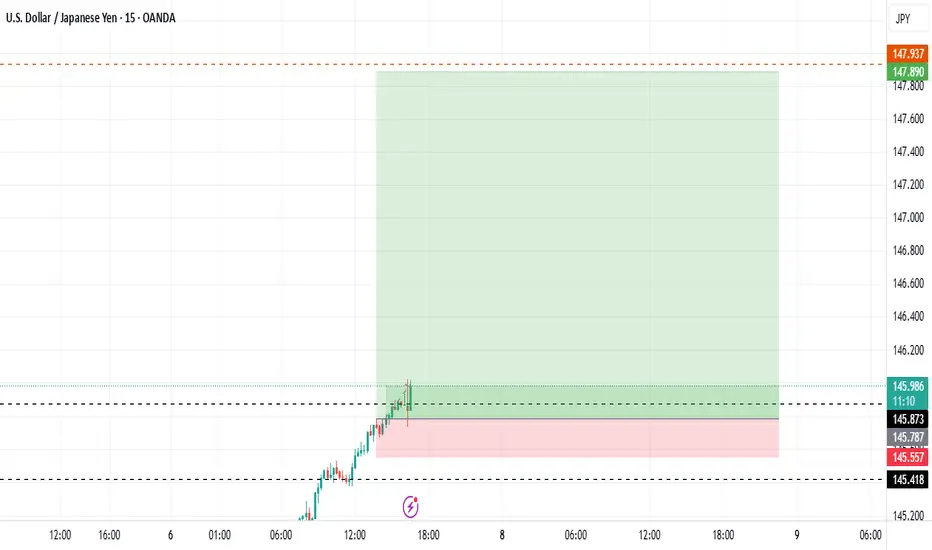
USD/JPY Long Trade SetupBuy dips - 146.50-146.60
Stop Loss -145.80 - Below retest zone; invalidates breakout.
TP-1 148.80 - Scale 50 % Pattern target / June high cluster.
TP-2 150.00 - Round-number magnet, option strikes.
Rationale
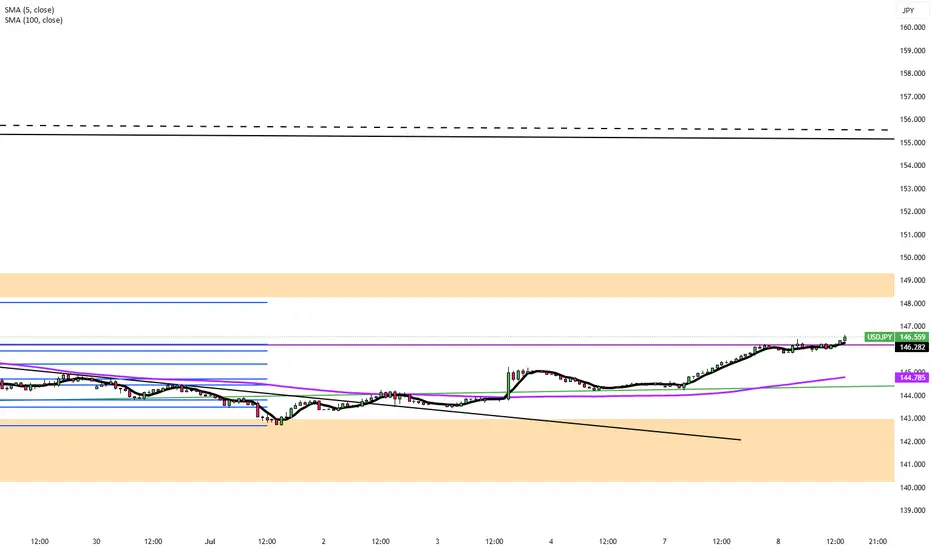
The dollar-yen cross has snapped out of its early-summer drift and vaulted back above the 100-day simple moving average for the first time since February, reaching ¥147.19 on 9 July – a two-and-a-half-week high – as the greenback rides an upswing in U.S. yields and tariff-driven inflation fears. The technical breakout puts the familiar 148.00/150.00 band – the June swing high and the psychological round number – back in play for trend-followers over the next several sessions.
Policy divergence as wide as ever
Federal Reserve – higher-for-longer: Minutes from the June FOMC showed staff pushing inflation projections higher and flagging “upside risks” should tariff pass-through accelerate, reinforcing the market’s view that rate cuts will be pushed into Q4 at the earliest. Five straight sessions of rising Treasury yields have followed, lifting the 10-year to 4.45 % and widening the U.S.–Japan real-rate gap.
Bank of Japan – stuck on hold: Former BOJ board member Makoto Sakurai told Reuters the central bank will “wait at least until March 2026” before considering another hike, as Trump’s 25 % tariff on Japanese goods (effective 1 August) clouds the export outlook and will likely force the BOJ to cut its growth forecast at the 31 July Outlook Report. With headline CPI still only just above target and real wages contracting.
Yen Falls After Trump's 25% Tariff on JapanThe Japanese yen weakened beyond 146 per dollar on Tuesday, hitting a two-week low after President Trump confirmed a 25% tariff on Japanese imports starting August 1, lower than the earlier 35% threat but still above the standard 10%. Japan’s Prime Minister Ishiba pledged to keep negotiating for a favorable outcome. Although Japan’s May current account surplus came in stronger than expected, disappointing wage growth limited hopes for further Bank of Japan rate hikes, adding pressure on the yen.
Key resistance is at 146.20; major support at 144.85.
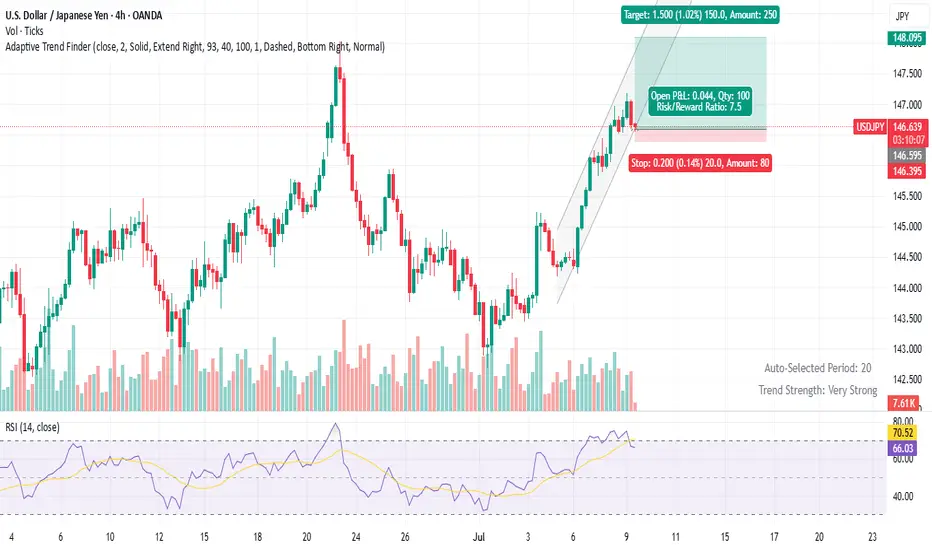
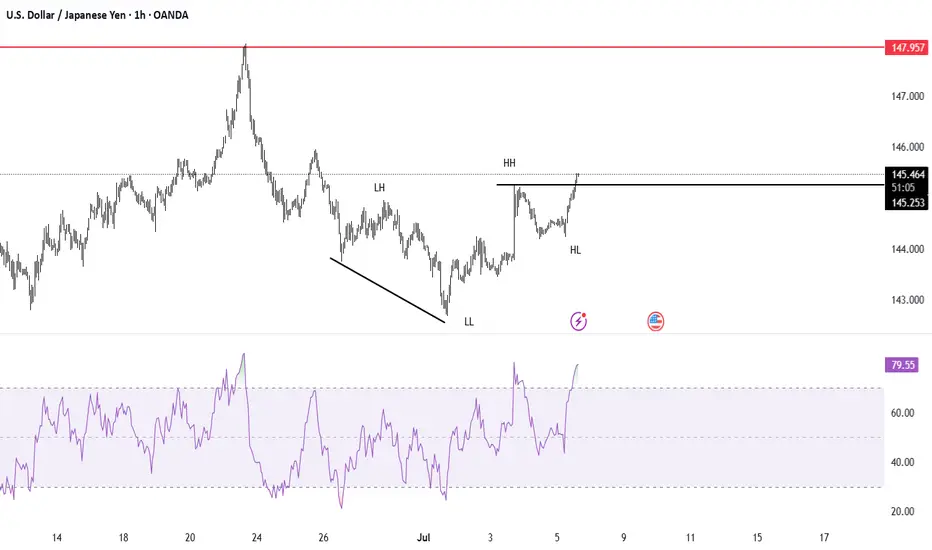
USDJPY Long Buy with the trend on HL with the mentioned entry points.USDJPY printing HH & HL according to Dow, we placed a buy limit on the FIB0.71 level.
Fundamental Market Analysis for July 8, 2025 USDJPYThe yen remains under pressure from trade frictions. President Donald Trump has confirmed 25 percent tariffs on Japanese goods effective 1 August, fuelling U.S.-inflation expectations and reducing the odds of a near-term Fed rate cut. Ten-year Treasury yields have climbed above 4.45 percent, while the spread over equivalent JGBs hovers near 380 basis points—supportive for the dollar.
Japan’s domestic backdrop offers little relief. Nominal wage growth has slowed for a third straight month, and real household incomes have posted their deepest decline in twenty months. The weak earnings momentum complicates the Bank of Japan’s exit strategy and keeps ultra-loose policy firmly in place, encouraging further capital outflows from the yen.
Against this backdrop, USD/JPY is consolidating above its 100-day moving average around 146.40–146.50. Absent a sudden flight to safe-haven assets, the pair could break 147.00 in the coming sessions, while the 145.950–146.000 zone is widely viewed as an attractive area to add to long positions.
Trading recommendation: BUY 146.250, SL 145.950, TP 147.000
USDJPY InsightHello to all our subscribers!
Please feel free to share your personal opinions in the comments.
Don't forget to like and subscribe!
Key Points
- U.S. President Trump has officially announced that he will sign an executive order extending the reciprocal tariff suspension deadline to August 1st.
- Through a post on Truth Social, President Trump revealed that he had first sent tariff letters to allies South Korea and Japan, addressed directly to their heads of state, stating that a 25% tariff would be imposed on both countries starting August 1st.
- Hajime Takata, a member of Japan’s Monetary Policy Board, hinted at the possibility of additional rate hikes, stating: “If solid capital investment, wage increases, and the sustainability of price pass-through can be confirmed, we will need to shift gears one step at a time.”
This Week's Major Economic Events
+ July 8: Reserve Bank of Australia (RBA) Interest Rate Decision
+ July 9: Release of FOMC Meeting Minutes
+ July 10: Germany’s June Consumer Price Index (CPI)
+ July 11: UK May GDP Report
USDJPY Chart Analysis
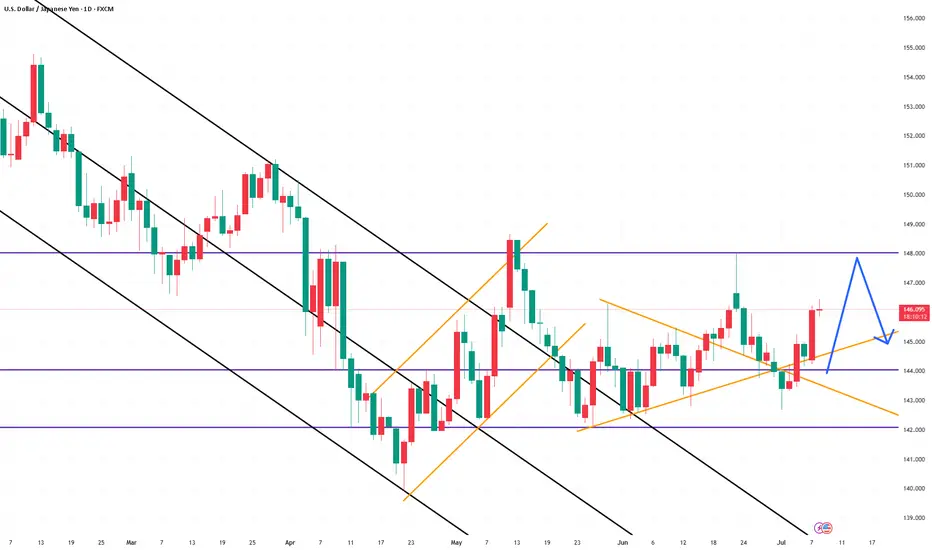
The pair rebounded near the 142 level, showing upward momentum. This appears to reflect the impact of Trump’s announcement of high tariffs on Japan.
If negotiations proceed, the upward trend may stall. In such a scenario, a potential high around 148 is likely.
However, if the 148 level is breached, there could be an additional rally toward the 151 level.
USDJPY 15M KEEP THE RIDE GOING BULL TIME :))Its good area to keep the ride going
Its very good R/R TRADE (AS USUAL)
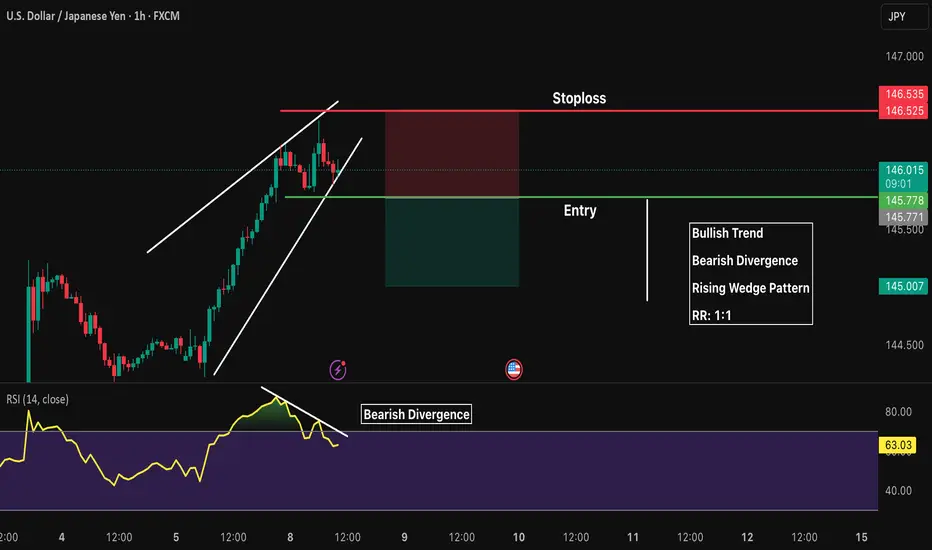
dollar bullish against all currenciesReversal of pattern
Rsi divergernce
2 bull point
RRR 1:2
breakeven after 1:1
Risk 1, 2%
USDJPY FREE STRATEGYHere is a brief strategy on how to successfully trade usdjpy and become profitable.

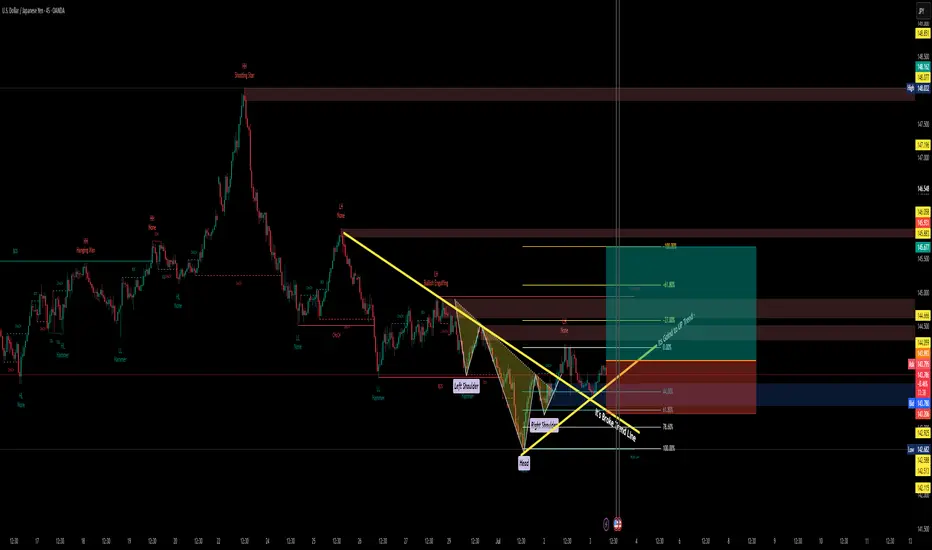
USDJPY1. Inverted Head and Shoulders Pattern
This is a classic bullish reversal pattern.
You've marked the left shoulder, head, and right shoulder, and the neckline is broken to the upside.
Breakout confirms trend reversal from bearish to bullish.
2. Break of Trendline
A long-term bearish trendline was clearly broken.
Price broke above it with momentum, showing bullish strength.
3. Fib Confluence
Entry area is around the 61.8%–78.6% Fibonacci retracement zone.
Combined with support zone = high-probability reversal area.
4. Change of Character (CHoCH)
CHoCH confirms that the market has shifted structure from lower highs/lows to potential higher highs/lows.
You can see the higher low (HL) forming already.
5. Strong Bullish Candles
The breakout move is supported by strong bullish candles, showing buying pressure.
We're entering on a confirmed bullish reversal – Inverted Head & Shoulders breakout, trendline breach, and bullish market structure shift. Fib zone confluence seals the setup. Buy-side pressure is in control.