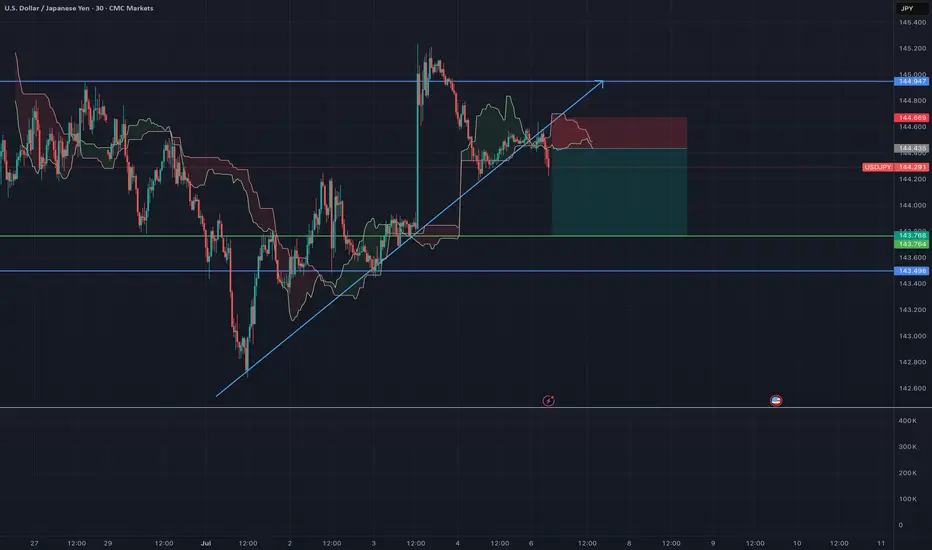
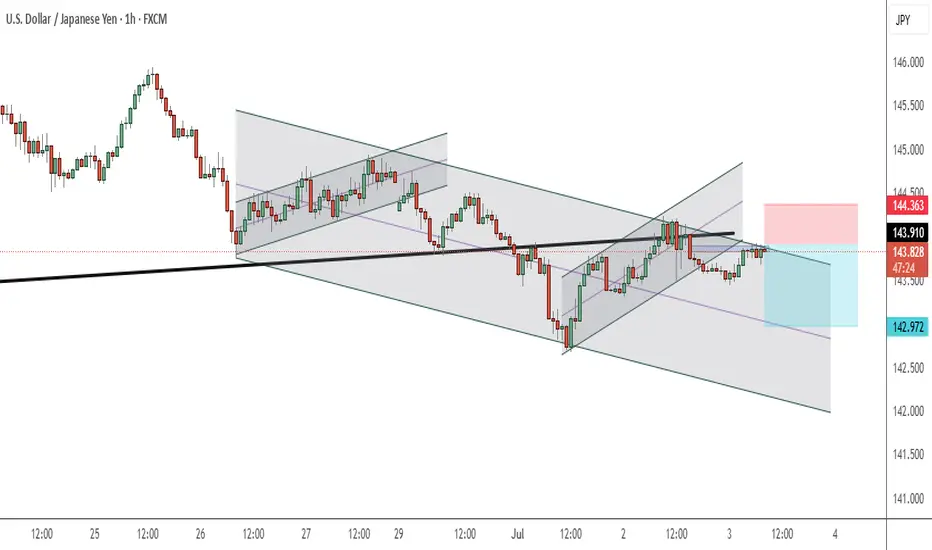
USD/JPY - Channel BreakoutThe USD/JPY pair on the M30 timeframe presents a Potential Selling Opportunity due to a recent Formation of a Breakout Pattern. This suggests a shift in momentum towards the downside and a higher likelihood of further advances in the coming hours.
Possible Short Trade:
Entry: Consider Entering A Short Position around Trendline Of The Pattern.
Entry (Sell Limit): 144.435
Stop Loss: 144.669
Take Profit: 143.768
This is Sell Limit entry and wait for pullback to enter the trade
USDJPY trade ideas
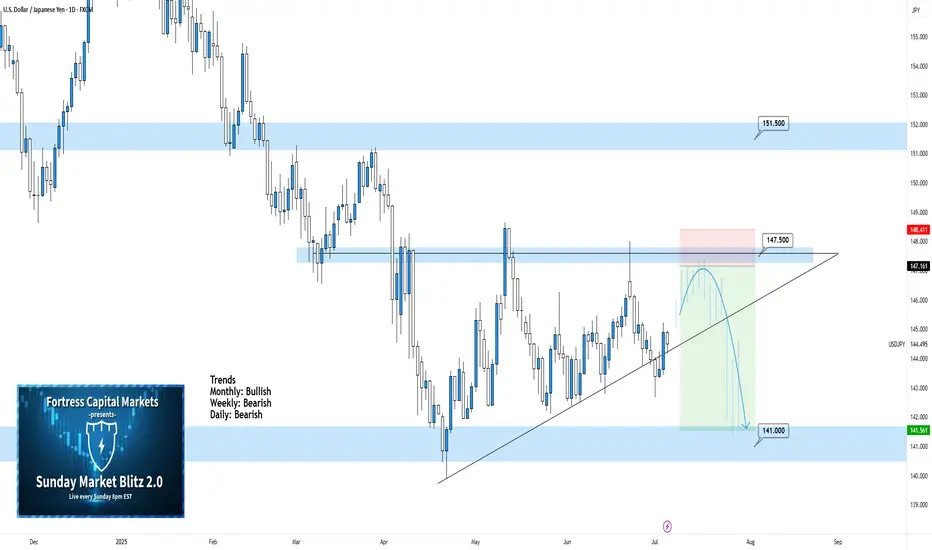
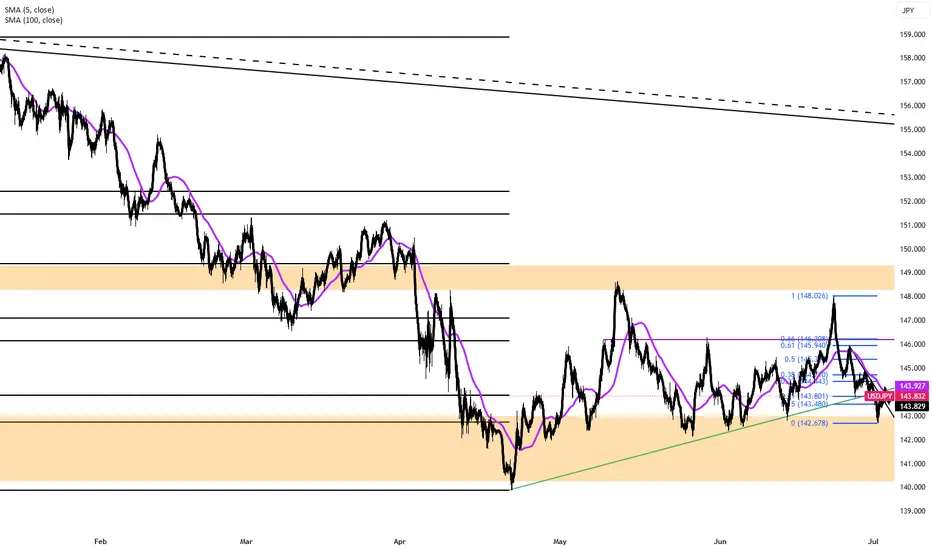
USDJPY Daily TF - July 6th, 2025USDJPY 7/6/2025
USDJPY Daily Neutral Idea
Monthly - Bullish
Weekly - Bearish
Daily - Bearish
We’re still on the daily timeframe with UJ as there is nothing worthwhile. We are clearly in some daily consolidation phase and price action has no clear direction from a swing perspective.
Bearish Continuation - For us to consider a bearish continuation, which is the most likely, we would like to see a retest of our 147.500 zone followed by strong bearish rejection. If we can spot rejection around the 147.500 zone it could present some decent short positions. I’d be looking to target lower toward key support levels.
Aside from this potential setup i’m not looking at any other scenarios for UJ.
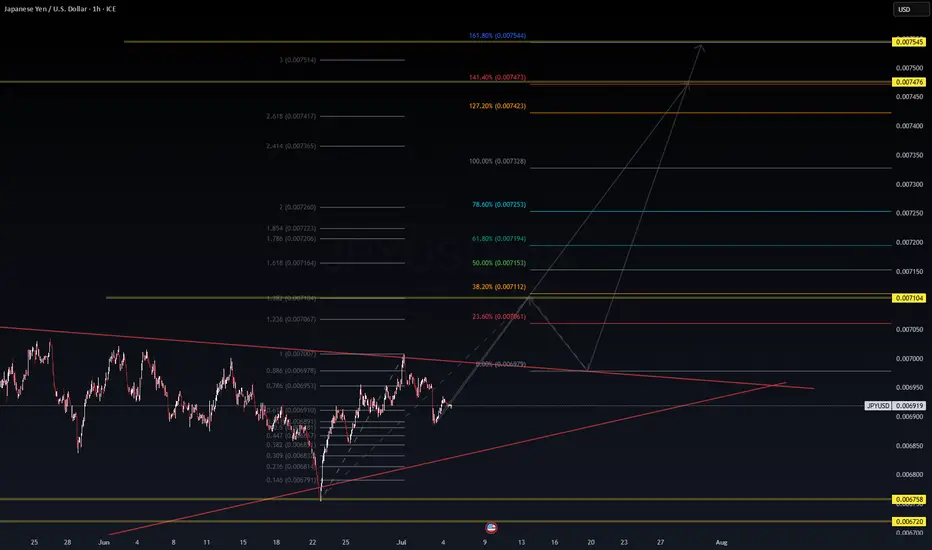
JPY/USD – Compression Breakout Toward Fib Extension Zone | High-📈 JPY/USD – Compression Breakout Toward Fib Extension Zone | High-Conviction DSS Setup
🧠 WaverVanir DSS | Fib x Volume x Structure Alignment
🔹 Timeframe: 1H
🔹 Instrument: JPY/USD
🔹 As of: July 6, 2025
🔹 Bias: Bullish Breakout
🔹 Conviction: High-Probability Reversal-Continuation Hybrid
🔍 🧠 Thesis Summary
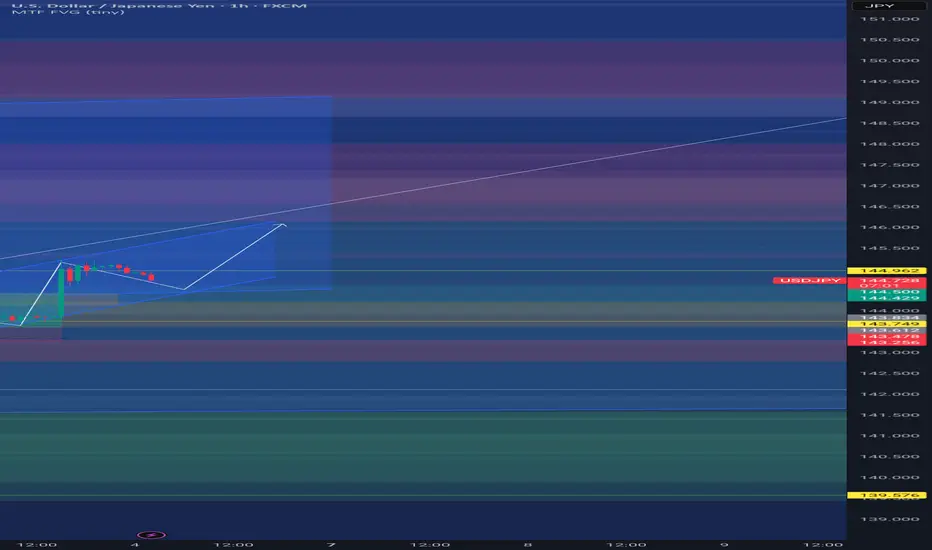
JPY/USD has coiled into a symmetrical triangle following a strong internal structure shift. With price compressing against major Fib/SMC levels and anchored volume support at 0.00685–0.00690, the most probable outcome is a bullish breakout targeting the 127–161% extension levels.
🧮 📊 Probabilistic Trade Plan
Element Value
🎯 Entry Zone 0.00691–0.00693 (live)
📍 SL (Invalidation) 0.006758 (structural)
🎯 TP1 0.00715 (Fib 50%)
🎯 TP2 0.00732 (Fib 100%)
🛸 Final TP3 0.00745–0.00754 (127–161%)
📈 R/R ~1:3.5+ (conservative trail)
📊 Probability ~72% (VolanX DSS Estimate)
🔐 Confluence Stack
✅ Volume Profile: Major absorption at 0.00685–0.00690
✅ Fibonacci Expansion: Break above 1.0 targets 127–161%
✅ Structure: Break of descending triangle + higher low
✅ Macro Tailwind: BOJ policy weakness + USD resilience
✅ No Major Resistance until 0.00732–0.00745
🧠 Risk Logic
Breakdown below 0.006758 = invalidate bull thesis (structural fail)
Favor scaling out at TP1 and TP2, trail runner to TP3
If price consolidates under 0.00701, wait for re-confirmation
📍 Visuals (Chart Already Published)
📌 See attached chart for full Fib ladder and volume path tracking
🔄 Execution Note
This is a probabilistic trigger-based plan, not a fixed signal. Align entry only after confirmation of strength above 0.007007 (1.0 Fib breakout zone).
⚠️ Disclaimer
This is a strategic framework powered by WaverVanir’s VolanX DSS. Manage risk accordingly.
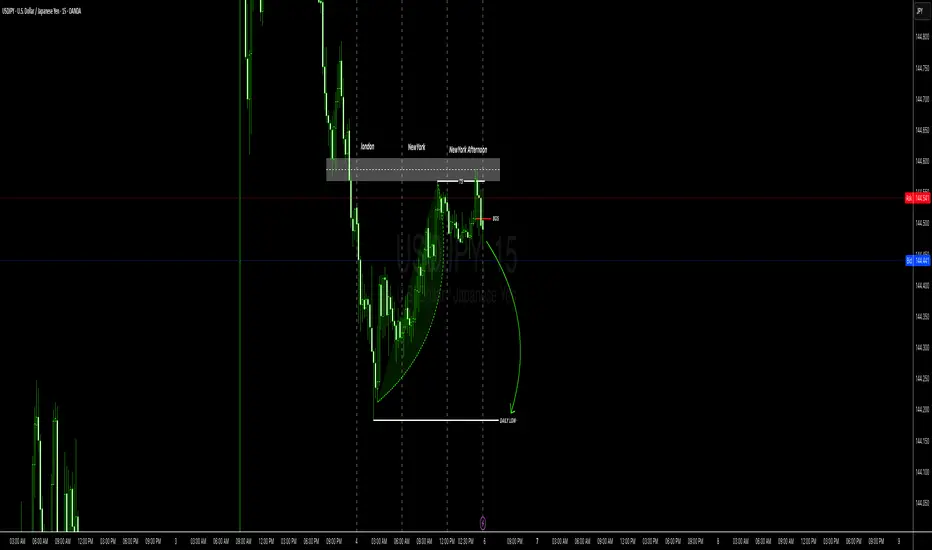
USD/JPYusdjpy did not take last days high or low, but in did manipulate london's high in new york session, as you can see london and NewYork made low resistance liquidity, that is most likely to be taking out sundays opening, on high time frame we are on a resistance for so called order block, we touch near the zone once and then took out people who put there stop loss there, creating a turtle soup, we a most likely to go after friday low as target, this is not finance advice.
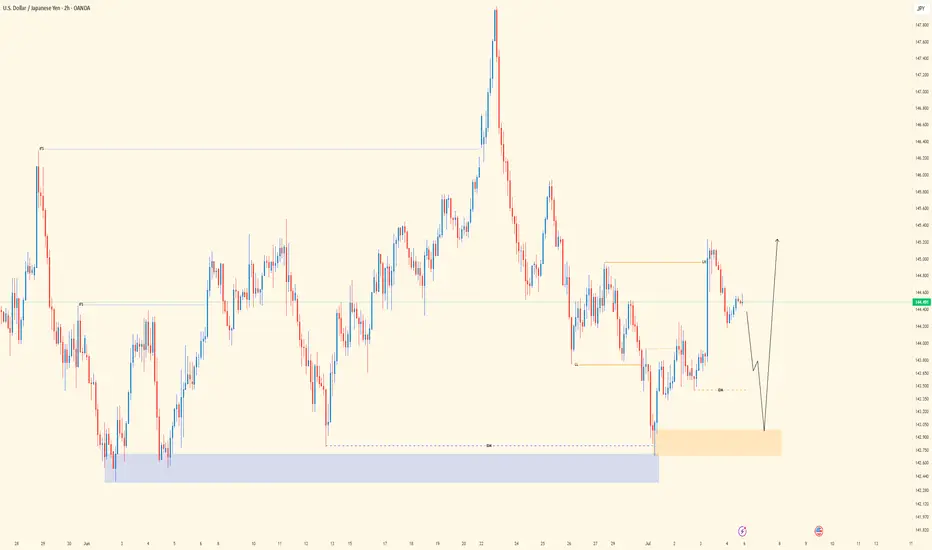
USDJPY| - Bullish Structure Holding | Waiting For Mitigation Pair: USDJPY
Bias: Bullish
Timeframes: 4H, 30M, LTFs
• 4H is showing clean bullish structure — internal high was breached, confirming bullish pressure.
• 30M broke the LH, showing further signs of demand holding.
• Now waiting on price to return and mitigate the OB zone for possible LTF confirmation.
🔹 Entry: Once price hits OB and gives CHoCH/sweep confirmation on LTFs
🔹 Entry Zone: Marked OB on 30M
🔹 Target: Near structure highs (continuation path if demand holds)
Mindset: Ride the wave, not the noise. Let the structure print, and don’t blink when price gives your cue.
Bless Trading!
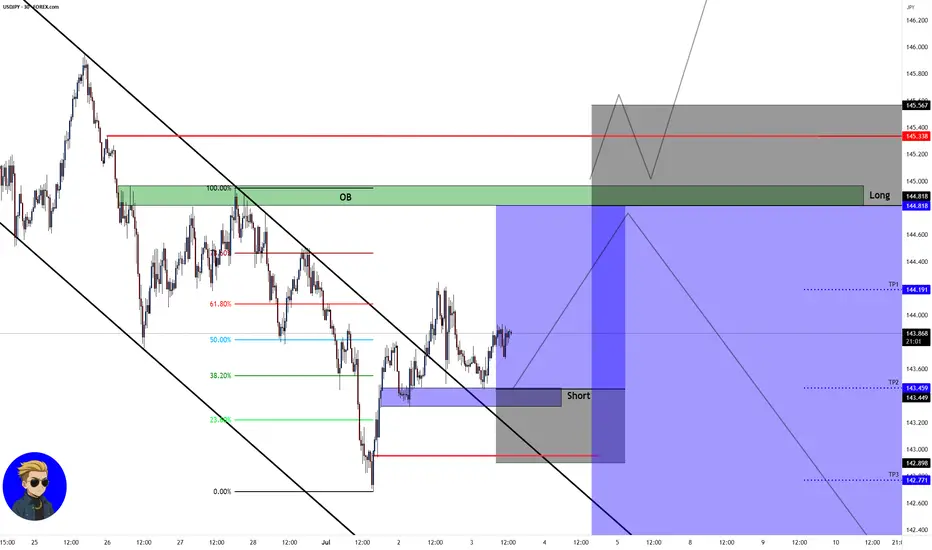
USD/JPY💰Symbol: { USD/JPY }
🟩Price: { 144.818 }
🟥Stop: { 145.567 }
1️⃣profit: { 144.191 }
2️⃣profit: { 143.459 }
3️⃣profit: { 142.771 }
4️⃣profit: { 142.207 }
📊Check your chart before entering.
🚨Check before use to make sure there is no important news.🚨
Another supplement to the previous bullish setupAs we now have bounced off as I described in the previous idea. This month is bullish
Ps: Whoever says trendlines don't work I can explain to you in whatever strategy you use it's the umbrella ☔ of all forex strategies. Fibonacci, SnDs, ICTs, even FVGs like this example here. FVG trader can confirm. Etcetera
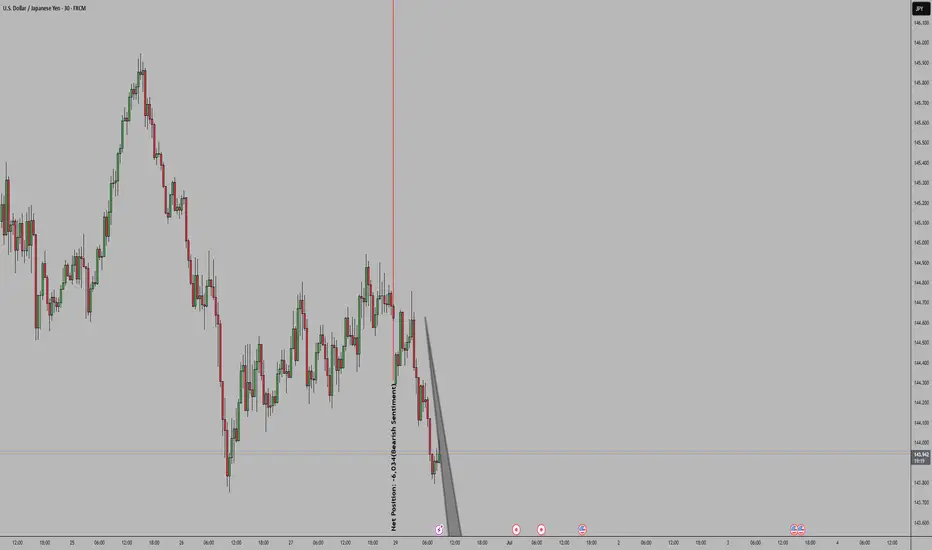
USDJPYUSD: Bearish
JPY: Strong Bullish
USD/JPY Bias: Bearish
(Market expects the yen to strengthen and the dollar to weaken — meaning USD/JPY may fall)
Speculators are heavily betting against the U.S. Dollar and in favor of the Japanese Yen, signaling strong downside bias for USD/JPY.
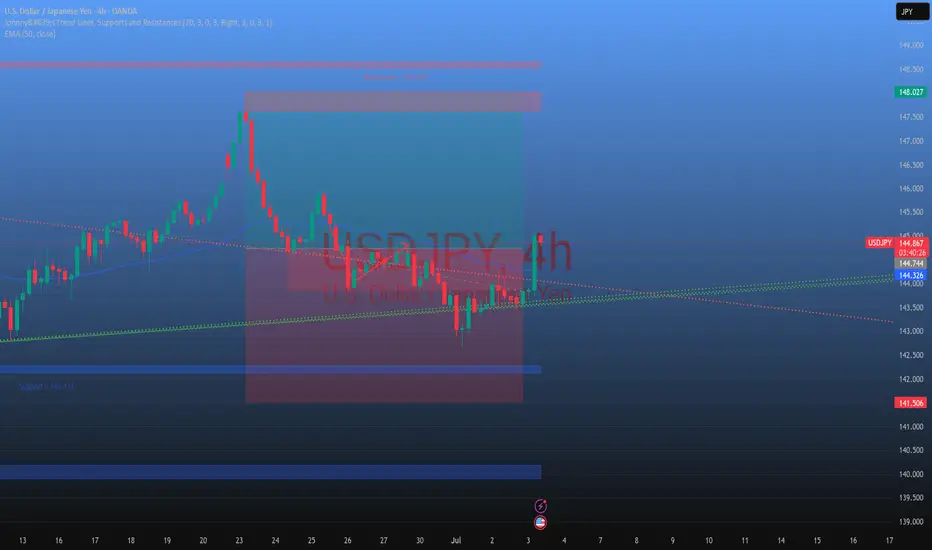
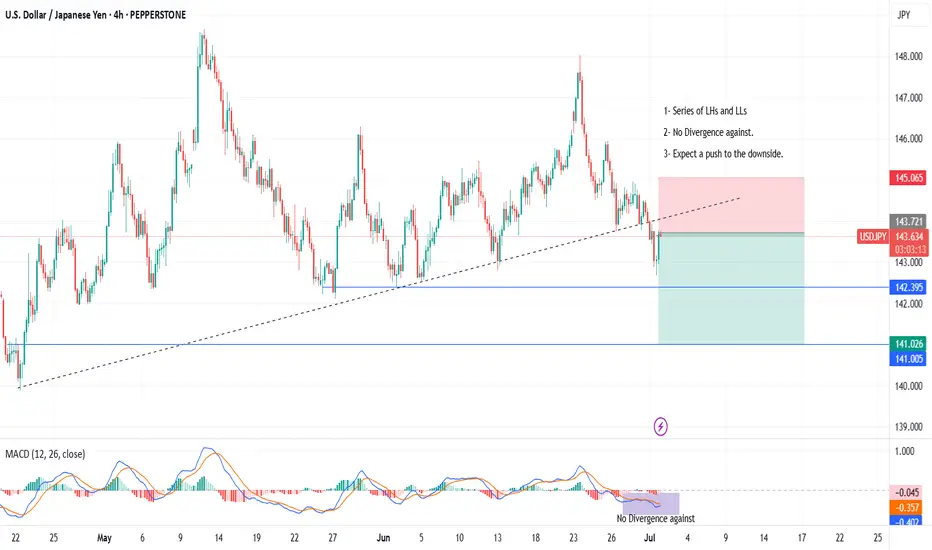
01-07-2025 _ Short Term Bearish Idea _ USDJPY H41- Series of LHs and LLs
2- No Divergence against.
3- Expect a push to the downside.
USDJPY; Heikin Ashi Trade IdeaOANDA:USDJPY
In this video, I’ll be sharing my analysis of USDJPY, using FXAN's proprietary algo indicators with my unique Heikin Ashi strategy. I’ll walk you through the reasoning behind my trade setup and highlight key areas where I’m anticipating potential opportunities.
I’m always happy to receive any feedback.
Like, share and comment! ❤️
Thank you for watching my videos! 🙏

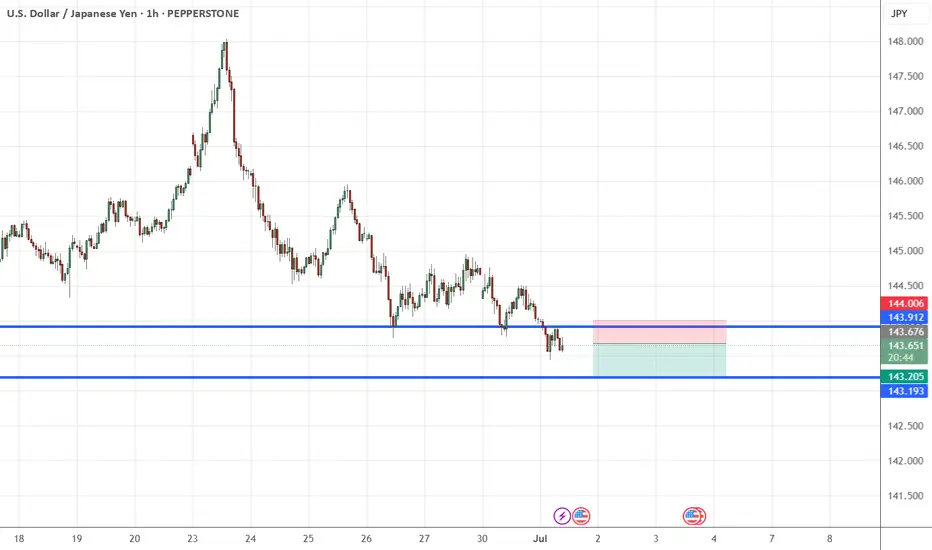
USDJPY-30 Min ChartSell the USDJPY
If rejection occurs here, the downtrend could resume towards the 143.0 support level.
Stop Loss 144.4
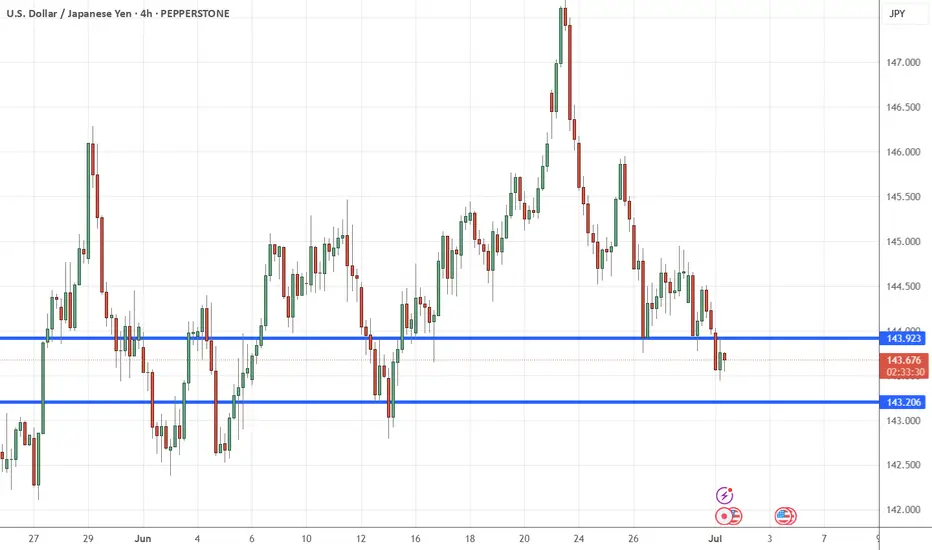
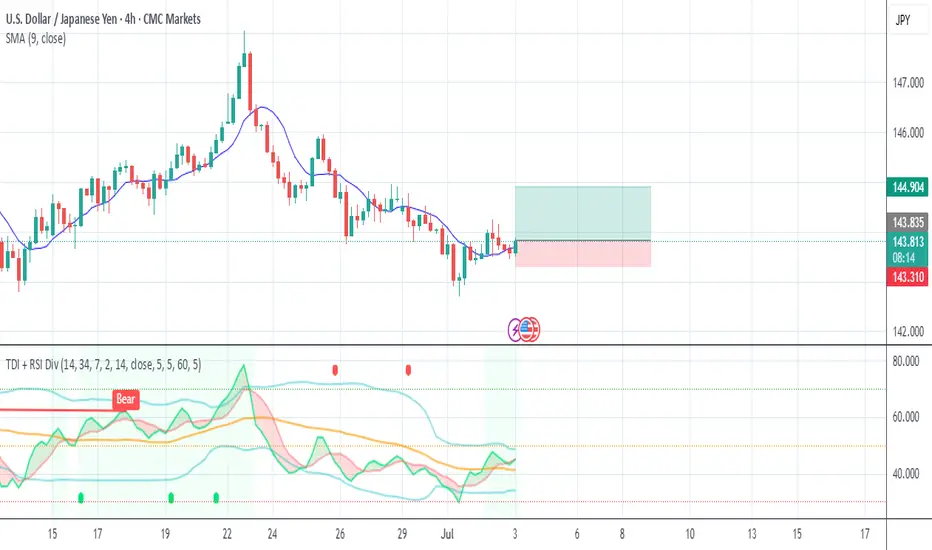
JPY Steadies, Trade Optimism Counters Dollar WeaknessThe Japanese yen held near 143.7 against the dollar on Thursday, stabilizing after recent losses, supported by improved trade sentiment and a weaker greenback.
Japan reiterated its aim for a fair trade deal with the US, though Trump raised pressure by threatening tariffs up to 35% on Japanese imports over low US rice and car sales. Meanwhile, a finalized US-Vietnam deal added to market optimism.
The yen also found support as investors awaited key US jobs data, which could increase the odds of a Fed rate cut.
Key levels: Resistance at 145.70; support at 143.55.
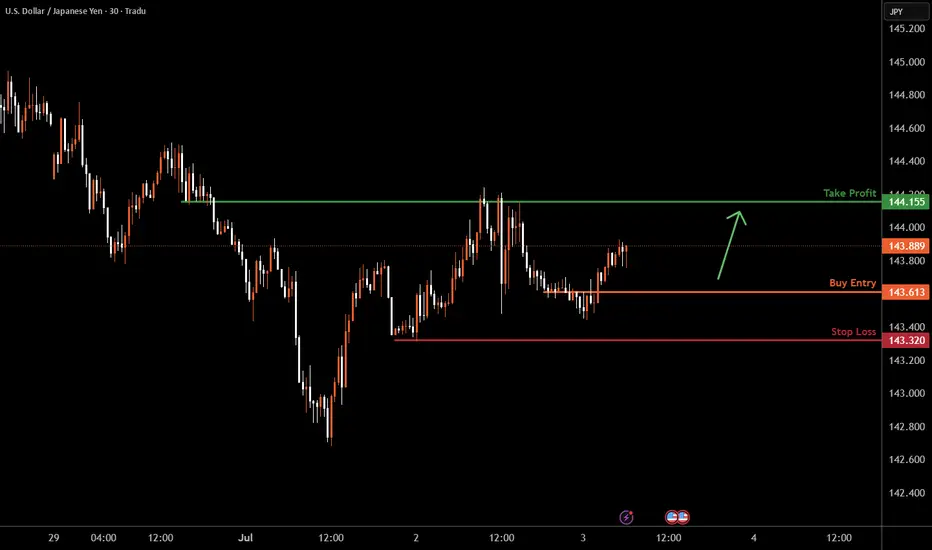
USDJPY M30 I Bullish Bounce Off Based on the M30 chart analysis, the price is falling our buy entry level at 143.61, a pullback support.
Our take profit is set at 144.15, a pullback resistance.
The stop loss is placed at 143.32, a swing low support.
High Risk Investment Warning
Trading Forex/CFDs on margin carries a high level of risk and may not be suitable for all investors. Leverage can work against you.
Stratos Markets Limited (tradu.com ):
CFDs are complex instruments and come with a high risk of losing money rapidly due to leverage. 63% of retail investor accounts lose money when trading CFDs with this provider. You should consider whether you understand how CFDs work and whether you can afford to take the high risk of losing your money.
Stratos Europe Ltd (tradu.com ):
CFDs are complex instruments and come with a high risk of losing money rapidly due to leverage. 63% of retail investor accounts lose money when trading CFDs with this provider. You should consider whether you understand how CFDs work and whether you can afford to take the high risk of losing your money.
Stratos Global LLC (tradu.com ):
Losses can exceed deposits.
Please be advised that the information presented on TradingView is provided to Tradu (‘Company’, ‘we’) by a third-party provider (‘TFA Global Pte Ltd’). Please be reminded that you are solely responsible for the trading decisions on your account. There is a very high degree of risk involved in trading. Any information and/or content is intended entirely for research, educational and informational purposes only and does not constitute investment or consultation advice or investment strategy. The information is not tailored to the investment needs of any specific person and therefore does not involve a consideration of any of the investment objectives, financial situation or needs of any viewer that may receive it. Kindly also note that past performance is not a reliable indicator of future results. Actual results may differ materially from those anticipated in forward-looking or past performance statements. We assume no liability as to the accuracy or completeness of any of the information and/or content provided herein and the Company cannot be held responsible for any omission, mistake nor for any loss or damage including without limitation to any loss of profit which may arise from reliance on any information supplied by TFA Global Pte Ltd.
The speaker(s) is neither an employee, agent nor representative of Tradu and is therefore acting independently. The opinions given are their own, constitute general market commentary, and do not constitute the opinion or advice of Tradu or any form of personal or investment advice. Tradu neither endorses nor guarantees offerings of third-party speakers, nor is Tradu responsible for the content, veracity or opinions of third-party speakers, presenters or participants.
usdjpy buy tradeThe Relative Strength Index (RSI) is showing an upward trend, indicating increasing momentum. Additionally, the Moving Average Convergence Divergence (MACD) is showing a bullish crossover, further supporting the potential for an upward move
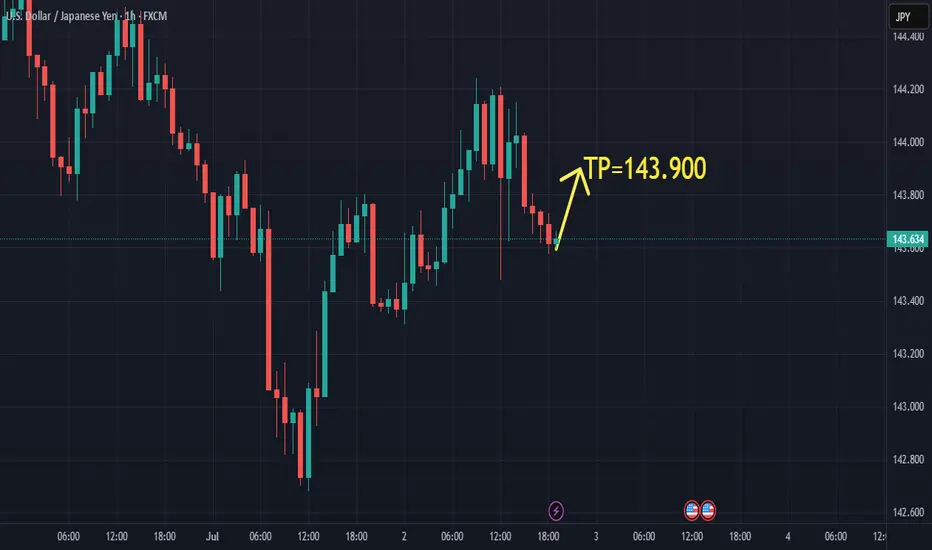
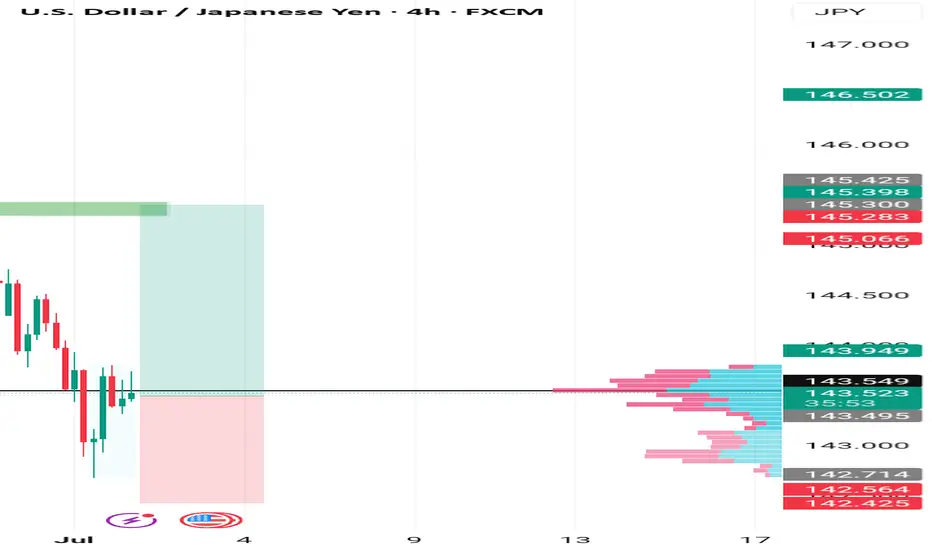
USD/JPY short-term longThe pair is currently trading at the 4H support area (143.500 - 143.700) and I expect the price to reach at least 143.900
Entry = 143.600
Take profit = 143.900
Trade safe!
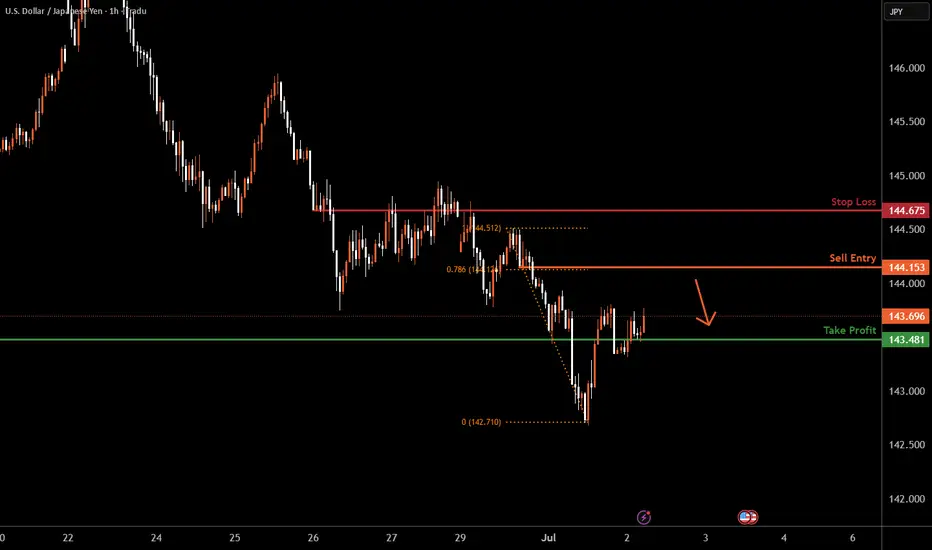
USDJPY H1 I Bearish ReversalBased on the H1 chart, the price is rising toward our sell entry level at 144.15, a pullback resistance that aligns with the 78.6% Fib retracement.
Our take profit is set at 143.48, an overlap support.
The stop loss is set at 144.67, an overlap resistance.
High Risk Investment Warning
Trading Forex/CFDs on margin carries a high level of risk and may not be suitable for all investors. Leverage can work against you.
Stratos Markets Limited (tradu.com ):
CFDs are complex instruments and come with a high risk of losing money rapidly due to leverage. 63% of retail investor accounts lose money when trading CFDs with this provider. You should consider whether you understand how CFDs work and whether you can afford to take the high risk of losing your money.
Stratos Europe Ltd (tradu.com ):
CFDs are complex instruments and come with a high risk of losing money rapidly due to leverage. 63% of retail investor accounts lose money when trading CFDs with this provider. You should consider whether you understand how CFDs work and whether you can afford to take the high risk of losing your money.
Stratos Global LLC (tradu.com ):
Losses can exceed deposits.
Please be advised that the information presented on TradingView is provided to Tradu (‘Company’, ‘we’) by a third-party provider (‘TFA Global Pte Ltd’). Please be reminded that you are solely responsible for the trading decisions on your account. There is a very high degree of risk involved in trading. Any information and/or content is intended entirely for research, educational and informational purposes only and does not constitute investment or consultation advice or investment strategy. The information is not tailored to the investment needs of any specific person and therefore does not involve a consideration of any of the investment objectives, financial situation or needs of any viewer that may receive it. Kindly also note that past performance is not a reliable indicator of future results. Actual results may differ materially from those anticipated in forward-looking or past performance statements. We assume no liability as to the accuracy or completeness of any of the information and/or content provided herein and the Company cannot be held responsible for any omission, mistake nor for any loss or damage including without limitation to any loss of profit which may arise from reliance on any information supplied by TFA Global Pte Ltd.
The speaker(s) is neither an employee, agent nor representative of Tradu and is therefore acting independently. The opinions given are their own, constitute general market commentary, and do not constitute the opinion or advice of Tradu or any form of personal or investment advice. Tradu neither endorses nor guarantees offerings of third-party speakers, nor is Tradu responsible for the content, veracity or opinions of third-party speakers, presenters or participants.
USDJPY buy TradeOpportunity to BuY on USDJPY
Entry: 143.500
Stop : 143.100
Take profit 📈: 145.400
Comment your opinion
For fund management. Contact me on X @shajudeakinoba1
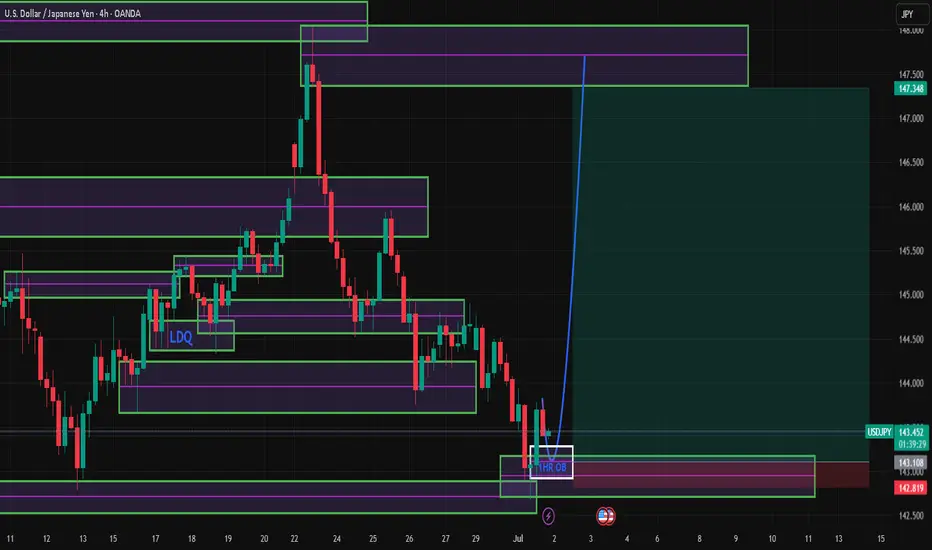
USDJPY Analysis – Bullish Continuation After Minor PullbackUSDJPY is currently trading around 143.340, and I anticipate a minor pullback into the 143.296 zone, which aligns with a possible bullish order block and discount zone on the H1/H4 timeframe.
This short-term dip could serve as a liquidity sweep or mitigation before price resumes its bullish trend, targeting the 147.381 level — a key area of interest tied to previous highs and potential liquidity above.
I’ll be watching for bullish confirmation (e.g., clean W-pattern, bullish engulfing candle, or break of internal structure) from the 143.296 zone before taking long entries.
🔻 Short-term expectation: Pullback to 143.296
🔼 Primary bias: Bullish continuation
🎯 Upside target: 147.381
📍 Current price: 143.340
📌 Risk Management Reminder: This is not financial advice. Always apply proper risk management:
✔️ Use a minimum of 1:2 RR setups
✔️ Risk no more than 1–2% of your capital per trade
✔️ Wait for clear confirmation before entering
✔️ Protect your account — preservation over prediction
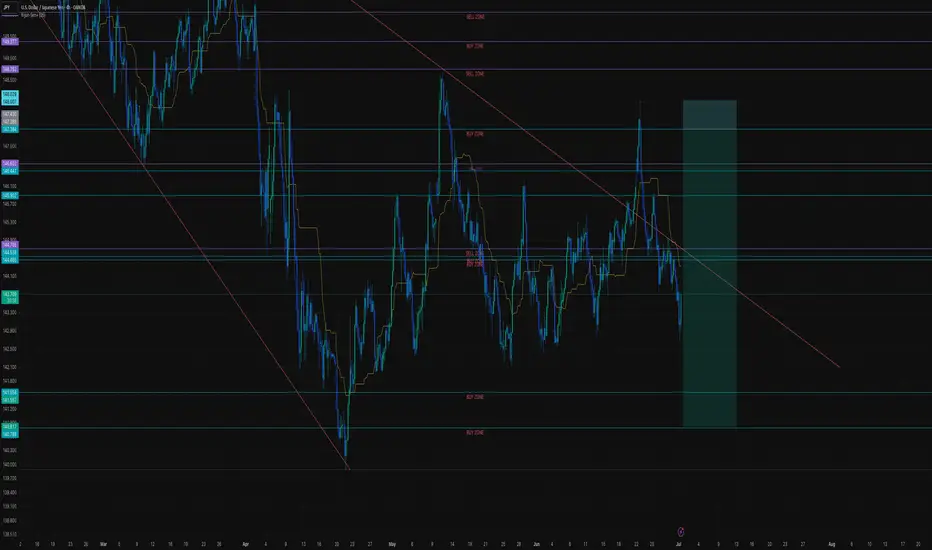
USD/JPY weekly Analysis for June 30th - July 4th sell order
Weekly target 141.55
it is a possible chance to see 140.78 this week as well
stay cool calm collect and don't over leverage.
USDJPU 160PIP BAGED LIVE TRADE Japanese Yen sticks to intraday gains; USD/JPY seems vulnerable near multi-week low
The Japanese Yen retains its positive bias against a bearish US Dollar and currently trades near a three-week low touched during the Asian session earlier this Tuesday. The Bank of Japan's (BoJ) Tankan Survey showed that business confidence at large manufacturers in Japan improved for the first time in two quarters during the April-June period.

USDCAD H4 Solid ShortH4 trend down
Solid resistance entry for short
TP not far on next visible SR level
80% probability