USDCAD H4 Solid ShortH4 trend down
Solid resistance entry for short
TP not far on next visible SR level
80% probability
USDJPY trade ideas
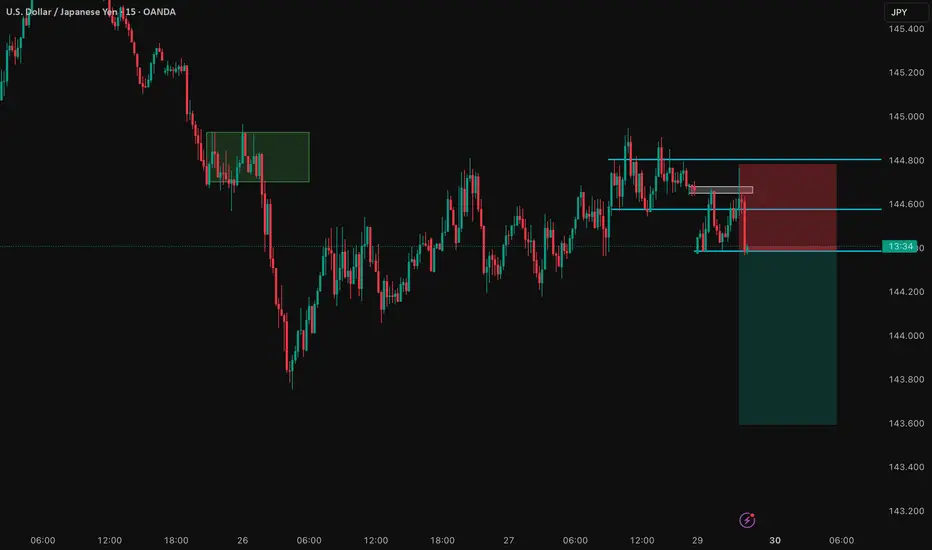
USDJPY OVERVIEW I have been bearish on USDJPY Since last week i will be waiting for price to come to supply levels that have been left unmitigated.Looking for sells
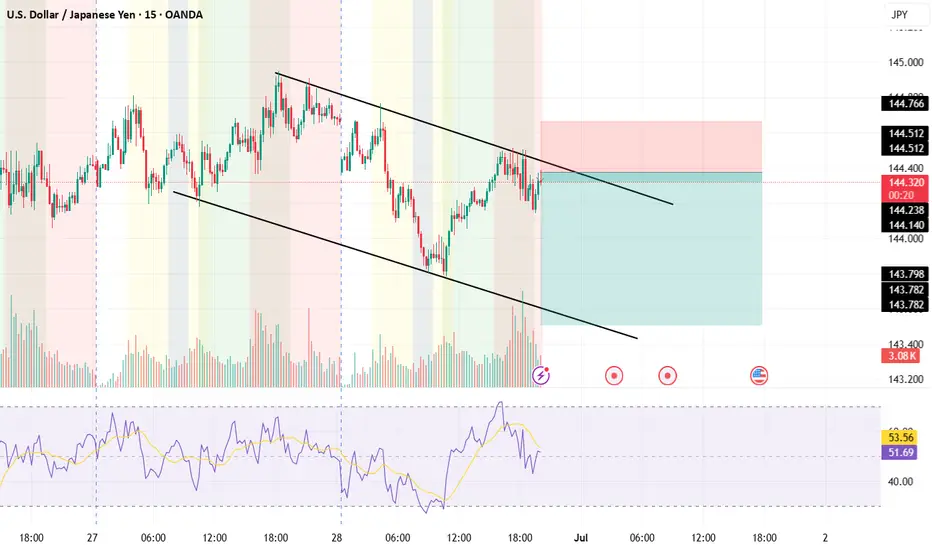
Potential Long ScalpUSDJPY tried multiple times to test the bear trend extreme after the 3-Push correction.
It seems like bears can't keep price below the EMA, with gaps getting smaller and smaller at each bear swing.
Now, it's forming sort of a Double Bottom at the bull Trend Line at the end of what seems to be a 2-legged bear move. Chances are that the bears are exhausted and if the current candle closes with a bull body or even a small bear body, there could be a good long scalp.
The problem is that it looks like a Barb Wire too, so any Breakout tend to fail. Still, there could be a good opportunity to enter in second leg after a bullish breakout out of the Double Bottom.
USD JPY ACa possible scenario it should hit for tomorrow .
I'm so lost in this market nothing seem to work .still try to survive. a strategy that works for days or even a month dosent have a guarantee to work for next month ,every thing is like gamble . im trying so hard too many ways too see the holy grail yet till now i can say it with trust there is not a easy peasy holy grail of trading ... be ready to looose and be ready to maybe not to gain anything ,, this trading stuff is like an art as u drown in it it only cuase insanity . right now i gotta go ill use trading view as journal now on to see what im doing good luck have fun trading
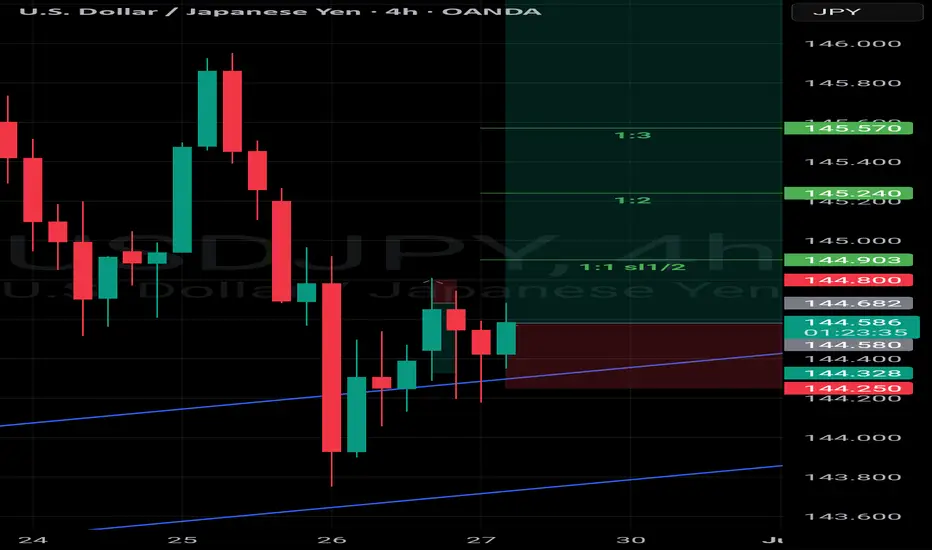
USD/JPY - bearish turning to bullish?4H bearish FVG has been mitigated
30min price action fast approaching bearish FVG above. If that is mitigated, this pair could fly upwards
Please share your thoughts
Fundamental Market Analysis for June 30, 2025 USDJPYThe USD/JPY pair is attracting some sellers towards 143.85 during the Asian session on Monday. The U.S. dollar (USD) is weakening against the Japanese yen (JPY) amid rising bets for a Federal Reserve (Fed) interest rate cut.
The United States (US) and China are close to a deal on tariffs. However, U.S. President Donald Trump abruptly ended trade talks with Canada, adding uncertainty to the market's positive outlook.
In addition, traders are betting that the U.S. central bank will cut rates more frequently and possibly sooner than previously expected. Markets estimate the probability of a quarter-point Fed rate cut at nearly 92.4%, up from 70% a week earlier.
On the data side, the personal consumption expenditure (PCE) price index rose 2.3% in May, up from 2.2% in April (revised from 2.1%), the U.S. Bureau of Economic Analysis reported Friday. This value matched market expectations. Meanwhile, the core PCE price index, which excludes volatile food and energy prices, rose 2.7% in May, following a 2.6% increase (revised from 2.5%) seen in April.
On the other hand, the Bank of Japan's (BoJ) cautious stance on interest rate hikes could put pressure on the yen and create a tailwind for the pair.
Trade recommendation: SELL 143.50, SL 144.30, TP 142.40
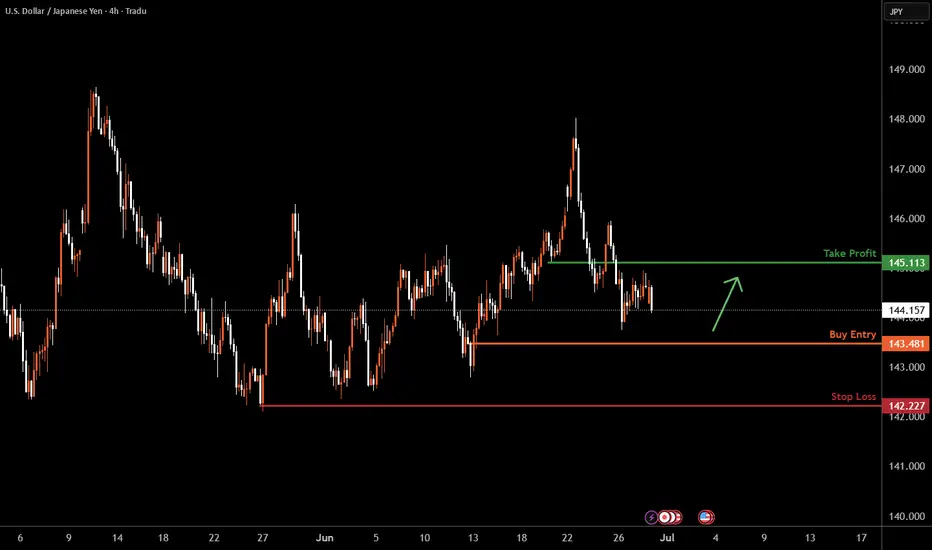
USDJPY H4 I Bullish Bounce Off Based on the H4 chart analysis, the price is approaching our buy entry level at 143.48, a pullback support.
Our take profit is set at 145.11 a pullback resistance.
The stop loss is placed at 142.22, a swing low support.
High Risk Investment Warning
Trading Forex/CFDs on margin carries a high level of risk and may not be suitable for all investors. Leverage can work against you.
Stratos Markets Limited (tradu.com ):
CFDs are complex instruments and come with a high risk of losing money rapidly due to leverage. 63% of retail investor accounts lose money when trading CFDs with this provider. You should consider whether you understand how CFDs work and whether you can afford to take the high risk of losing your money.
Stratos Europe Ltd (tradu.com ):
CFDs are complex instruments and come with a high risk of losing money rapidly due to leverage. 63% of retail investor accounts lose money when trading CFDs with this provider. You should consider whether you understand how CFDs work and whether you can afford to take the high risk of losing your money.
Stratos Global LLC (tradu.com ):
Losses can exceed deposits.
Please be advised that the information presented on TradingView is provided to Tradu (‘Company’, ‘we’) by a third-party provider (‘TFA Global Pte Ltd’). Please be reminded that you are solely responsible for the trading decisions on your account. There is a very high degree of risk involved in trading. Any information and/or content is intended entirely for research, educational and informational purposes only and does not constitute investment or consultation advice or investment strategy. The information is not tailored to the investment needs of any specific person and therefore does not involve a consideration of any of the investment objectives, financial situation or needs of any viewer that may receive it. Kindly also note that past performance is not a reliable indicator of future results. Actual results may differ materially from those anticipated in forward-looking or past performance statements. We assume no liability as to the accuracy or completeness of any of the information and/or content provided herein and the Company cannot be held responsible for any omission, mistake nor for any loss or damage including without limitation to any loss of profit which may arise from reliance on any information supplied by TFA Global Pte Ltd.
The speaker(s) is neither an employee, agent nor representative of Tradu and is therefore acting independently. The opinions given are their own, constitute general market commentary, and do not constitute the opinion or advice of Tradu or any form of personal or investment advice. Tradu neither endorses nor guarantees offerings of third-party speakers, nor is Tradu responsible for the content, veracity or opinions of third-party speakers, presenters or participants.
Uj bearish scenario Uj confirmed bearish
Bearish Momentum
Smc completely forms and
Confirmed with counter trade break
Good early entry
USDJPY: On The Lookout For Clear DirectionSimply ranging... A breakout from the range will be a good start. I will just observe.
Long USD/JPYBuy the US dollar against the Japanese yen at a price of 144.700. Stop loss below 143.700. Take profit 149.00
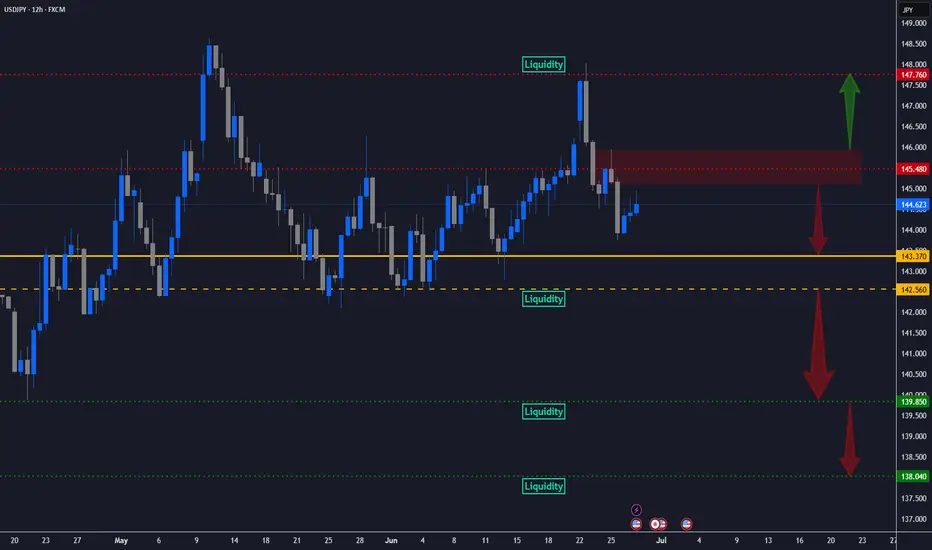
USD/JPY - Potential TargetsDear Friends in Trading,
How I see it,
FMV - PIVOT AREA @ 143.370 - 142.560
If price holds-rejects below 145.500
"SHORT" Targets:
1] 143.370
"Strong breach below 142.560 - PIVOT area":
2] 139.850
3] 138.040
A Strong breach above 146.000 psychological area-
"LONG" Target":
1] 147.760
I sincerely hope my point of view offers a valued insight.
Thank you for taking the time to study my analysis.
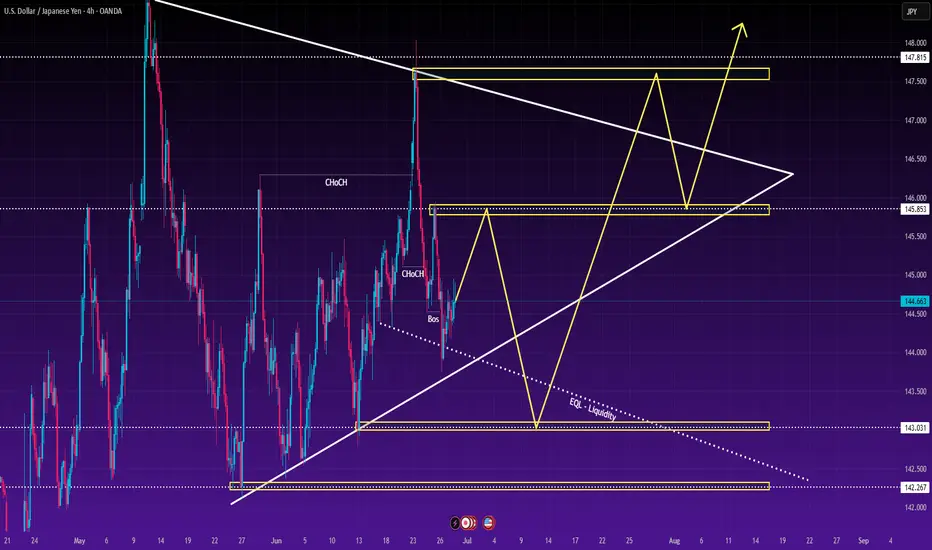
USDJPY Poised for Liquidity Grab Ahead of NFP USDJPY is currently undergoing a clear redistribution phase on the 4H chart, having recently broken bullish structure and formed successive lower highs. The first week of July is packed with high-impact economic events from both the US and Japan – most notably speeches from Fed Chair Powell and BOJ Governor Ueda, alongside ADP and Non-Farm Payrolls – all of which could trigger significant volatility and a potential liquidity sweep before a true directional move takes shape.
🎯 Smart Money Concepts (SMC) Flow Analysis
✅ A Break of Structure (BOS) has just occurred following a sharp selloff from the 147.8 supply zone – a bearish structure is now clearly established.
⚠️ Change of Character (ChoCH) near the 145.8 level signals potential institutional involvement and short-term redistribution.
💧 Equal Lows (EQL) around 143.0 and 142.2 suggest prime liquidity targets likely to be swept before any genuine bullish intent emerges.
📈 Price is currently retracing toward the 145.85 – 146.00 short-term supply zone, offering a favourable area for short setups if rejection occurs.
🧠 Trade Scenarios (Planned)
🔻 Priority SELL Setups
SELL at 145.851 – 146.000
SL: 146.351
TP1: 145.351 (+50 pips)
TP2: 144.851 (+100 pips)
TP3: 143.851 (+200 pips)
TP4: Open
This is a fresh supply zone formed post-BOS, ideal for potential short entries upon confirmation.
SELL at 147.750 – 147.950
SL: 148.150
TP1: 147.250 (+50 pips)
TP2: 146.750 (+100 pips)
TP3: 145.750 (+200 pips)
TP4: Open
A key higher timeframe supply zone. If price breaks above 146.3 and rallies further, this is where Smart Money may re-enter shorts.
🔺 Potential BUY Setups Post-Liquidity Sweep
BUY at 143.031 – 142.930
SL: 142.731
TP1: 143.531 (+50 pips)
TP2: 144.031 (+100 pips)
TP3: 145.031 (+200 pips)
TP4: Open
This zone aligns with the trendline and EQL – a possible bounce zone if bullish BOS or strong price rejection appears.
BUY at 142.200 – 142.000
SL: 141.800
TP1: 142.700 (+50 pips)
TP2: 143.200 (+100 pips)
TP3: 144.200 (+200 pips)
TP4: Open
A deeper liquidity pool – likely an institutional entry point if price is flushed prior to NFP data.
📅 Key Upcoming Events – USD/JPY Traders Beware
Tuesday (1 July):
🗣️ Speeches from BOJ Gov Ueda and Fed Chair Powell – high-impact catalysts early in the week.
🧾 ISM Manufacturing PMI, JOLTS Job Openings – insight into the US economy’s momentum.
Wednesday to Thursday (2–3 July):
💼 ADP Employment & Non-Farm Payrolls – major market-moving data to shape USD sentiment.
→ Given the heavy news calendar, it's wise to react to price action at key zones with strong risk management, rather than pre-empt.
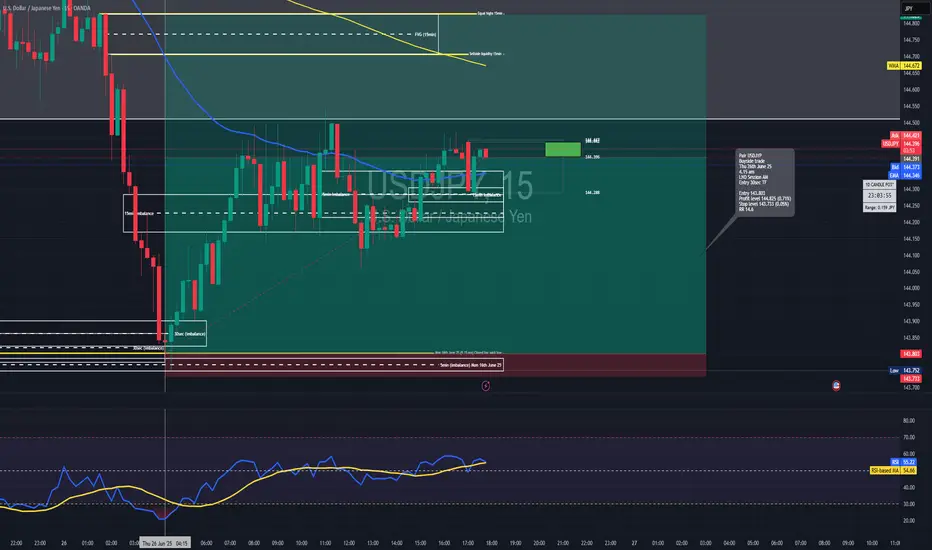
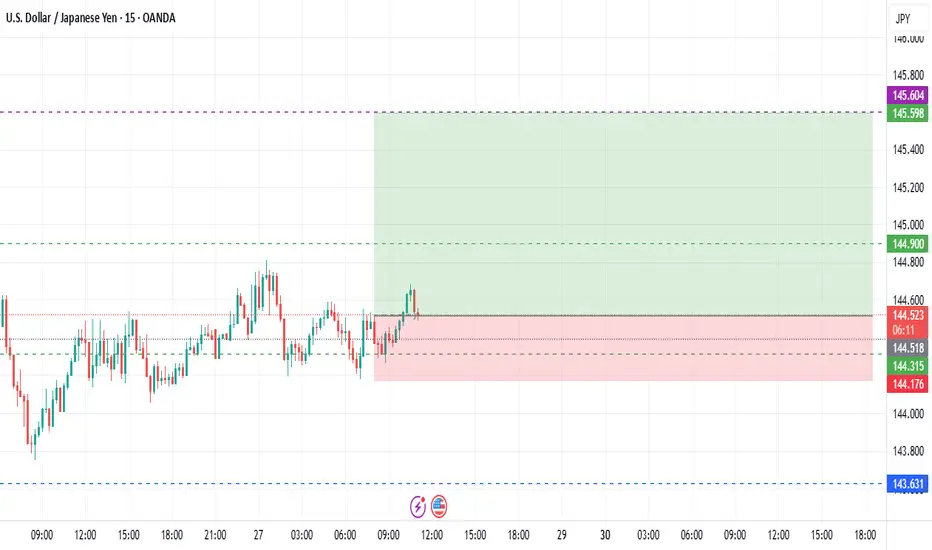
Long trade
30sec TF entry
📍 Pair: USDJPY
📅 Date: Thursday, June 26, 2025
🕒 Time: 4:15 AM (London Session AM)
⏱ Time Frame: 15min
📈 Direction: Buyside
📊 Trade Breakdown:
Metric Value
Entry Price 143.803
Profit Level 144.825 (+0.71%)
Stop Loss 143.733 (−0.05%)
Risk-Reward
Ratio 14.6 : 1
🧠 Context / Trade Notes
🔄 15 Minute Structure Support:
The trade was based on a reactive low from the 5-minute TF, aligning with a buy-side imbalance zone formed on the 5-minute chart (Monday, 16th June, 10:00 AM).
📉 RSI in Low Region:
RSI was observed in an oversold condition on LTFs, providing additional confluence for a short-term reversal setup.
30sec TF entry overview
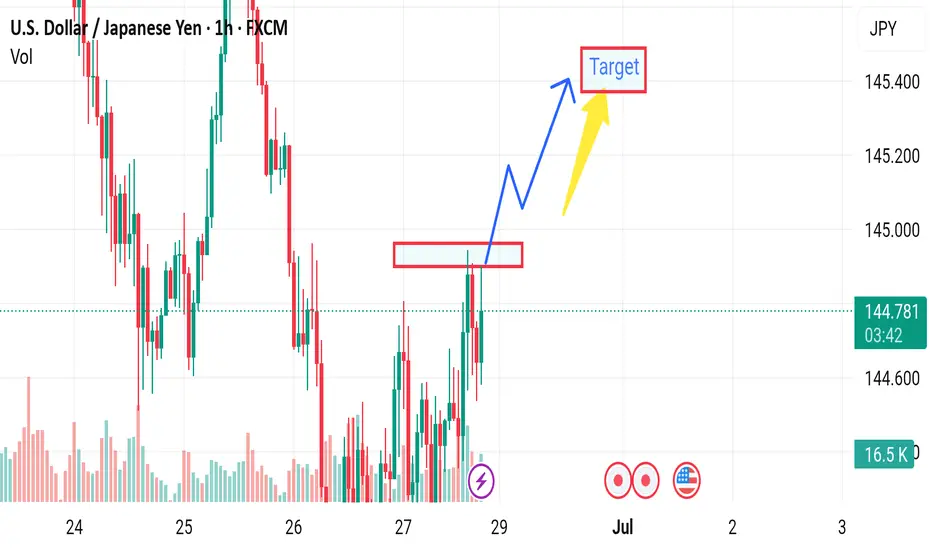
Market next target ⚠️ Disruption & Counterpoints:
1. Premature Breakout Bias:
The chart shows price repeatedly rejecting the resistance zone (highlighted in red).
The arrow assumes a clean breakout without confirmation — this is speculative, as the price hasn’t closed convincingly above the resistance.
This could easily turn into a false breakout or double top if price fails again.
2. Volume Mismatch:
A breakout should be backed by strong bullish volume. However, the current volume is mixed and not showing a clear surge in buyer strength.
Lack of volume confirmation makes the breakout less reliable.
3. Ignoring Recent Rejections:
The red zone was tested multiple times in the last sessions without success. That typically signals strong supply or institutional selling.
Repeating this setup without accounting for historical failure adds downside risk.
4. Missing Bearish Scenario:
No alternate path is considered. A failed breakout could lead to a pullback toward 144.00 or lower, especially with U.S. news events (indicated by the flag).
A balanced analysis should always prepare for both breakout and rejection.
5. Macroeconomic Event Risk:
Similar to the GBP/USD chart, this one also shows an upcoming U.S. economic event. That could heavily move USD/JPY, and technical setups may become invalid fast.
The analysis ignores the need to wait for the news catalyst or confirmation after the release.
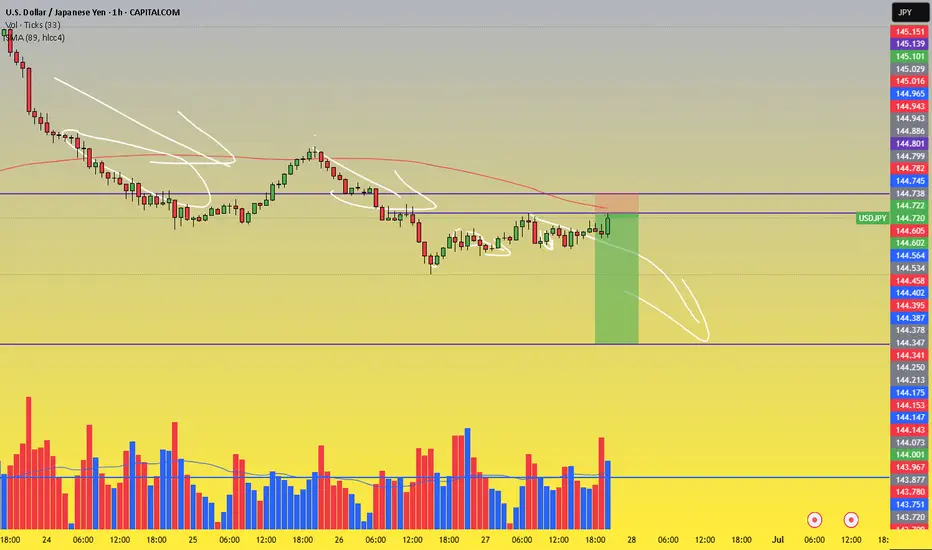
USDJPY Buy scalp analysis and sell swing analysisThis analysis is based on the daily and 4-hour timeframes and executed using reversal trading, trend formation, and supply and demand trading. Full explanation in the video!

SELL: USDJPY 144.75 Trade Recommendation – 1H Chart🎯 Trade Setup:
Sell Entry Zone: 144.75 – 144.78
Stop Loss (SL): 145.15
Take Profit (TP): 142.60
Risk:Reward Ratio (R:R): Approx. 1:4 → Excellent for swing or intraday setups
📊 Technical Analysis Breakdown:
1. Strong Resistance Zone – High Reversal Probability:
The 144.75–144.78 zone:
A clear historical resistance area with multiple rejections in the past
Converges with the SMA 89 (red line) → acts as a strong dynamic resistance
Price has consistently formed lower highs around this region → showing selling pressure is building
2. Volume Analysis – Distribution Signals:
Volume slightly increased as price approached the resistance but did not accompany a breakout
No “breakout volume” → Indicates possible distribution phase, not accumulation → Favoring SELL positions
3. Price Action & Pattern:
The structure is forming lower highs – a key sign of bearish momentum
After the sharp rejection from the 145.22 zone (June 26), the market has shifted toward a bearish correction cycle
4. Target Area – Key Support:
142.60 is a well-defined support level:
Matches a previous major low
Corresponds with a high-liquidity zone from prior trading sessions
Ideal area to take profit before any potential bounce
⚠️ Risk Management Notes:
Trade confirmation increases if you see bearish candlestick signals (e.g., bearish engulfing, pin bar) in the entry zone
Exit immediately if price breaks and closes above 145.15 with strong volume – that invalidates the bearish setup
USDJPY 15M BUY FRIDAY DELIGHT LOLEvery pips count Scalping 15m
Reason to buy
Strong SUPPORT 144.22
Lets hope we get PAID @ THIS LOVELY SUNNY LONDON :))))
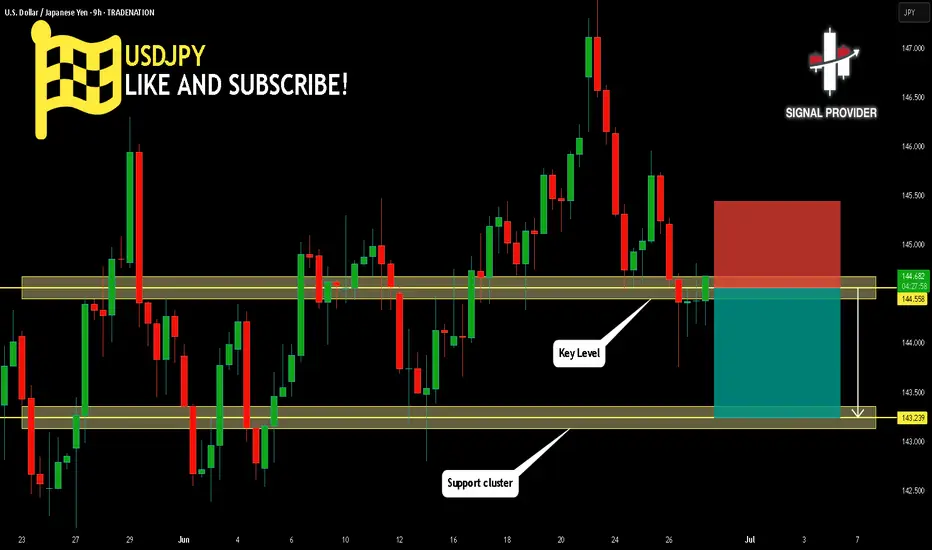
USDJPY Will Go Lower From Resistance! Sell!
Take a look at our analysis for USDJPY.
Time Frame: 9h
Current Trend: Bearish
Sentiment: Overbought (based on 7-period RSI)
Forecast: Bearish
The market is testing a major horizontal structure 144.558.
Taking into consideration the structure & trend analysis, I believe that the market will reach 143.239 level soon.
P.S
Overbought describes a period of time where there has been a significant and consistent upward move in price over a period of time without much pullback.
Disclosure: I am part of Trade Nation's Influencer program and receive a monthly fee for using their TradingView charts in my analysis.
Like and subscribe and comment my ideas if you enjoy them!
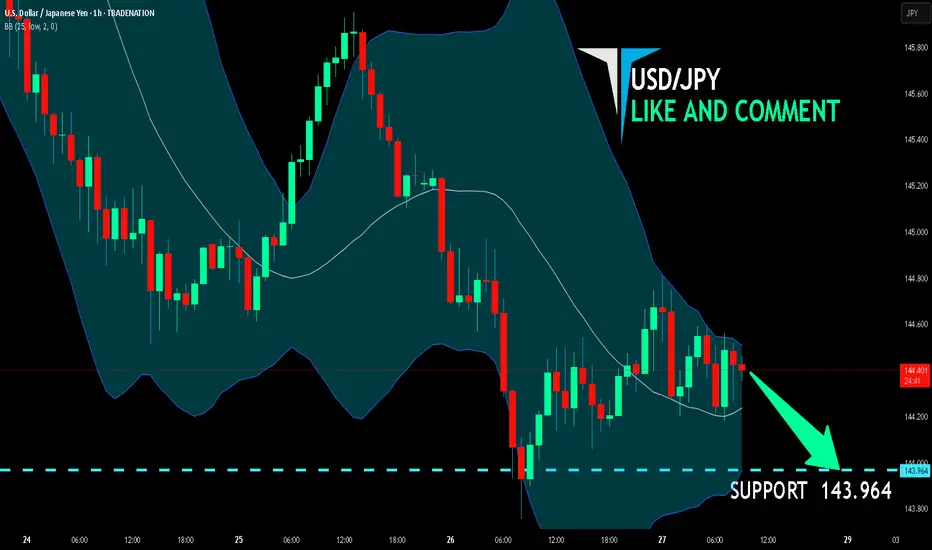
USD/JPY BEARS ARE GAINING STRENGTH|SHORT
Hello, Friends!
Bearish trend on USD/JPY, defined by the red colour of the last week candle combined with the fact the pair is overbought based on the BB upper band proximity, makes me expect a bearish rebound from the resistance line above and a retest of the local target below at 143.964.
Disclosure: I am part of Trade Nation's Influencer program and receive a monthly fee for using their TradingView charts in my analysis.
LIKE AND COMMENT MY IDEAS
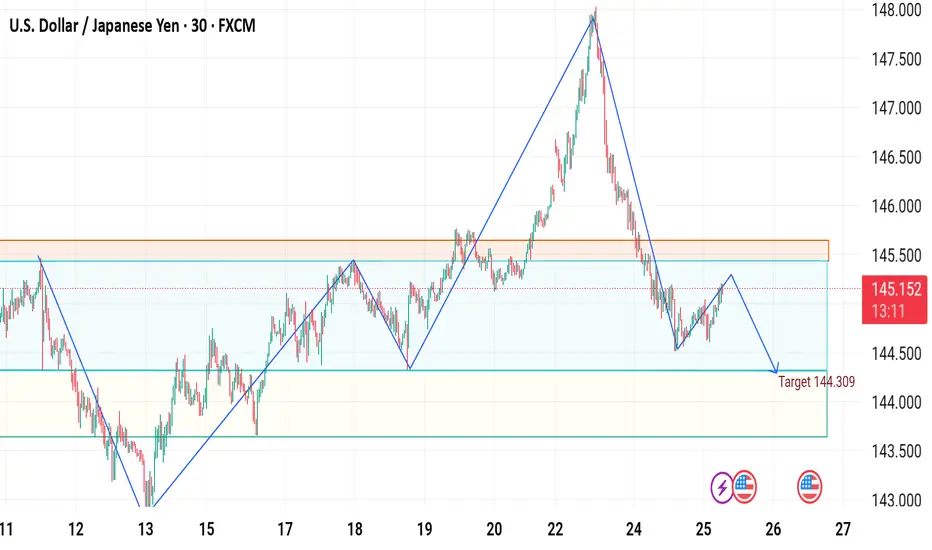
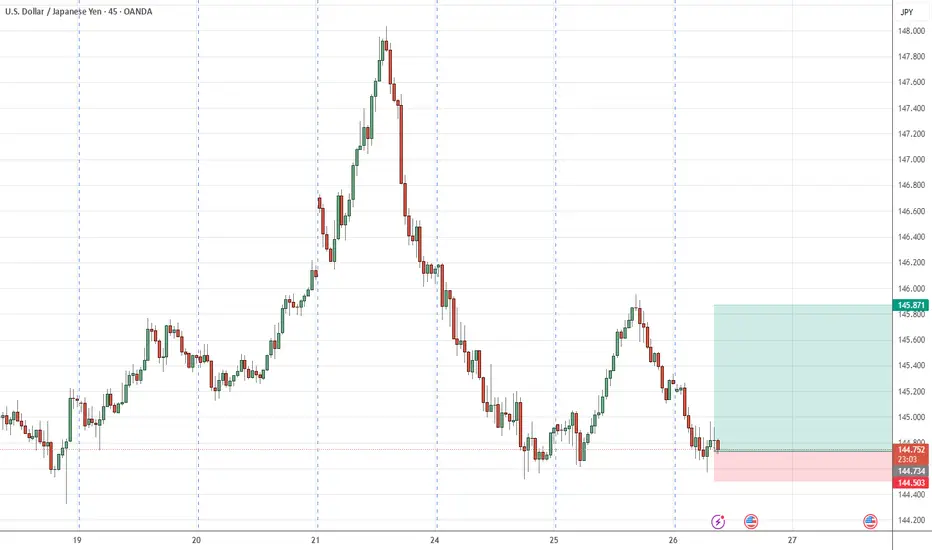
USD/JPY Bearish Setup: Target 144.309USD/JPY Technical Analysis (30-Min Chart)
Current Price: 145.157
Chart Pattern: The chart shows a bearish structure forming after a sharp drop from the recent high near 147.9. The price is currently consolidating below a resistance zone.
Key Resistance Zone: ~145.70 – 146.00 (highlighted by the orange box)
Support Zone: ~144.30 (target area)
Bearish Outlook:
The price formed a lower high after the drop from the recent peak, indicating selling pressure.
A potential bearish flag or lower high rejection is forming.
The forecasted path suggests a downward move towards 144.309, aligning with the previous support area.
Conclusion:
The setup favors short positions if the price fails to break above the 145.70–146.00 resistance.
Target remains 144.309, with a break below that possibly opening the way to 143.50.
Watch for price action near the blue zone to confirm the downward continuation.