Long USD/JPYBuy the US dollar against the Japanese yen at a price of 144.700. Stop loss below 143.700. Take profit 149.00
USDJPY trade ideas
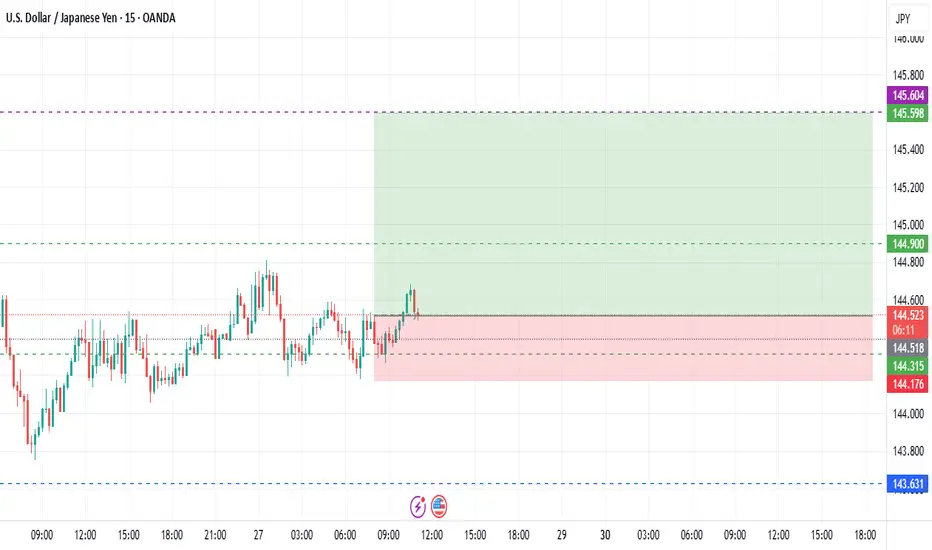
USDJPY Potential UpsidesHey Traders, in tomorrow's trading we are monitoring USDJPY for a buying opportunity around 144.400 zone, USDJPY is trading in an uptrend and currently is in a correction phase in which it is approaching the trend at 144.400 support and resistance area.
Trade safe, Joe.

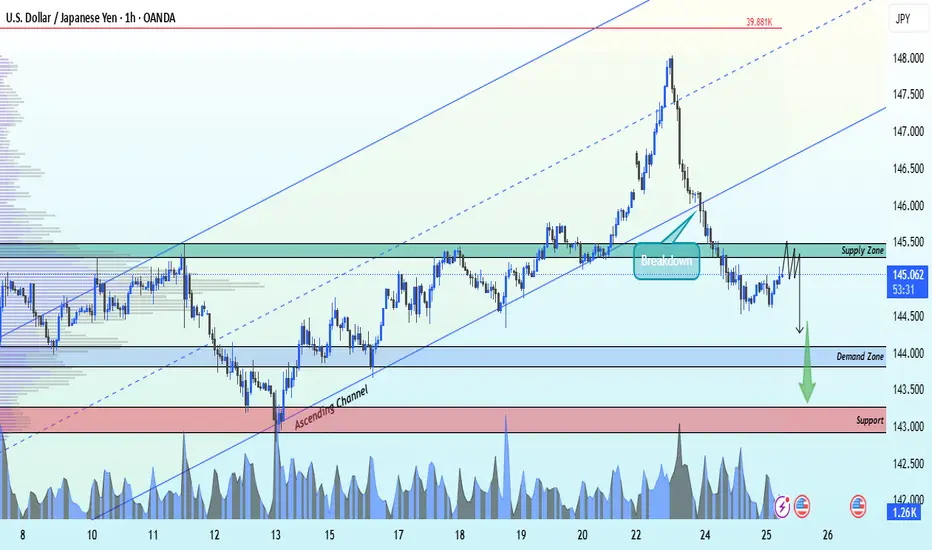
USDJPY Ascending channel breakdown ahead selling strong📉 USDJPY Breaks Down!
Strong sell-off from the key supply zone at 145.500 – the ascending channel has been broken on the 1H timeframe, signaling momentum shift.
🎯 Technical Targets:
🔹 1st Target: 144.000 – key demand zone
🔹 2nd Target: 143.000 – strong support level
Bearish pressure is building — price action confirms the shift. Eyes on lower zones as sellers take control. 📊
🔔 Like, Follow, and Comment your thoughts!
💬 Join us for more timely market updates and clean setups!
#USDJPY #ForexAnalysis #TechnicalTrading #PriceAction #FXSetup #LiviaTrades 😜
USD/JPY - Potential TargetsDear Friends in Trading,
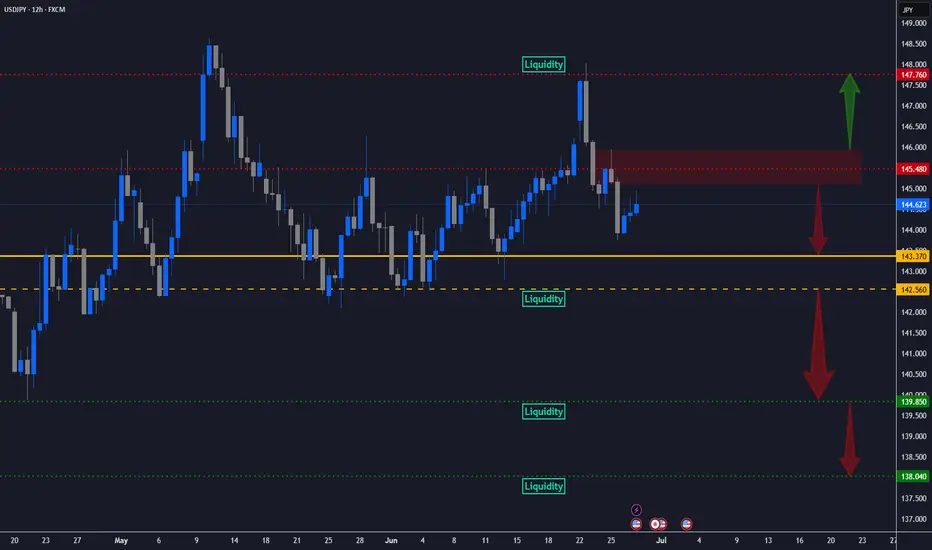
How I see it,
FMV - PIVOT AREA @ 143.370 - 142.560
If price holds-rejects below 145.500
"SHORT" Targets:
1] 143.370
"Strong breach below 142.560 - PIVOT area":
2] 139.850
3] 138.040
A Strong breach above 146.000 psychological area-
"LONG" Target":
1] 147.760
I sincerely hope my point of view offers a valued insight.
Thank you for taking the time to study my analysis.
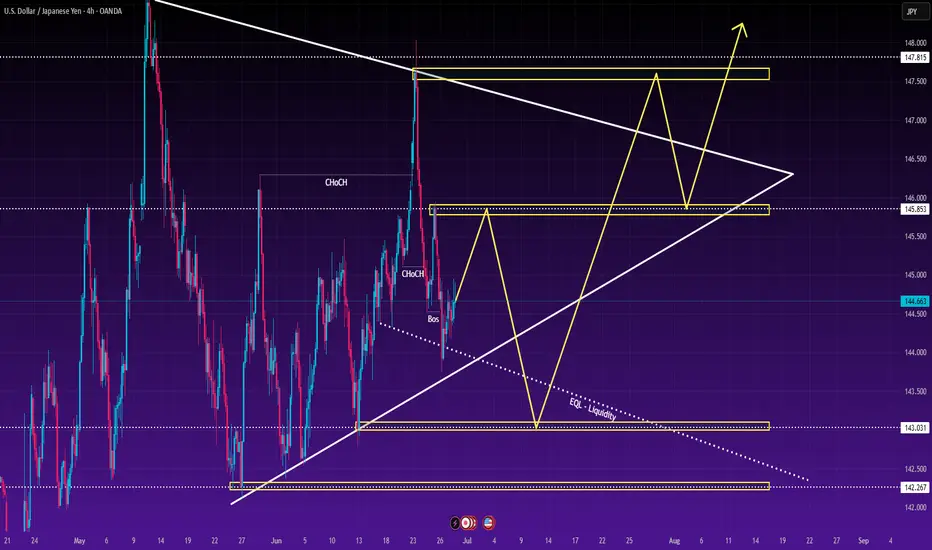
USDJPY Poised for Liquidity Grab Ahead of NFP USDJPY is currently undergoing a clear redistribution phase on the 4H chart, having recently broken bullish structure and formed successive lower highs. The first week of July is packed with high-impact economic events from both the US and Japan – most notably speeches from Fed Chair Powell and BOJ Governor Ueda, alongside ADP and Non-Farm Payrolls – all of which could trigger significant volatility and a potential liquidity sweep before a true directional move takes shape.
🎯 Smart Money Concepts (SMC) Flow Analysis
✅ A Break of Structure (BOS) has just occurred following a sharp selloff from the 147.8 supply zone – a bearish structure is now clearly established.
⚠️ Change of Character (ChoCH) near the 145.8 level signals potential institutional involvement and short-term redistribution.
💧 Equal Lows (EQL) around 143.0 and 142.2 suggest prime liquidity targets likely to be swept before any genuine bullish intent emerges.
📈 Price is currently retracing toward the 145.85 – 146.00 short-term supply zone, offering a favourable area for short setups if rejection occurs.
🧠 Trade Scenarios (Planned)
🔻 Priority SELL Setups
SELL at 145.851 – 146.000
SL: 146.351
TP1: 145.351 (+50 pips)
TP2: 144.851 (+100 pips)
TP3: 143.851 (+200 pips)
TP4: Open
This is a fresh supply zone formed post-BOS, ideal for potential short entries upon confirmation.
SELL at 147.750 – 147.950
SL: 148.150
TP1: 147.250 (+50 pips)
TP2: 146.750 (+100 pips)
TP3: 145.750 (+200 pips)
TP4: Open
A key higher timeframe supply zone. If price breaks above 146.3 and rallies further, this is where Smart Money may re-enter shorts.
🔺 Potential BUY Setups Post-Liquidity Sweep
BUY at 143.031 – 142.930
SL: 142.731
TP1: 143.531 (+50 pips)
TP2: 144.031 (+100 pips)
TP3: 145.031 (+200 pips)
TP4: Open
This zone aligns with the trendline and EQL – a possible bounce zone if bullish BOS or strong price rejection appears.
BUY at 142.200 – 142.000
SL: 141.800
TP1: 142.700 (+50 pips)
TP2: 143.200 (+100 pips)
TP3: 144.200 (+200 pips)
TP4: Open
A deeper liquidity pool – likely an institutional entry point if price is flushed prior to NFP data.
📅 Key Upcoming Events – USD/JPY Traders Beware
Tuesday (1 July):
🗣️ Speeches from BOJ Gov Ueda and Fed Chair Powell – high-impact catalysts early in the week.
🧾 ISM Manufacturing PMI, JOLTS Job Openings – insight into the US economy’s momentum.
Wednesday to Thursday (2–3 July):
💼 ADP Employment & Non-Farm Payrolls – major market-moving data to shape USD sentiment.
→ Given the heavy news calendar, it's wise to react to price action at key zones with strong risk management, rather than pre-empt.
USDJPY Potential DownsidesHey Traders, in today's trading session we are monitoring USDJPY for a selling opportunity around 146.700 zone, USDJPY is trading in a downtrend and currently is in a correction phase in which it is approaching the trend at 146.700 support and resistance area.
Trade safe, Joe.
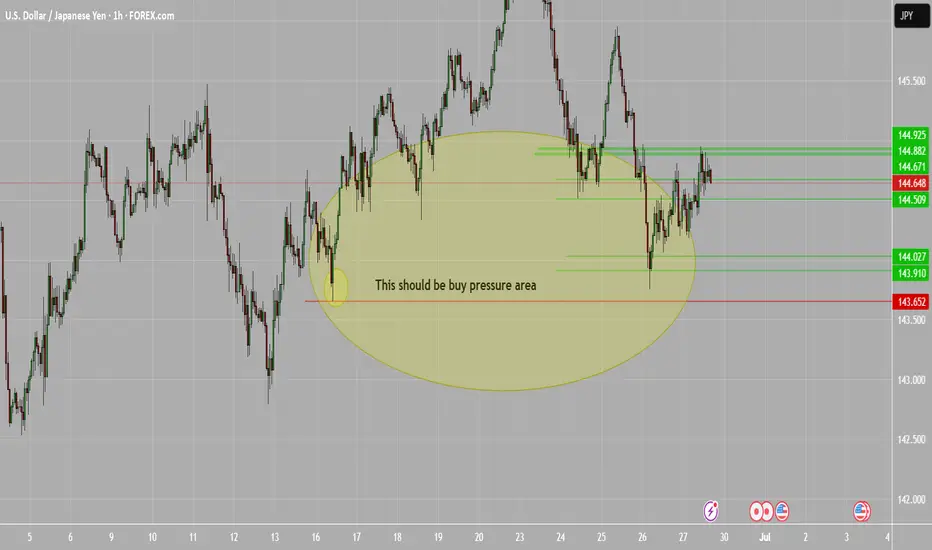
Buy pressure USD/JPYBuyers seeking to continue overall movement to 160 area. From the outside looking in all aspects of final test are being made and have been made at 144 area. This is a good number! Looking even closer, the sellers are selling too fast and are not going to be able to keep up that momentum in comparison to the overall pressure from the bottom. The top has been tested 3 strikes you out. Followed by the long steady ride up with bumps and traps along the way of course. Get your ticket now to get a good seat and watch.
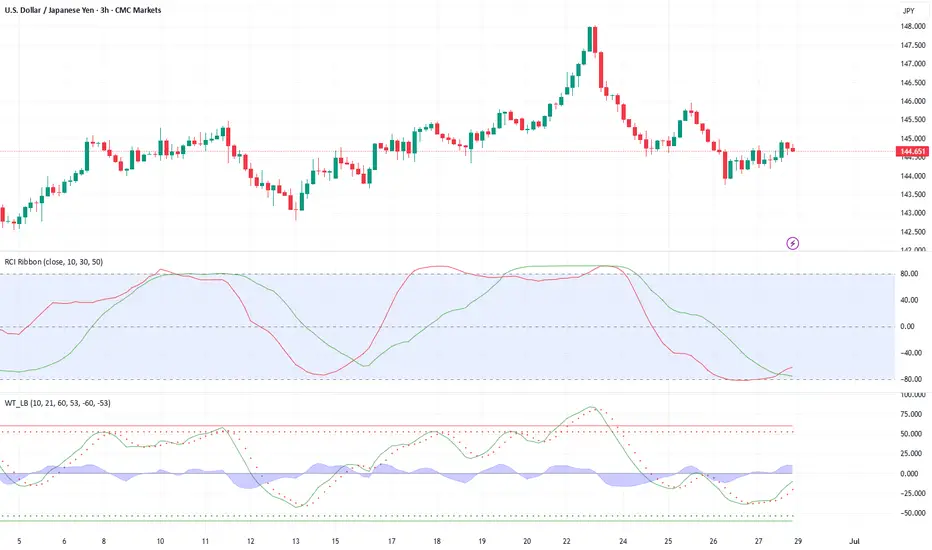
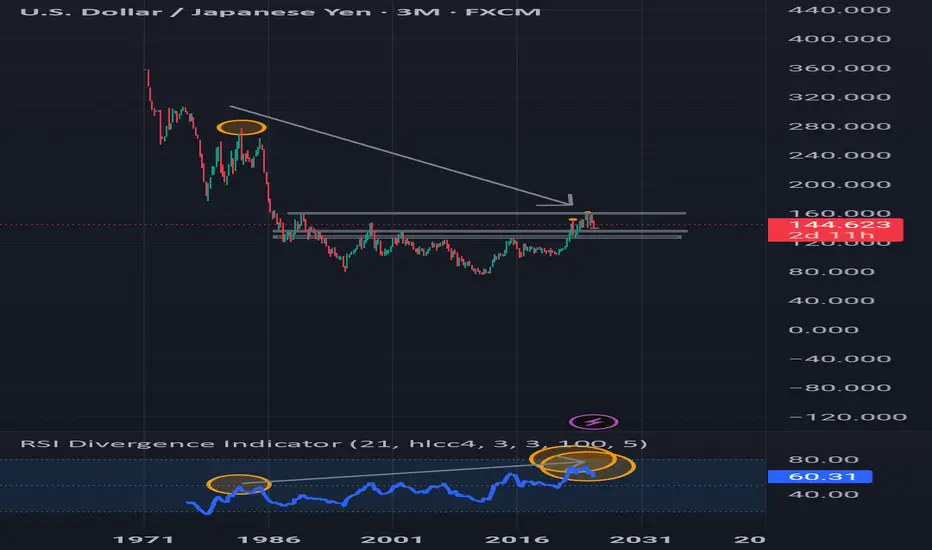
Forecast USDJPY Contrary to popular belief, USD/JPY is structurally in a long-term bearish trend since 1971 on a logarithmic scale. What appears to be a recovery is in fact a technical retracement within a broader secular downtrend.
A historic hidden bearish divergence is forming: the RSI has been gradually rising, while the price continues to print lower highs over the decades. This reflects a momentum squeeze within the bearish structure.
We may be standing at the edge of a major rejection zone, where the long-term downtrend could reassert itself forcefully. The market is quietly preparing for a powerful bearish continuation.
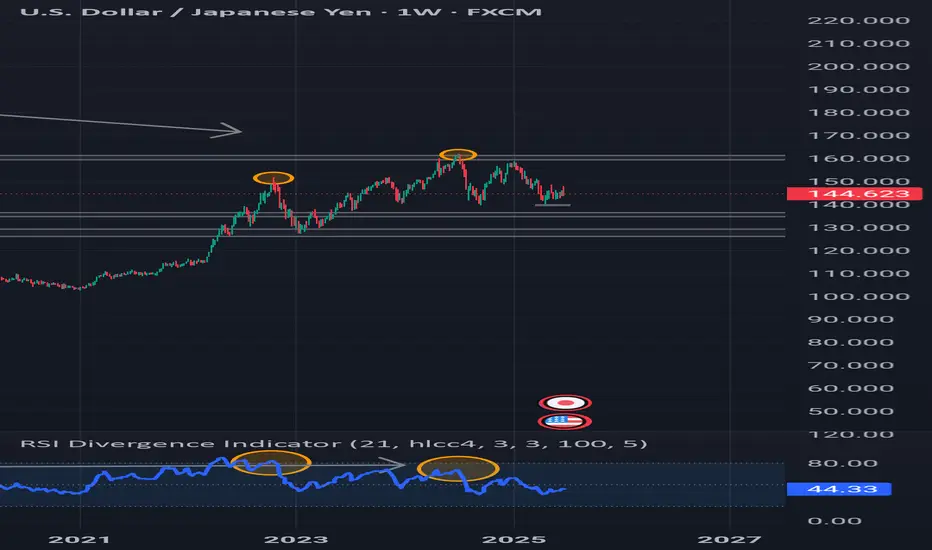
Forecast USDJPY This is not financial advice. Educational purpose only."
I am preparing to take a short position on USDJPY starting next week, in alignment with the upcoming rollover of futures contracts. My analysis is based on a combination of technical, macroeconomic, behavioral, and institutional elements.
From a technical perspective, a clear bearish reversal divergence is visible on the weekly chart using the 21-period RSI based on HLCC/4. While the price is making higher highs, momentum is weakening, indicating a loss of bullish strength. This setup is reinforced by a long-term continuation divergence that has been forming since the major tops of 1971, suggesting a possible terminal phase in the current cycle.
COT data supports this view. Large speculators have been steadily reducing their long positions on USDJPY over recent weeks. More significantly, these same institutional players have begun accumulating long positions on Japanese yen futures (6J), often a precursor to a monetary rotation. The upcoming rollover of futures contracts next week could trigger a more pronounced shift in institutiona positioning.
Macroeconomic data from the United States also confirms a slowdown. Core PCE came in at 0.1%, below expectations. Nonfarm Payrolls underperformed, and the ISM Services Index dropped below 50, signaling contraction. In contrast, Japan maintains stable inflation around 2.3%, which gives the Bank of Japan room to begin policy normalization. The yield differential is starting to narrow, a historically bearish factor for USDJPY.
Finally, market sentiment remains skewed. Retail traders are still heavily positioned long on USDJPY. Such imbalances, where retail crowds are long and institutional players are exiting, often precede sharp reversals.
If the expected institutional reallocation materializes after the futures rollover, I will enter a short position. Technical, fundamental, and cyclical factors are now fully aligned.
"This is a personal market view. Always do your own research before making trading decisions."
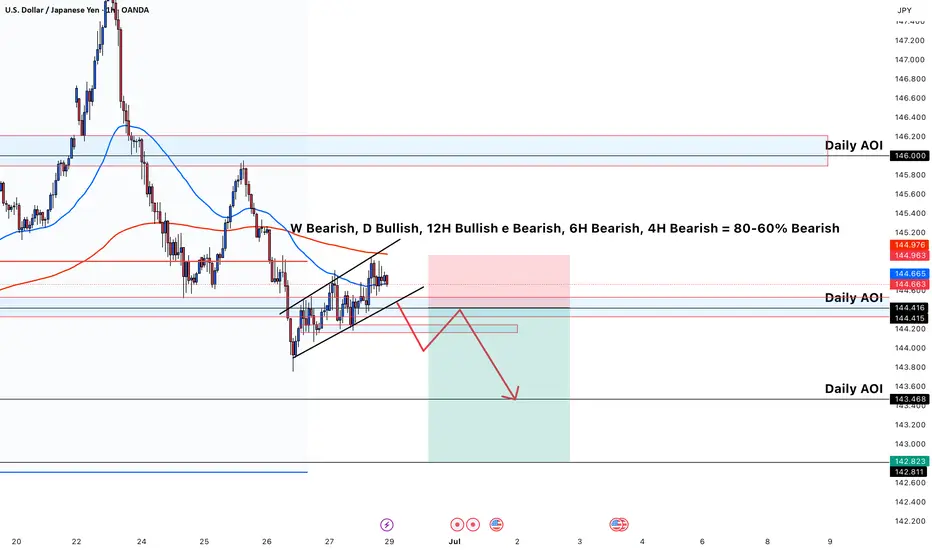
USDJPY Continue Bearish TrendThis USD/JPY chart presents a short bias based on multi-timeframe analysis and structure:
* **Trend Summary (Text on Chart)**:
* **Weekly (W)**: Bearish
* **Daily (D)**: Bullish
* **12H**: Mixed (Bullish & Bearish)
* **6H, 4H**: Bearish
→ Overall sentiment: **60–80% Bearish Bias**
* **Technical Highlights**:
* Price is forming a **rising wedge**, typically a bearish reversal pattern.
* The pair is currently testing a **Daily Area of Interest (AOI)** near 144.665–144.963, suggesting potential resistance.
* Price broke out of the wedge with a projected retest and continuation down.
* Target zone is below **143.468 (Daily AOI)** and extends toward **142.823**, suggesting a potential short setup with a favorable risk/reward ratio.
* Red and blue EMAs indicate price is below the 200 EMA and flirting with the 50 EMA, adding confluence to the short bias.
This analysis implies an anticipated breakdown from the wedge with follow-through to the downside if bearish momentum continues.
Multi-timeframe confluence is mostly bearish:
Weekly, 6H, and 4H are clearly bearish. 12H is mixed, and only the Daily is bullish. This gives an overall 60–80% bearish bias.
Rising wedge pattern:
Price is forming a bearish wedge, typically signaling a reversal or breakdown. It's losing momentum near resistance.
Price is near a Daily Area of Interest (AOI):
The pair is testing a known resistance zone. It has failed to break and hold above it convincingly.
Expecting a break and retest of structure:
You're anticipating the wedge to break down, retest the structure or AOI, and then continue bearish.
Target is aligned with a lower Daily AOI:
You have a clear target near 142.800, where price previously reacted — offering good risk-to-reward for the short.
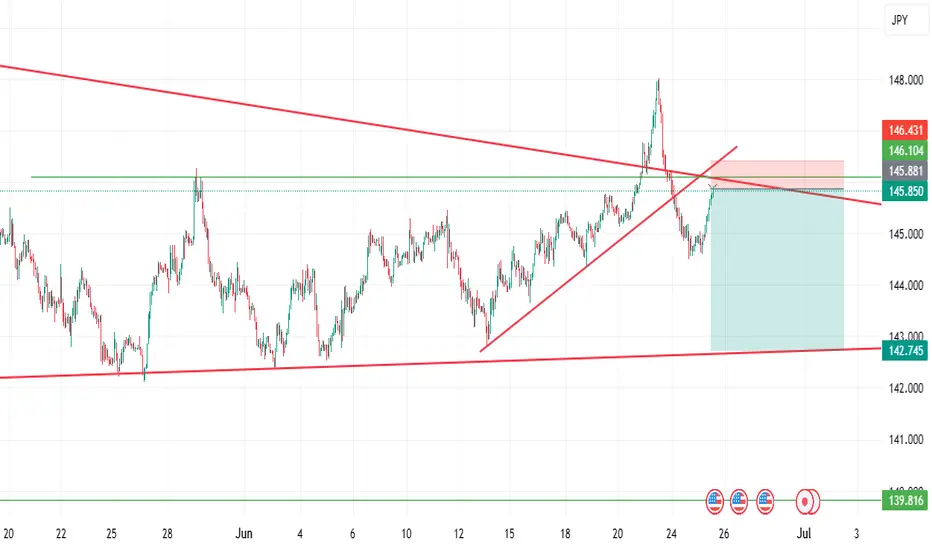
USDJPY is about to be bearish after a long retracement From the chart, you will see that usdjpy is about to sell for a long time.
Reasons;
1] Hanging man in daily timeframe
2] Trendline violation
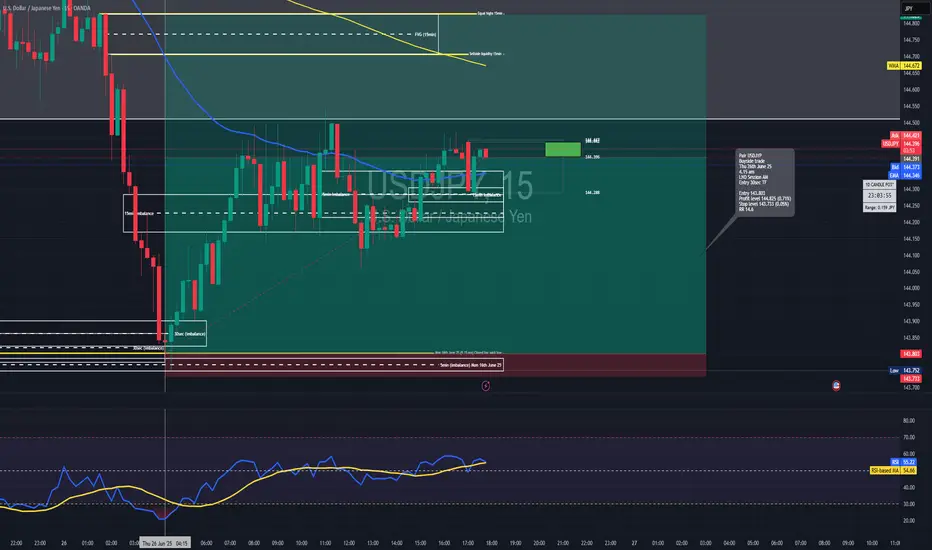
Long trade
30sec TF entry
📍 Pair: USDJPY
📅 Date: Thursday, June 26, 2025
🕒 Time: 4:15 AM (London Session AM)
⏱ Time Frame: 15min
📈 Direction: Buyside
📊 Trade Breakdown:
Metric Value
Entry Price 143.803
Profit Level 144.825 (+0.71%)
Stop Loss 143.733 (−0.05%)
Risk-Reward
Ratio 14.6 : 1
🧠 Context / Trade Notes
🔄 15 Minute Structure Support:
The trade was based on a reactive low from the 5-minute TF, aligning with a buy-side imbalance zone formed on the 5-minute chart (Monday, 16th June, 10:00 AM).
📉 RSI in Low Region:
RSI was observed in an oversold condition on LTFs, providing additional confluence for a short-term reversal setup.
30sec TF entry overview
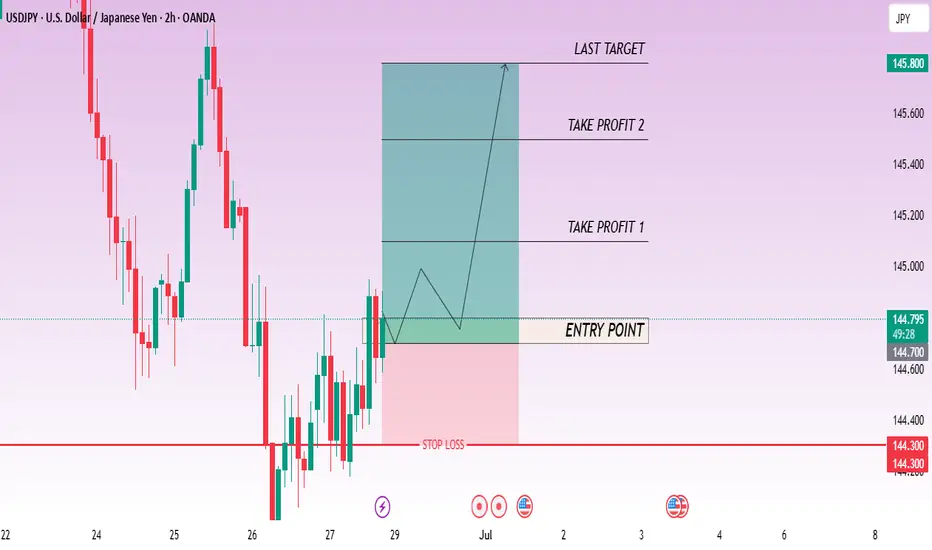
CHECK USDJPY SIGNAL READ CAPTAINbuy Setup)
Entry Zone: Around 144.800\144.700
Stop Loss: 144.300
Take Profits:
TP1: ~145.100
TP2: ~145.500
Final Target: 145.800
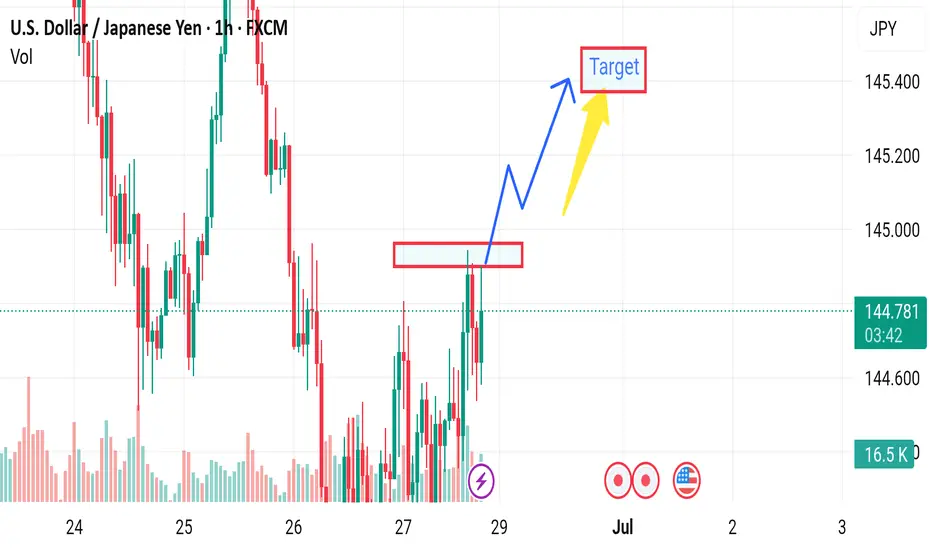
Market next target ⚠️ Disruption & Counterpoints:
1. Premature Breakout Bias:
The chart shows price repeatedly rejecting the resistance zone (highlighted in red).
The arrow assumes a clean breakout without confirmation — this is speculative, as the price hasn’t closed convincingly above the resistance.
This could easily turn into a false breakout or double top if price fails again.
2. Volume Mismatch:
A breakout should be backed by strong bullish volume. However, the current volume is mixed and not showing a clear surge in buyer strength.
Lack of volume confirmation makes the breakout less reliable.
3. Ignoring Recent Rejections:
The red zone was tested multiple times in the last sessions without success. That typically signals strong supply or institutional selling.
Repeating this setup without accounting for historical failure adds downside risk.
4. Missing Bearish Scenario:
No alternate path is considered. A failed breakout could lead to a pullback toward 144.00 or lower, especially with U.S. news events (indicated by the flag).
A balanced analysis should always prepare for both breakout and rejection.
5. Macroeconomic Event Risk:
Similar to the GBP/USD chart, this one also shows an upcoming U.S. economic event. That could heavily move USD/JPY, and technical setups may become invalid fast.
The analysis ignores the need to wait for the news catalyst or confirmation after the release.
USDJPY Buy scalp analysis and sell swing analysisThis analysis is based on the daily and 4-hour timeframes and executed using reversal trading, trend formation, and supply and demand trading. Full explanation in the video!

Yen rises sharply, Tokyo Core CPI nextThe Japanese yen has edged higher on Friday. In the North American session, USD/JPY is trading at 144.57, up 0.16% on the day.
Tokyo Core CPI surprised on the downside in June, falling to 3.1% y/y. This was down sharply from the 3.6% gain in May and below the market estimate of 3.3%. This was the the first slowdown in Tokyo core inflation since February. The decline was largely driven by a renewal of fuel subsidies and a reduction in water charges.
Despite the drop, core inflation remains well above the Bank of Japan's 2% target, maintaining expectations for another rate hike in the second half of the year. BoJ Governor Ueda has signaled that the Bank will raise rates if it is confident that wage growth is sustained, which is critical to maintaining inflation at the 2% target. However, this week's BOJ Summary of Opinions showed that some members are more dovish, given global trade tensions and the bumpy US-Japan trade talks. Japan has said it will not agree to US tariffs of 25% on Japanese cars, and six rounds of talks in the past two months have failed to produce a deal.
The Core PCE Price Index, the Fed's preferred inflation indicator, accelerated in May and was higher than expected. The index rose 2.7% y/y up from an upwardly revised 2.6% in May and above the consensus of 2.6%. Monthly, the index rose 0.2%, up from 0.1% which was also the consensus. This was a three-month high and will boost the case for the Fed to leave interest rates unchanged at the July meeting.
USD/JPY faces resistance at 144.49 and 144.64
144.31 and 144.16 are the next support levels
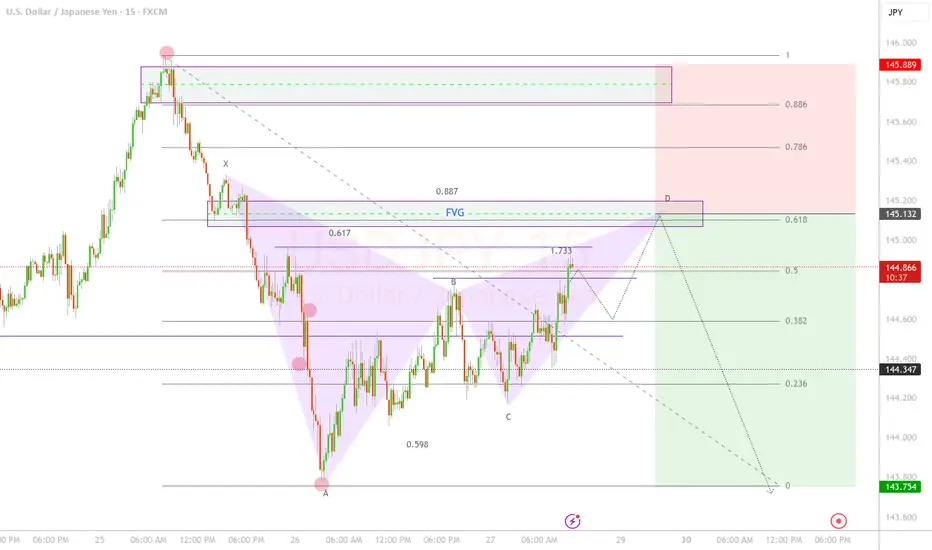
USD/JPY Bearish Gartley Pattern Completion - SELL SETUP
📊 Trade Overview
Pair: USD/JPY
Pattern: Bearish Gartley
Timeframe: 15 minutes
Direction: SHORT
Setup Type: Harmonic Pattern Completion + FVG Confluence
🎯 Market Analysis
The price is evidently bearish according to market structure, currently in a retracement phase, and I expect a bearish continuation at the 61.8 Fibonacci level of the wave.
The harmonic pattern establishes an 88.6 Fibonacci ratio for bearish entry with a balanced and low-risk R/R of 1:1.82 (profit - risk).
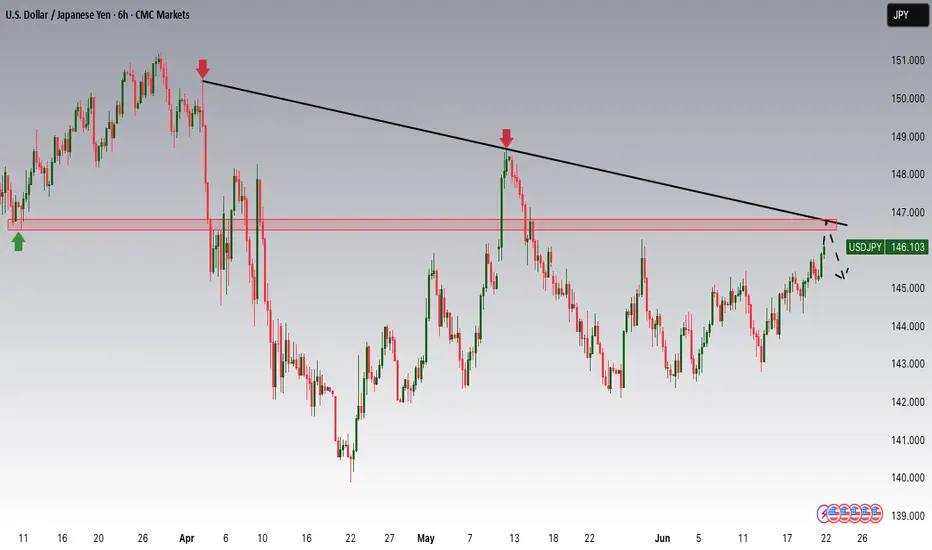
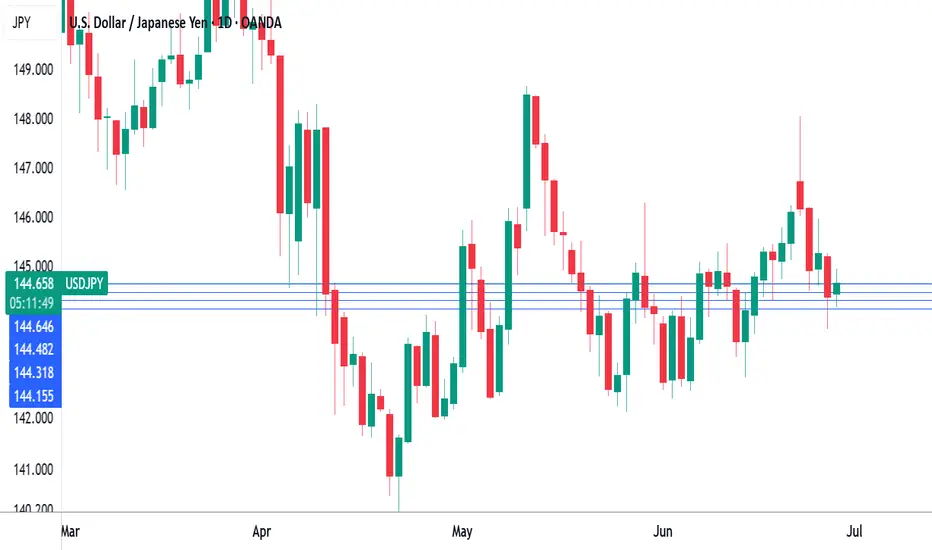
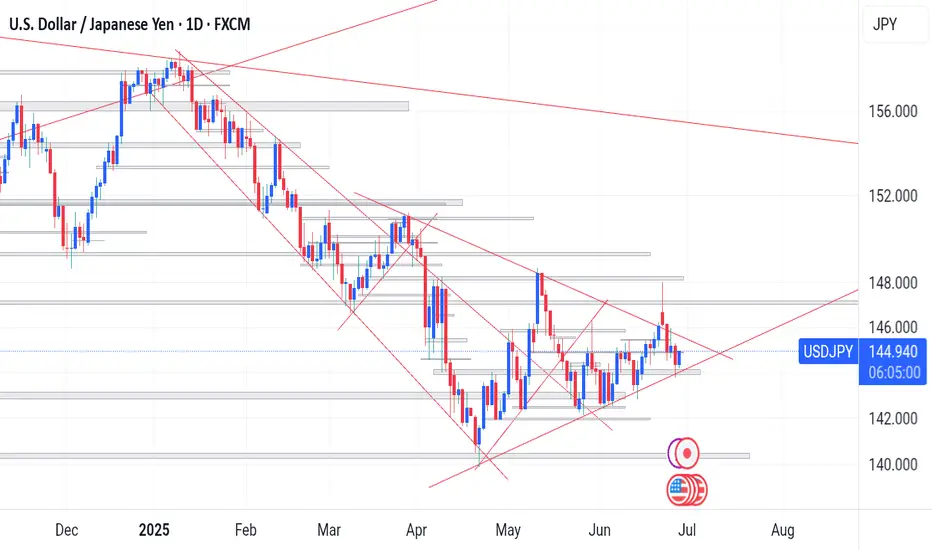
Usdjpy D_TF, A symmetric triangle USD/JPY Daily Timeframe Analysis
A symmetrical triangle pattern has formed on the daily chart, indicating that a potential breakout could occur in either direction. If the pattern plays out, we should be looking for a breakout and retest of the trendline towards the downside.
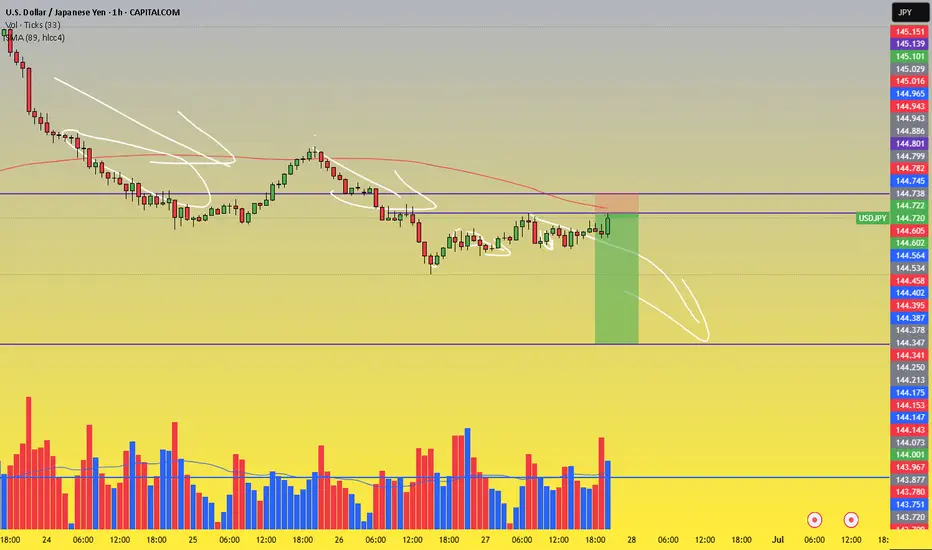
SELL: USDJPY 144.75 Trade Recommendation – 1H Chart🎯 Trade Setup:
Sell Entry Zone: 144.75 – 144.78
Stop Loss (SL): 145.15
Take Profit (TP): 142.60
Risk:Reward Ratio (R:R): Approx. 1:4 → Excellent for swing or intraday setups
📊 Technical Analysis Breakdown:
1. Strong Resistance Zone – High Reversal Probability:
The 144.75–144.78 zone:
A clear historical resistance area with multiple rejections in the past
Converges with the SMA 89 (red line) → acts as a strong dynamic resistance
Price has consistently formed lower highs around this region → showing selling pressure is building
2. Volume Analysis – Distribution Signals:
Volume slightly increased as price approached the resistance but did not accompany a breakout
No “breakout volume” → Indicates possible distribution phase, not accumulation → Favoring SELL positions
3. Price Action & Pattern:
The structure is forming lower highs – a key sign of bearish momentum
After the sharp rejection from the 145.22 zone (June 26), the market has shifted toward a bearish correction cycle
4. Target Area – Key Support:
142.60 is a well-defined support level:
Matches a previous major low
Corresponds with a high-liquidity zone from prior trading sessions
Ideal area to take profit before any potential bounce
⚠️ Risk Management Notes:
Trade confirmation increases if you see bearish candlestick signals (e.g., bearish engulfing, pin bar) in the entry zone
Exit immediately if price breaks and closes above 145.15 with strong volume – that invalidates the bearish setup
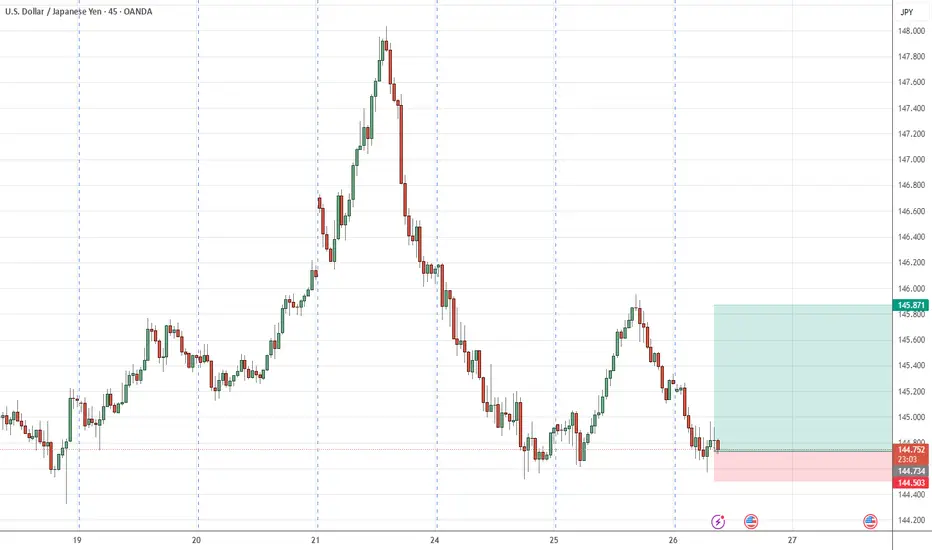
USDJPY 15M BUY FRIDAY DELIGHT LOLEvery pips count Scalping 15m
Reason to buy
Strong SUPPORT 144.22
Lets hope we get PAID @ THIS LOVELY SUNNY LONDON :))))
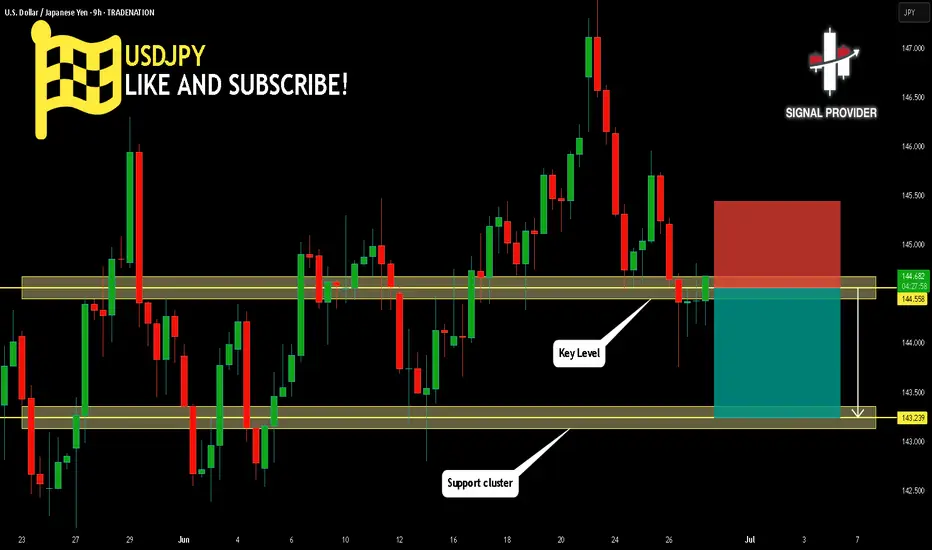
USDJPY Will Go Lower From Resistance! Sell!
Take a look at our analysis for USDJPY.
Time Frame: 9h
Current Trend: Bearish
Sentiment: Overbought (based on 7-period RSI)
Forecast: Bearish
The market is testing a major horizontal structure 144.558.
Taking into consideration the structure & trend analysis, I believe that the market will reach 143.239 level soon.
P.S
Overbought describes a period of time where there has been a significant and consistent upward move in price over a period of time without much pullback.
Disclosure: I am part of Trade Nation's Influencer program and receive a monthly fee for using their TradingView charts in my analysis.
Like and subscribe and comment my ideas if you enjoy them!