USDJPY InsightHello to all our subscribers.
Please share your personal opinions in the comments. Don't forget to boost and subscribe.
Key Points
- Iran launched a total of 14 missiles toward U.S. air bases, but most were intercepted. U.S. President Trump stated, "I want to thank Iran for giving advance notice and ensuring there were no casualties or injuries," and the market interpreted the event as a "staged confrontation" where Iran saved face.
- President Trump said on Truth Social, “Israel and Iran have fully agreed to a comprehensive and complete ceasefire.” Reuters, citing a senior Iranian official, reported that Iran accepted the ceasefire proposal mediated by Qatar and suggested by the United States.
- Iranian Deputy Foreign Minister Abbas Araghchi stated that "if Israel halts its 'illegal attacks' on Iran by 4 a.m. on the 24th (Tehran time), Iran has no intention to further respond." Israel has not yet made an official statement.
- Federal Reserve Vice Chair Bowman said, “If inflationary pressures continue to ease, I will support lowering the policy rate as early as the next meeting to bring it closer to a neutral level and to maintain a healthy labor market.”
Key Economic Events This Week
+ June 24: Testimony by Fed Chair Jerome Powell
+ June 25: Testimony by Fed Chair Jerome Powell
+ June 26: U.S. Q1 GDP
+ June 27: U.S. May PCE Price Index
USDJPY Chart Analysis
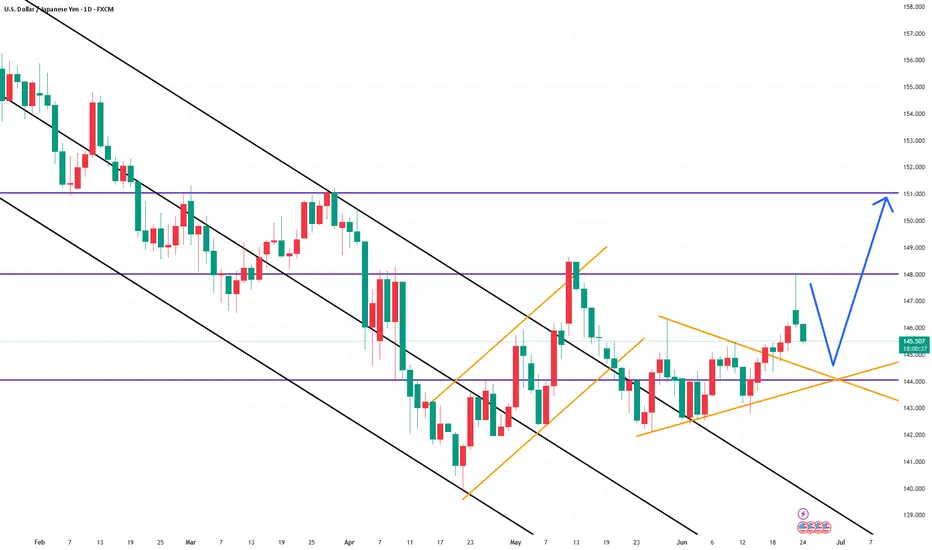
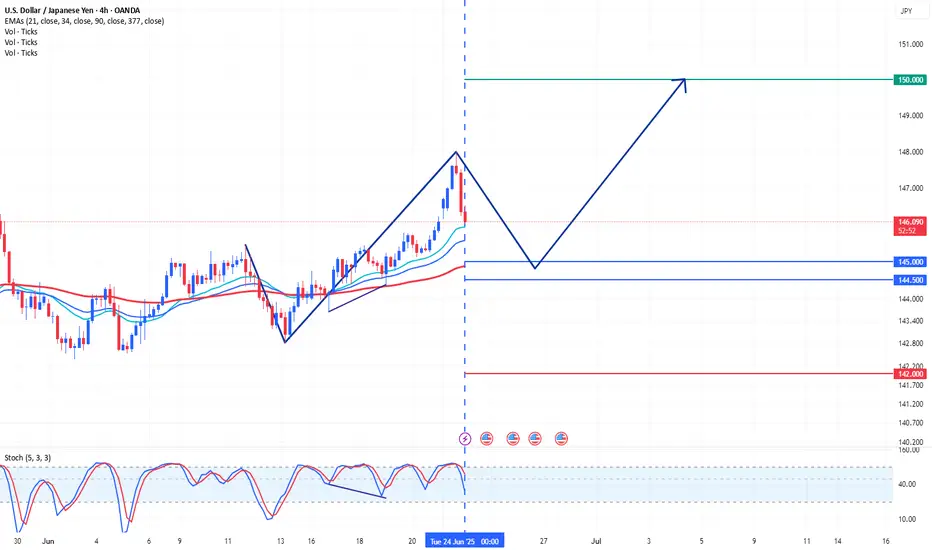
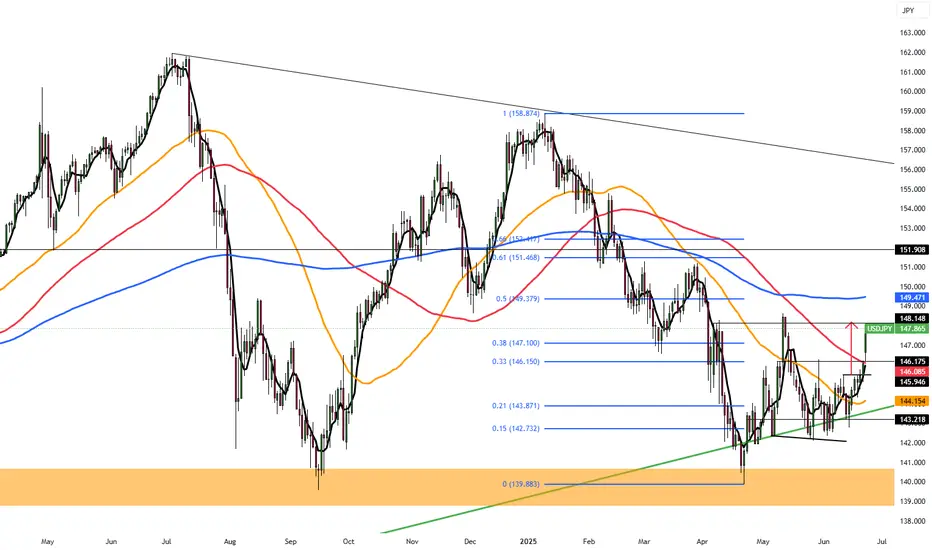
After breaking through the 145 level, the pair showed a sharp upward move and formed a peak around the 148 level before reversing downward. It is expected to form a bottom in the 144–145 range during this pullback and potentially rise to the 151 level. However, if it unexpectedly breaks below the 144 level, there is also a possibility it could fall to around 140.
USDJPY trade ideas
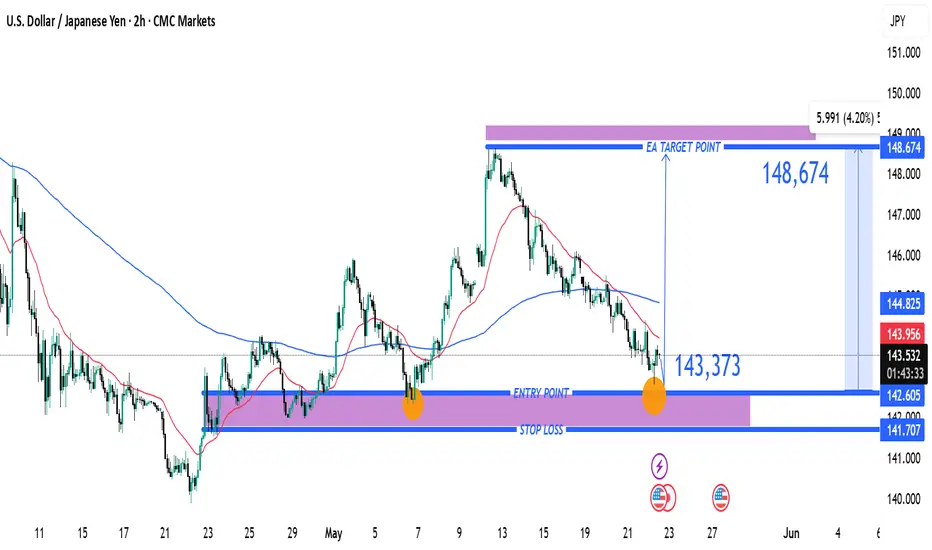
USD/JPY Long Trade Setup – Key Support Rebound Targeting 148.674Entry Point:
Price: 143.373
The chart suggests initiating a long (buy) position at this level, which is just slightly below the current market price.
Stop Loss:
Price: 141.707
Positioned below a strong support zone. This level protects the trade from excessive downside risk if the price breaks down.
Target Point:
Price: 148.674
The target is clearly defined, indicating a potential gain of approximately 5.991 points, or 4.20% from the entry.
🟪 Support/Resistance Zones
The purple boxes indicate demand (support) and supply (resistance) zones.
The lower zone (entry/stop area) shows a historically significant support range that has been tested multiple times (indicated with orange circles).
The upper purple zone marks the take-profit area, which coincides with previous resistance.
📊 Moving Averages
Blue Line: 200 EMA (Exponential Moving Average) – acting as dynamic resistance.
Red Line: 50 EMA – price is currently trading below it, indicating bearish short-term pressure but potential for reversal.
🧠 Trade Idea Summary
Bias: Bullish (long position)
Risk-Reward Ratio: Favorable
Risk: ~1.67 points (from 143.373 to 141.707)
Reward: ~5.3 points (from 143.373 to 148.674)
Approx. R:R = 1:3.17
Validation: The setup relies on the price holding the key support zone and bouncing higher, targeting the next major resistance.
⚠️ Considerations
Monitor for bullish candlestick patterns near the entry zone.
Keep an eye on macroeconomic news (like BoJ or Fed updates) that could cause volatility in USD/JPY.
Confirm momentum shift with RSI or MACD if using indicators.
USDJPY BUY OPPORTUNITY Am selling a buy Opportunities on USDJPY
Entry:
Stoploss
Take profit:
Always wait for chart pattern and Price action arround the entry before clicking the buy button
Comment your opinion pls.
For Account management. Contact me on X @shajudeakinoba1
Trading Ideas USDJPY 4H [Disc On]Technical Analysis:
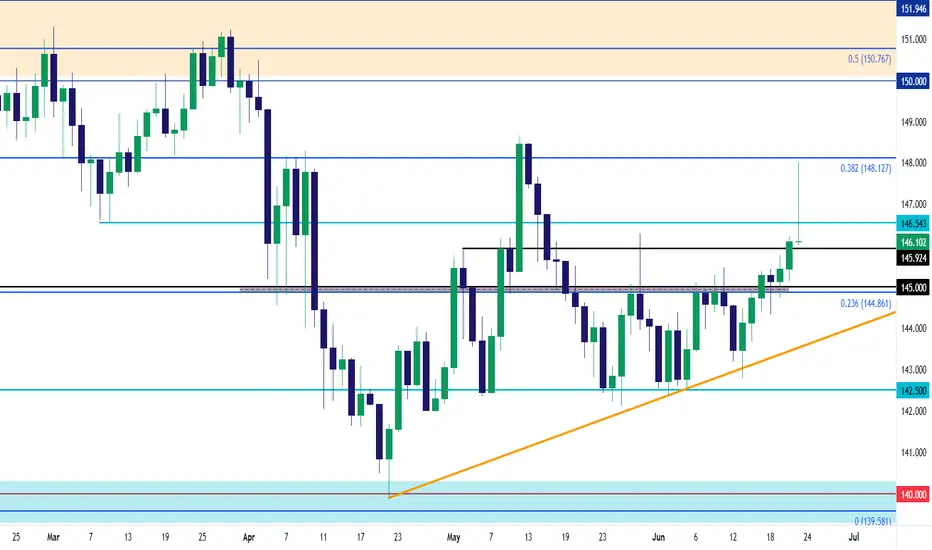
The presence of a Hidden Bullish Divergence on the 4-hour timeframe suggests a strong likelihood of bullish trend continuation. Additionally, the price has broken through a key support level on the 1-hour chart, with upside potential targeting the Fibonacci cluster at the psychological zone of 144.500–145.000 .
Conclusion:
A BUY opportunity is favored, with entry consideration around the 144.500–145.000 Fibonacci cluster zone. Suggested risk management includes a stop loss at 142.000 and a take profit target at 150.000.
技术分析:
在4小时周期中出现隐藏的看涨背离,表明上涨趋势有较大延续的可能性。同时,价格已突破1小时图中的关键支撑位,上行目标指向 144.500–145.000 的斐波那契密集区域(心理价位区间)。
结论:
当前倾向于寻找BUY机会,入场参考区域为斐波那契密集区144.500–145.000。建议设置止损位于142.000,目标价为150.000,以控制风险并优化利润空间。
OANDA:USDJPY
USD/JPY Breakout Fake Out - 148 RejectionBulls had an open door to make a run after this week's open but, so far, they've failed at the same 148.00 handle that snared buyers back in May.
The daily bar at this point is brewing up a gravestone doji but there's still a couple hours left until the close of trading for the day, and this could end up as a pin bar.
Behind the push is rate cut potential in the U.S. After Powell sounded cautious around tariffs last week, the potential for geopol risk and higher oil prices brought another inflationary factor to the fold.
But shortly after the U.S. open this morning Michelle Bowman said she was ready to cut rates in July, and that prodded a sell-off in the USD that has made a noticeable dent in USD/JPY.
Bulls aren't completely out of the equation yet, however, as supports exist at 145.92 and the 144.86-145.00 zone. If sellers sink through that, however, topside potential would dim.
But, notably, chasing breakouts in USD/JPY, in either direction, continues to be a challenging way of dealing with the pair. - js
Yen slides on oil supply jitters after US attack on IranThe Japanese yen has started the week with sharp losses. In the European session, USD/JPY has jumped 1.2% on the day and is trading at 147.82. The yen has fallen to five-week lows against the US dollar.
The fallout from the US attack on Iranian nuclear facilities over the weekend is being felt in the currency markets. The Japanese yen, traditionally a safe-haven currency, continues to depreciate, in response to rising oil prices.
Oil prices rose to their highest level since January on Monday after the US attack on Iranian nuclear facilities. Iran has threatened to close the Straits of Hormuz, a critical trade route through which 20% of the world's oil supply passes through each day. Oil prices have jumped about 10% since the Israel-Iran war started on June 13 and fears of a disruption to oil supply could further boost oil prices.
As oil prices have climbed, the yen has lost ground, declining 3.0% since the Israel-Iran war started. Japan imports almost all of its oil and the rise in oil prices is hurting Japan's trade balance.
Japan's core inflation rate climbed 3.7% y/y in May, up from 3.5% in April. Core CPI has accelerated for a third straight month and hit its highest level since Jan. 2023. This was above the market estimate of 3.6%. Headline inflation ticked lower to 3.5% from 3.6% in April, below the forecast of 3.6%.
The rise in core CPI supports the case for the Bank of Japan to boost interest rates, but the uncertainty over tariffs and the Israel-Iran war will likely mean that the BoJ will stay on the sidelines in the coming months.
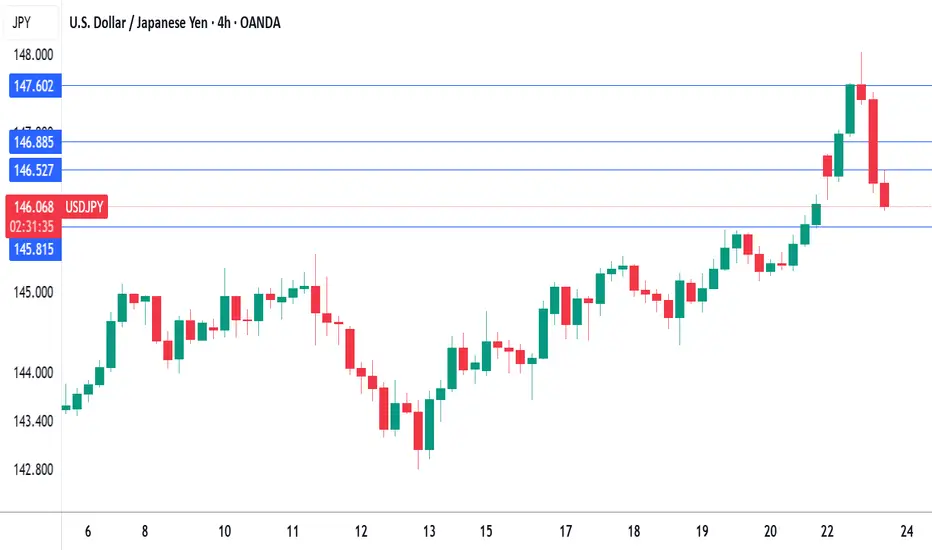
There is resistance at 146.91. Next, USD/JPY is testing resistance at 147.61
146.51 and 145.81 are the next support levels
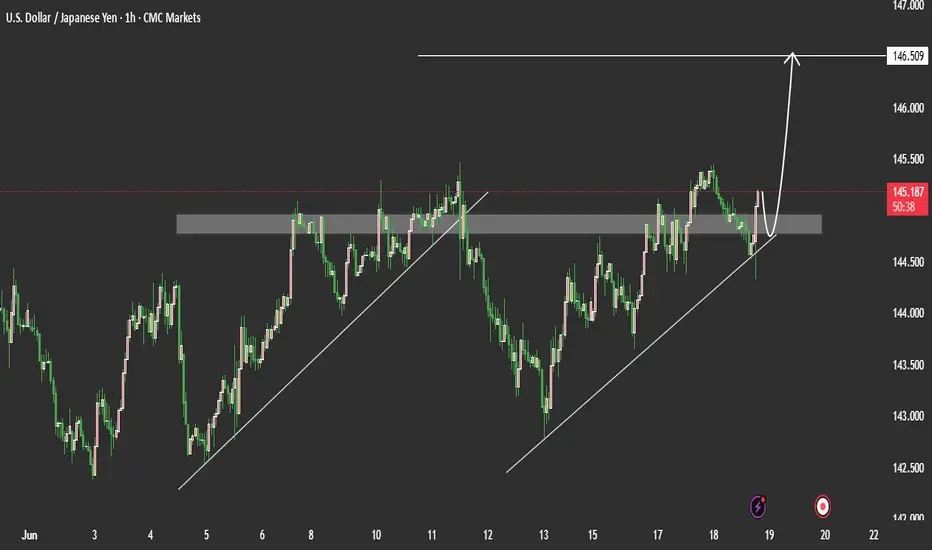
USDJPY Price Breakout Strong Bullish FormedUSDJPY is approaching a retest of the support level after rebounding from a recent wedge breakdown. The pair has reclaimed structure within a broader ascending channel, indicating buyers are stepping in around key levels.
🎯 Potential Target:
If the pair continues to hold above support and breaks minor resistance, the next key upside target is 146.500.
you may find more details in the chart Ps Support with like and comments for better analysis Thanks.
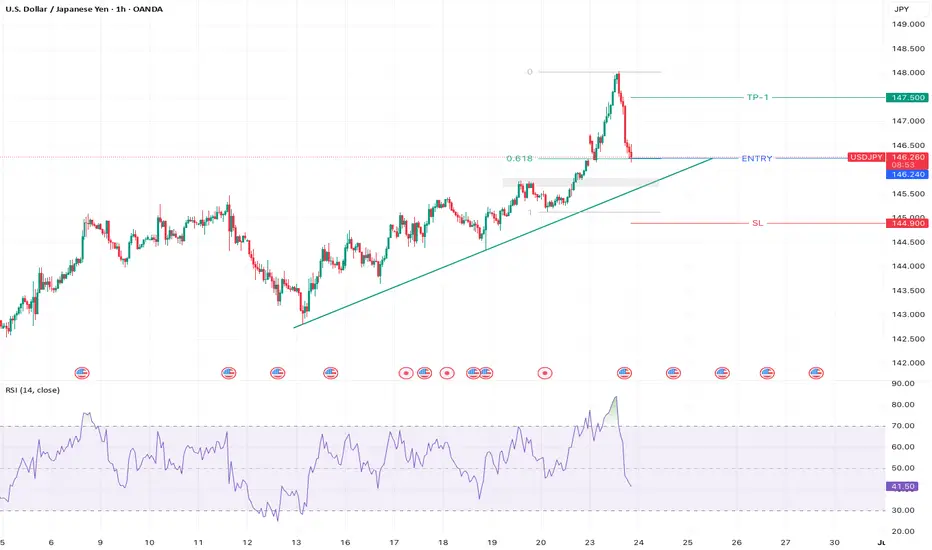
USDJPY - BullishUSDJPY is in Bullish trend and currently testing its Fib level of 0.618. Buying at current levels with SL below last low.
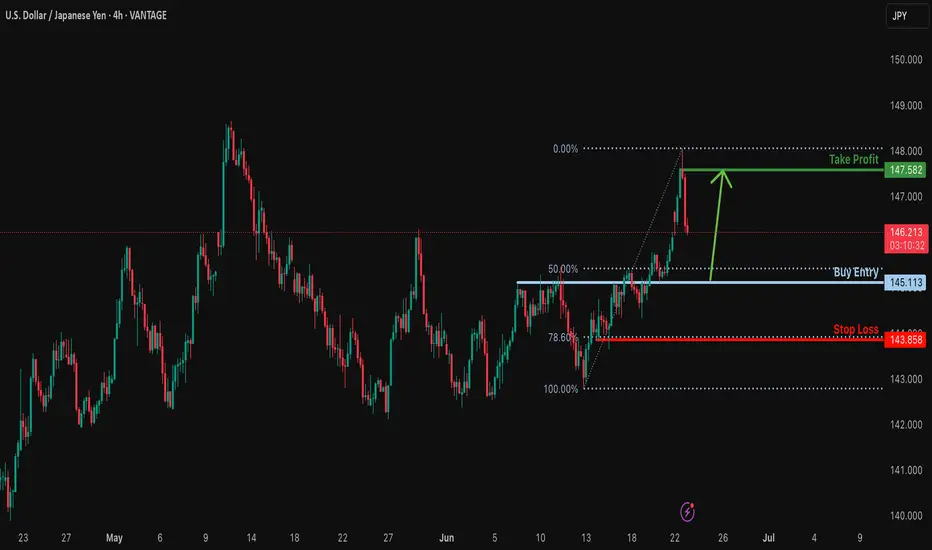
Falling towards pullback support?USD/JPY is falling towards the support level which is a pullback support that is slightly below the 50% Fibonacci retracement and could bounce from this level to our take profit.
Entry: 145.11
Why we like it:
There is a pullback support level that is slightly below the 50% Fibonacci retracement.
Stop loss: 143.85
Why we like it:
There is a pullback support level that lines up with the 78.6% Fibonacci retracement.
Take profit: 147.58
Why we like it:
There is a pullback resistance level.
njoying your TradingView experience? Review us!
Please be advised that the information presented on TradingView is provided to Vantage (‘Vantage Global Limited’, ‘we’) by a third-party provider (‘Everest Fortune Group’). Please be reminded that you are solely responsible for the trading decisions on your account. There is a very high degree of risk involved in trading. Any information and/or content is intended entirely for research, educational and informational purposes only and does not constitute investment or consultation advice or investment strategy. The information is not tailored to the investment needs of any specific person and therefore does not involve a consideration of any of the investment objectives, financial situation or needs of any viewer that may receive it. Kindly also note that past performance is not a reliable indicator of future results. Actual results may differ materially from those anticipated in forward-looking or past performance statements. We assume no liability as to the accuracy or completeness of any of the information and/or content provided herein and the Company cannot be held responsible for any omission, mistake nor for any loss or damage including without limitation to any loss of profit which may arise from reliance on any information supplied by Everest Fortune Group.
USDJPY H2 Best Level to SHORT/HOLD TP +100/+200 pips🏆USDJPY H2 Market Update H2 chart
📊 Technical Outlook
🔸trading in well defined range
🔸trading near range highs now
🔸range highs set 148.40/148.80
🔸range lows set at 140.80/141.40
🔸strategy: SHORT SELL from resistance
🔸SL 60 pips TP1 +100 pips TP2 +200 pips
🔸swing trade setup for patient traders
🌍 FX Market Snapshot — June 2025
🇪🇺 EUR/USD (~1.1500)
Euro climbs near 1.15 as eurozone inflation cools and ECB turns more dovish.
Stable German sentiment provides support, but softer CPI could limit gains.
🔑 Support: 1.1445 | Resistance: 1.1550
🇬🇧 GBP/USD (~1.3435)
Pound slips toward 1.34 after recent highs, as UK data remains mixed.
Manufacturing picks up, but falling inflation boosts BoE rate cut bets.
🔑 Support: 1.3400–1.3420 | Resistance: 1.3500
🇺🇸 DXY (US Dollar Index, ~99.14)
Dollar edges higher as investors seek safety amid geopolitical tensions.
Mixed US economic signals; eyes on upcoming job data.
🔑 Support: 98.80 | Resistance: 100.00
🇯🇵 USD/JPY (~147.4)
Dollar rallies above 147 as yen weakens; BOJ stays ultra-loose.
Oil price spikes add extra pressure on JPY.
🔑 Support: 145.0 | Resistance: 148.5
📊 Quick View
Pair Rate Support Resistance Key Theme
🇪🇺 EUR/USD ~1.1500 1.1445 1.1550 Dovish ECB, soft CPI
🇬🇧 GBP/USD ~1.3435 1.3400–1.3420 1.3500 Mixed UK data
🇯🇵 USD/JPY ~147.4 145.0 148.5 Yen weakness
🇺🇸 DXY ~99.14 98.80 100.00 Geopolitical risks

USDJPY BULLISHTechnically:
USDJPY is bullish trend after printing it higher high it retrace and also retest it resistance zone which will most likely become support and also 0.5 fib retracement

USDJPY MULTI TIME FRAME POV + XAUUSD , GU RECAP Hello traders , here is the full multi time frame analysis for this pair, let me know in the comment section below if you have any questions , the entry will be taken only if all rules of the strategies will be satisfied. wait for more price action to develop before taking any position. I suggest you keep this pair on your watchlist and see if the rules of your strategy are satisfied.
🧠💡 Share your unique analysis, thoughts, and ideas in the comments section below. I'm excited to hear your perspective on this pair .
💭🔍 Don't hesitate to comment if you have any questions or queries regarding this analysis.

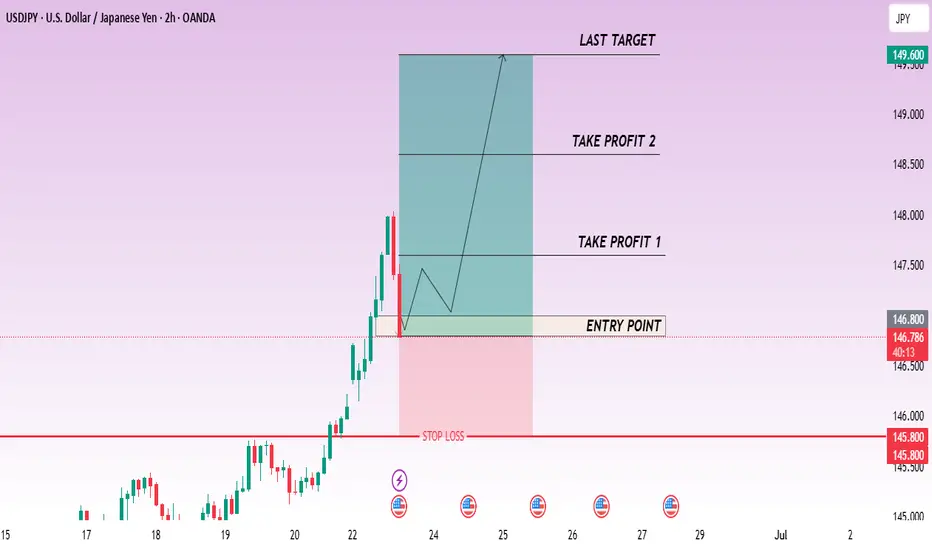
CHECK USDJPY SIGNAL READ CAPTAINusdjpy buy now ✅
entry point (147.000) (146.800)
TAKE PROFIT 1: (147.600)
TAKE PROFIT 2: (148.600)
LAST TARGET(149.600)
STOP LOSS (145.800)
USDJPYLooking at this chart after I just did the EURJPY analysis, now this one looks more bullish than bearish BUT that's only if there is a breakout from the supply zone which Im assuming will give us a consolidation first before it shoots straight up to complete Wave 5. At the completion of Wave 5, we can expect the drop again as a correction and retest, which should usher in more buyers to form a Cup and Holder pattern. I really see the JPY being stronger than USD futuristically and practically.

Quick Forex Market Overview | USDJPY, GBPUSD, CADJPY, EURUSD...In this video, I give an unstructured but insightful overview of the current market conditions across several major forex pairs. I walk through key price action and technical levels on USDJPY, GBPUSD, CADJPY, EURJPY, EURUSD, and EURAUD — sharing what I’m seeing in the moment and how the setups are developing.
Perfect if you're looking for a raw, real-time perspective without the fluff.

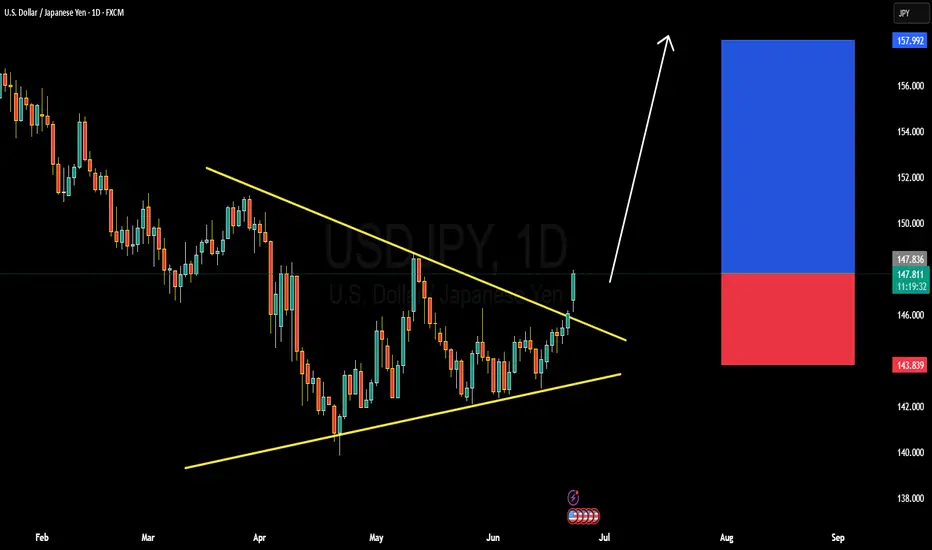
SDJPY BULLISH OR BEARISH DETAILED ANALYSISUSDJPY has successfully broken out of the symmetrical triangle structure that has been forming since early April, with today’s daily candle showing strong bullish momentum above the resistance zone around 147.500. The breakout is clean and backed by volume, which suggests that bulls are in full control. Price action is respecting the trendline structure and has now confirmed a fresh higher high, setting the stage for the next bullish leg. My immediate upside target for this move stands at 157.900.
Fundamentally, the divergence between the Federal Reserve and the Bank of Japan continues to widen. The Fed remains hawkish with inflation still sticky in the US and interest rate cuts being pushed further out. In contrast, the Bank of Japan remains ultra-dovish, with no major policy tightening in sight and continued yield curve control. This policy mismatch is keeping the Yen under consistent selling pressure. Additionally, Japan's core inflation slipped again this week, further reducing the probability of any BOJ rate hike this quarter.
The technical breakout aligns perfectly with the macro narrative. A strong bullish candle breaking structure on the daily suggests momentum will likely continue. With no strong resistance until the 157.900 area, this setup offers a high-conviction long opportunity. Traders should watch for minor pullbacks toward 147.000–146.800 as potential re-entry or add-on zones.
With rising US bond yields, weak Japanese fundamentals, and breakout confirmation on the chart, USDJPY is now well-positioned for a continuation rally. This is a trend-following setup with solid fundamentals and momentum confirmation—ideal conditions for a profitable move in the current forex environment.
U
Yen Falls Despite Japan’s Manufacturing ReboundThe yen fell past 146 on Monday, its lowest in over five weeks, as the US dollar gained on safe-haven demand after US airstrikes on Iranian nuclear sites escalated Middle East tensions. Domestically, Japan’s manufacturing sector grew in June for the first time since May 2024, and services expanded for a third straight month, showing economic resilience.
The key resistance is at $148.15 meanwhile the major support is located at $146.15.
UJ: Could we see a bearish leg looking at the 4h?USD/JPY is currently trading at a key price level of 147.5. We've got a 4h order block about 75 pips to the downside at 146.75.
If we see some lower time frame confirmations, we could potentially see a bearish leg towards this 4h OB today.
- Aman
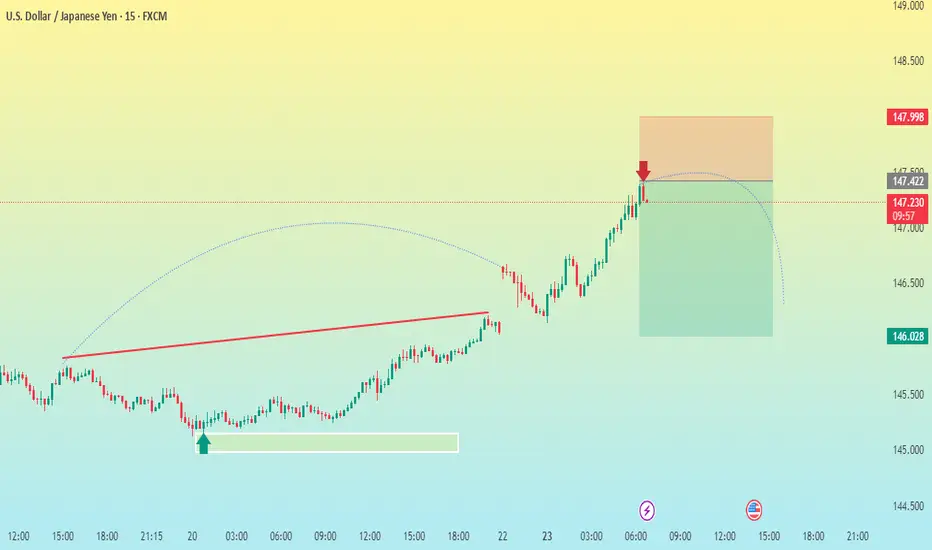
USDJPY 15m H&S CORRECTION Quick trade on this H&S formation (GOOD RISK REWARD)
Plant to buy back if plays out @ 146.742
LONG TERM STILL BULLISH,
This will be just quick earner if plays out
Holla

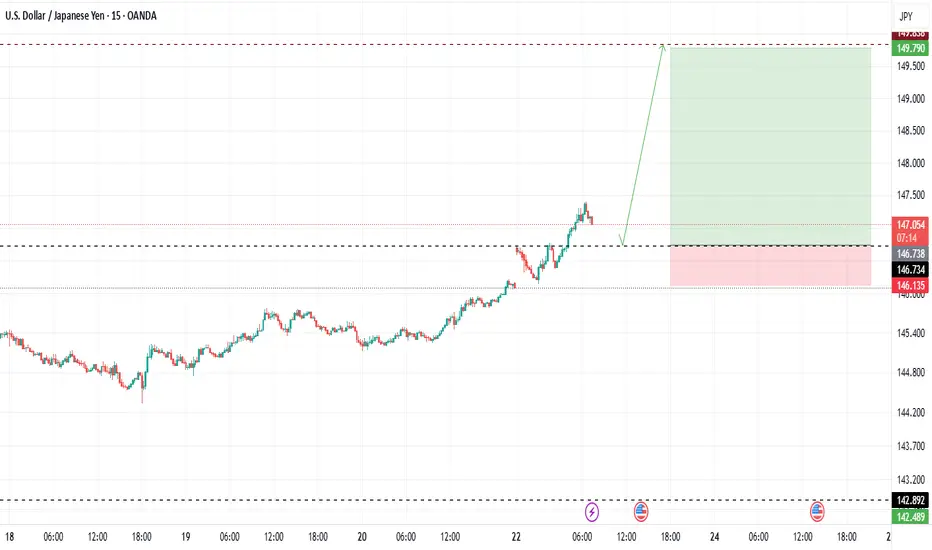
USDJPY BULLS DONT PLAY STILL LONG WAY TO GOOOWaiting for PULL BACK @ around 146.73 (that will be my buy entry)
This trade its straight forward, i have only 1 target @ 149.79
All the best TRADERS
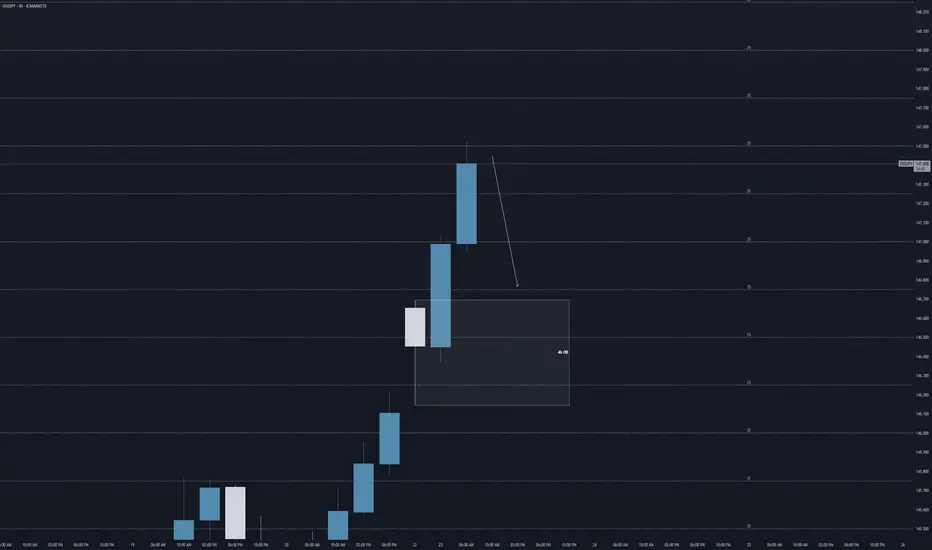
USD/JPY 15M CHART PATTERNHere’s a breakdown and analysis of your USDJPY SELL trade setup on the 15-minute timeframe:
---
Trade Details:
Entry: 147.280 (Short)
Stop Loss (SL): 147.998 (≈71.8 pips risk)
Targets:
T1: 146.960 (≈32 pips)
T2: 146.600 (≈68 pips)
T3: 146.019 (≈126 pips)
---
Risk/Reward Ratios:
Target Reward (pips) R:R Ratio
T1 32 ~0.45:1
T2 68 ~0.95:1
T3 126 ~1.75:1
---
Quick Technical Evaluation (Assuming standard price behavior):
Entry near local high? If yes, solid idea to sell after rejection/candle confirmation.
SL Placement: 147.998 is quite wide—possibly above a recent high or resistance zone.
T1 is relatively close, offering a partial TP level but low reward/risk.
T2 provides near 1:1 R:R, which is more balanced.
T3 is aggressive and may require a strong bearish continuation or news catalyst.
---
Suggestions:
1. Adjust SL? – If the 147.998 level isn’t key resistance, consider tightening it closer to the swing high (e.g., 147.400–147.500) to improve R:R.
2. Scaling Out – Consider closing part of the position at T1 or T2, then letting the rest run to T3.
3. Monitor Price Action – On the 15m chart, look for bearish continuation (e.g., lower highs, bearish engulfing, MACD crossover, etc.).
USDJPY SELL OPPORTUNITY Am selling a sell trade coming on USDJPY
Entry: 148.570
Stoploss: 148:800
Take profit: 145.300
Comment your opinion pls 🙏
For fund management. DM now on X @shajudeakinoba1

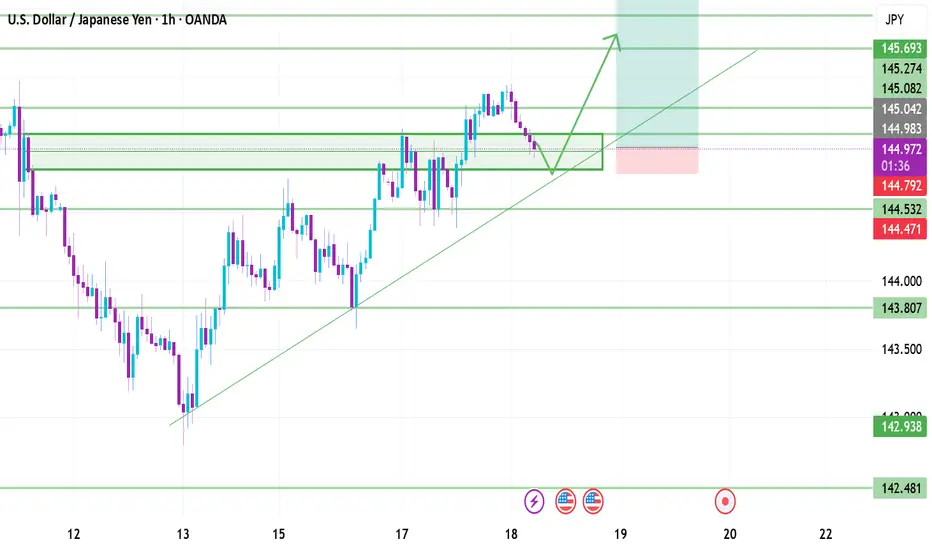
USD/JPYNow that USD/JPY has made a clear bullish move in price we can look for entries for long positions. At this point il wait for price to retest the zone its just broke out of - 445.000 and tp at the next resistance level - 145.693 & 146.000