USDJPY trade ideas
Downtrend Slowing – Recovery Opportunity After Correction?USD/JPY: Downtrend Slowing – Recovery Opportunity After Correction?
Hello TradingView community!
Today, let's focus on analyzing the USD/JPY pair, which is showing interesting developments after its recent correction.
🌍 Macro Overview: USD/JPY Under Current Pressures
The market is observing shifts in the dynamics of the USD/JPY pair:
UOB Group's 24-Hour View: The USD experienced a sharp decline from 148.02 on Monday to 144.49, despite being "oversold". This indicates a slowing in the downtrend, though caution remains.
Retest Expected: According to UOB Group, there's a likelihood of USD/JPY retesting the 144.50 level before a more sustained recovery can be expected.
Downside Limited: A drop below 144.50 cannot be ruled out, but based on current momentum, any further weakness is unlikely to reach 144.00.
Resistance Levels: On the upside, resistance levels are noted at 145.20 and 145.55.
Overall, USD/JPY is in a phase of seeking equilibrium after a significant decline.
📊 Technical Analysis & USD/JPY Trading Plan
Based on the USD/JPY chart (H4/M30) you provided:
Overall Trend: The pair has undergone a relatively deep corrective decline after reaching a local peak, but appears to be seeking a strong support zone.
Key Price Levels:
Crucial Resistance (SELL Zone): Clearly at 144.894 - 145.178. This is an confluence area of Fibonacci levels and local highs where selling pressure could emerge strongly.
Important Support (Potential BUY Zone): Around 143.800 - 143.500. This represents a potential bottoming area where demand might be strong enough to push the price higher.
Projected Price Action: After the sharp decline, USD/JPY might retest the 144.50 area. If it holds above key support levels, an upward move towards resistance zones is plausible, as indicated by the arrows on the chart.
🎯 USD/JPY Trading Plan:
BUY ZONE: 143.800 - 143.500
SL: 143.400
TP: 144.000 - 144.200 - 144.500 - 144.800 - 145.000 - 145.200 - 145.500
SELL ZONE: 144.894 - 145.178
SL: 145.300
TP: 144.700 - 144.500 - 144.200 - 144.000 - 143.800 - 143.500
⚠️ Key Factors to Monitor:
US and Japanese Economic Data: Upcoming reports on inflation and employment from both nations could significantly impact Fed and BoJ policy expectations.
BoJ Policy Decisions: Any shifts in the Bank of Japan's stance will create strong volatility for the JPY.
Global Risk Sentiment: Changes in overall market sentiment can also affect JPY crosses.
Trade smart and stay informed! Wishing everyone a successful USD/JPY trading day!
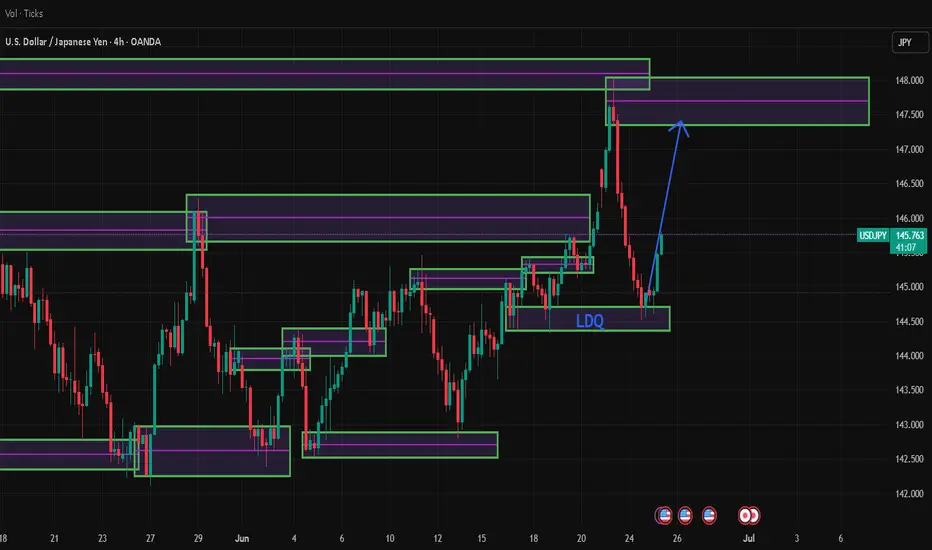
USD/JPY Long projection for the following days.After the sweep of liquidity, and a deeper mitigation of a weak, And of course our CH which is the strongest indication that enough buy orders are absorbed from the market, can indicate that we will see UJ in higher prices.

Dollar - Short term Bullish again (Mainly Bearish)Looks like Dollar wants to come back into the range we broke down from. I am still bearish dollar but no point getting into longer term "bearish" dollar trades yet

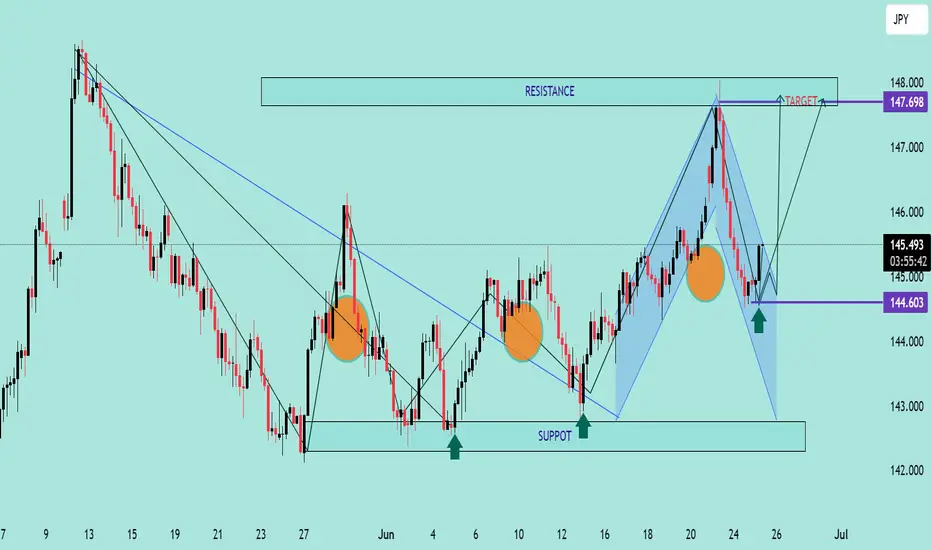
USD/JPY Bullish Reversal AnalysisUSD/JPY Bullish Reversal Analysis 📈💹
🔍 Technical Overview:
The chart illustrates a strong bullish reversal pattern forming on USD/JPY after price reacted from a key support zone at 144.600. This level has held firm multiple times, marked by green arrows, signaling strong buying interest.
📐 Chart Patterns & Structure:
✅ A bullish harmonic pattern (possibly a bullish Bat or Gartley) is completing near the 144.600 zone.
🔄 Multiple rejection wicks and bullish engulfing patterns indicate a potential upside reversal.
🔵 Descending trendlines have been broken, confirming momentum shift.
🔁 Previous resistance turned support (near 145.000) is acting as a possible launchpad for the next move.
🎯 Upside Target:
The projected move targets the resistance zone at 147.698, aligning with previous highs and a significant supply area.
If price breaks above 145.900 convincingly, continuation toward this resistance is expected.
🔻 Downside Risk:
A break below 144.600 would invalidate the bullish setup and expose price to the lower support range near 142.000–143.000.
📊 Conclusion:
USD/JPY is showing signs of bullish reversal from a strong demand zone. If price sustains above 145.000 and breaks the minor consolidation, the pair could rally toward 147.698 🎯.
Bias: Bullish ✅
Support: 144.600
Resistance: 147.698
USDJPY H4 Golden zone The USDJPY pair has finally reached the H4 golden Zone. M15 previous highs under threat. Are we bullish for the day
Ceasefire Supports Yen’s StrengthThe Japanese Yen stayed strong near a one-week high around 145.5 on Wednesday, supported by risk-off sentiment and dovish commentary from the Bank of Japan. Several BOJ members favored steady rates with concerns over U.S. tariffs and their impact on Japan’s economy.
May’s Services PPI remained above 3% yearly, strengthening speculation that the BOJ could still raise rates later this year. Meanwhile, lingering geopolitical uncertainty and expectations of Fed rate cuts continued to pressure the US Dollar.
The key resistance is at $146.20, and the major support is at $144.85.

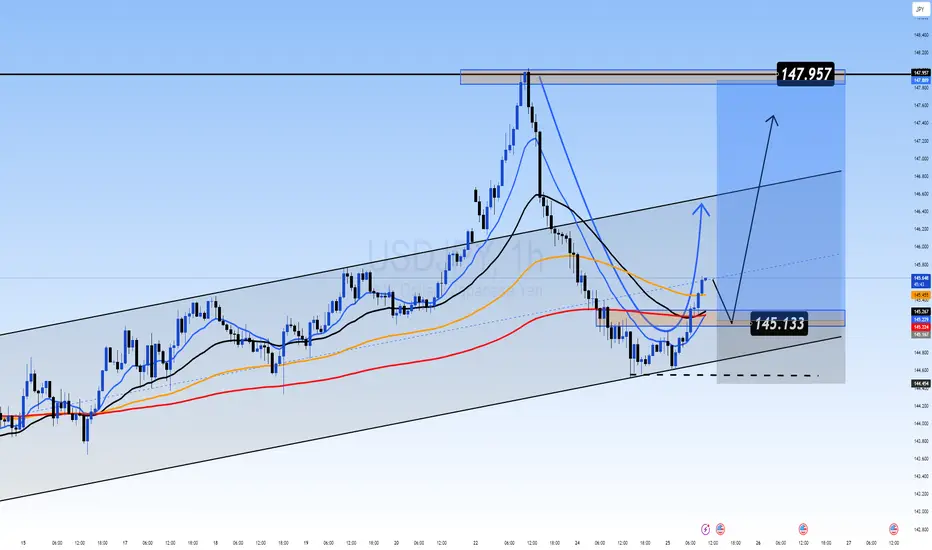
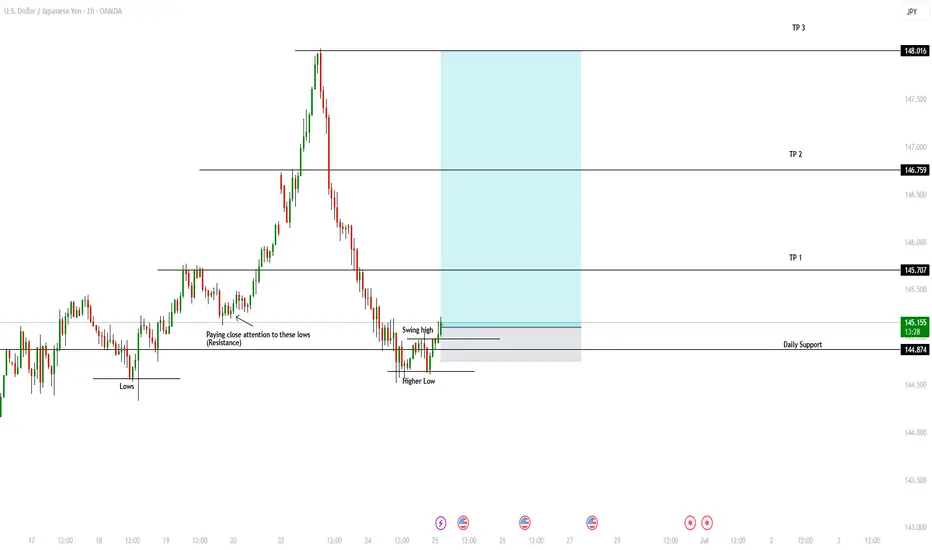
OANDA:USDJPY Buy SetupUSDJPY Buy Setup – Bullish Structure & Daily Rebound
USDJPY is showing signs of renewed bullish momentum after rejecting a significant daily low. Price action on the 1-hour timeframe has confirmed the formation of a higher low, followed by a clean break above a key daily support level—now turned support once again. This shift in market structure indicates a potential continuation of the uptrend, supported by higher highs and higher lows on the intraday chart.
Technical Highlights:
Strong rejection from a daily low zone
Bullish structure confirmed on the 1H timeframe
Price reclaiming a key support level and holding above it
Momentum suggests potential continuation toward higher targets
Trade Setup:
Entry: 145.110
Stop Loss: 144.754
Target Levels:
Take Profit 1: 145.709
Take Profit 2: 146.747
Take Profit 3: 148.014
This setup offers a favorable risk-to-reward ratio within a well-defined bullish context. Wait for a solid candle confirmation if not already entered, and always manage your risk according to your trading plan.
Drop your thoughts or questions in the comments, and if you found this valuable, hit boost and follow for more structured trade ideas. Wishing you precision and profits!
USDJPY shorts! It seems like Asia is winning the tariff war from my opinion. Not looking great for USA economy. USDJPY is a nice short for me.

Fundamental Market Analysis for June 25, 2025 USDJPYEvents to pay attention to today:
17:00 EET.USD - Fed Chair Jerome Powell will deliver a speech
17:30 EET.USD - Crude oil inventory data from the Department of Energy
USDJPY:
The Japanese yen (JPY) remains in the lead against the US dollar during Wednesday's Asian session and remains close to the weekly high reached the day before, amid a combination of favourable factors. The summary of opinions from participants at the Bank of Japan (BoJ) meeting in June showed that some policymakers called for interest rates to be kept unchanged due to uncertainty about the impact of US tariffs on the Japanese economy. In addition, the fragile truce between Israel and Iran and trade uncertainty are supporting the Japanese yen as a safe-haven currency.
Meanwhile, investors seem convinced that the Bank of Japan will raise interest rates again amid mounting inflationary pressure in Japan. These forecasts are confirmed by Japan's producer price index (PPI), which rose for the third consecutive month in May and remained above 3% year-on-year. In contrast, traders are factoring into their prices the likelihood that the Federal Reserve (Fed) will further lower the cost of borrowing this year. This, in turn, is causing US dollar (USD) bulls to tread cautiously and suggests that the path of least resistance for the lower-yielding Japanese yen remains upward.
Trading recommendation: SELL 144.900, SL 145.100, TP 144.000

LONG - USD/JPYCurrently in the 4H timeframe I can see that the price itself has given me a shift of momentum and this indicates that there could a chance for a possible bullish movement.
Now I have marked my zones base on fibonacci levels and gotten my zones to participate in the market.
Base on the market structure we can see that the price has now shifted its direction coming from a bearish momentum and now is pushing into a bullish momentum. This is where we can try to look for an opportunity to buy within those zones.
Why I am looking for a buy is because the price has already touched our support zone and respected the zone itself. Combining it together with Market Structure there seems to be a much more clearer view of how the market is moving.
Entry Point - 144.341
Stop Loss - 142.387
Take Profit - 148.585

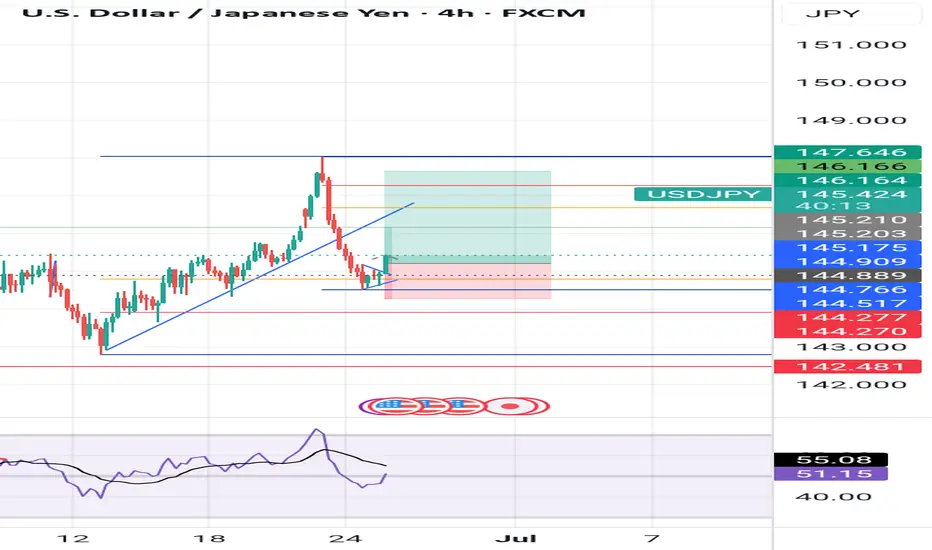
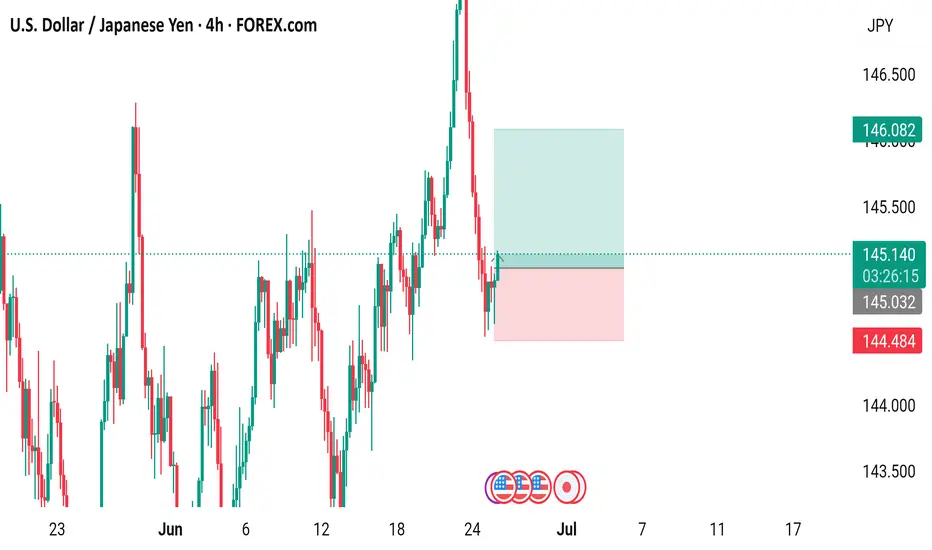
USD/JPY 4-Hour Forex Chart4-hour chart from FOREX.com displays the exchange rate between the U.S. Dollar (USD) and the Japanese Yen (JPY) as of June 25, 2025. The current rate is 145.156, reflecting a 0.16% increase (+0.226). The chart highlights a recent sharp upward movement followed by a decline, with key support and resistance levels marked around 144.484 and 145.731, respectively. The shaded areas indicate potential trading ranges, with the current price hovering near the upper boundary.
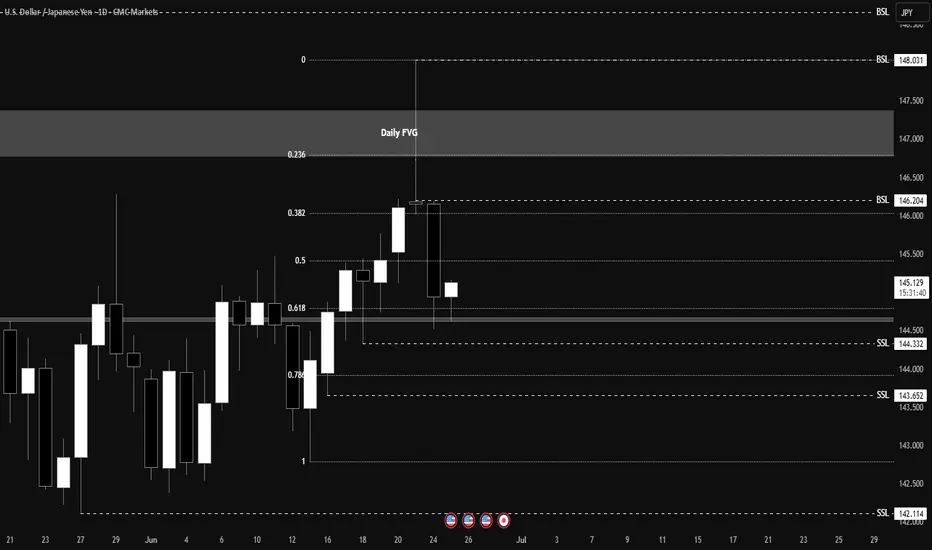
Looking for an immediate rebalance on USDJPY daily chartLooking for an immediate rebalance on USDJPY daily chart
Bullish bounce?USD/JPY is falling towards the pivot which is an overlap support and could bounce to the 1st resistance that lines up with the 23.6% Fibonacci retracement.
Pivot: 144.35
1st Support: 143.09
1st Resistance: 145.29
Risk Warning:
Trading Forex and CFDs carries a high level of risk to your capital and you should only trade with money you can afford to lose. Trading Forex and CFDs may not be suitable for all investors, so please ensure that you fully understand the risks involved and seek independent advice if necessary.
Disclaimer:
The above opinions given constitute general market commentary, and do not constitute the opinion or advice of IC Markets or any form of personal or investment advice.
Any opinions, news, research, analyses, prices, other information, or links to third-party sites contained on this website are provided on an "as-is" basis, are intended only to be informative, is not an advice nor a recommendation, nor research, or a record of our trading prices, or an offer of, or solicitation for a transaction in any financial instrument and thus should not be treated as such. The information provided does not involve any specific investment objectives, financial situation and needs of any specific person who may receive it. Please be aware, that past performance is not a reliable indicator of future performance and/or results. Past Performance or Forward-looking scenarios based upon the reasonable beliefs of the third-party provider are not a guarantee of future performance. Actual results may differ materially from those anticipated in forward-looking or past performance statements. IC Markets makes no representation or warranty and assumes no liability as to the accuracy or completeness of the information provided, nor any loss arising from any investment based on a recommendation, forecast or any information supplied by any third-party.

Usdjpy at key near-term support zone?The USD/JPY pair faces a sharp sell-off and slides to near 144.00 on Tuesday. The pair dives significantly as the US Dollar (USD) underperforms its peers after a ceasefire between Israel and Iran.
Easing geopolitical tensions diminish demand for safe-haven assets, such as the US Dollar. During European trading hours, the US Dollar Index (DXY), which tracks the Greenback’s value against six major currencies, slumps to near 98.00.
The demand for the Japanese Yen (JPY) should have weakened too, given its safe-haven status. However, the Asian-Pacific currency is outperforming its peers, except antipodeans, due to the decline in oil prices. ( Dua, 2025)
USD/JPY is trading below the 145.00 mark at the time of writing, during American trading hours, and staying afloat above its 100-day Moving Average, which remains a key near-term support zone.

Market next target ⚠️ Disruption Analysis – USD/JPY
1. Sideways/Flat Price Action
Price is consolidating in a tight range with small-bodied candles.
This indicates indecision and lack of momentum, not strength.
The upward arrows suggest bullish bias, but no strong signal confirms a breakout yet.
2. Bearish Momentum
The recent red candles dominate, showing a clear drop from above 146.000 earlier.
The overall trend (short-term) is down, and the support area could be tested again.
3. Decreasing Volume
Volume is fading out, especially the most recent bar (around 1.01K).
This suggests waning interest—any bullish breakout without volume support is likely to fail or reverse.
4. Resistance Area is Strong
The resistance zone near 145.800–146.000 is clearly tested before and held.
Without a significant catalyst, it's unlikely to break in the near term.
5. False Breakout Risk Above Target
The marked "target" just below resistance could trigger false bullish entries.

usdjpy looks to be doing the things its never a long wait if you have it right , lets see if the usd will take over

Potential bearish drop?USD/JPY is reacted off the support level which is an overlap support and could drop from this level to our tak eprofit.
Entry: 144.96
Why we like it:
There is an overlap support level.
Stop loss: 146.11
Why we like it:
There is a pullback resistance level.
Take profit: 142.70
Why we like it:
There is a pullback support level.
Enjoying your TradingView experience? Review us!
Please be advised that the information presented on TradingView is provided to Vantage (‘Vantage Global Limited’, ‘we’) by a third-party provider (‘Everest Fortune Group’). Please be reminded that you are solely responsible for the trading decisions on your account. There is a very high degree of risk involved in trading. Any information and/or content is intended entirely for research, educational and informational purposes only and does not constitute investment or consultation advice or investment strategy. The information is not tailored to the investment needs of any specific person and therefore does not involve a consideration of any of the investment objectives, financial situation or needs of any viewer that may receive it. Kindly also note that past performance is not a reliable indicator of future results. Actual results may differ materially from those anticipated in forward-looking or past performance statements. We assume no liability as to the accuracy or completeness of any of the information and/or content provided herein and the Company cannot be held responsible for any omission, mistake nor for any loss or damage including without limitation to any loss of profit which may arise from reliance on any information supplied by Everest Fortune Group.

UJ - Perfect Shorts....📉 ELFIEDT - X-REVERSION | USDJPY SHORT CASE STUDY (4H)
🧠 Perfect reversal from our proprietary ELFIE 3SD Reversion Zone with a confirmed "DOWN" signal.
🔻 Entry: 147.575
🎯 Current Move: Over 290+ pips in profit and still running!
🕐 Indicator spotted the exhaustion perfectly after RSI divergence + 3SD extension.
💡 How to Trade It:
Wait for ELFIE DOWN signal in the red zone.
Enter at close of signal candle.
SL = high of signal candle.
Ride the move until opposite signal or reversion.
✅ Works across all major pairs.
🔥 Simple rules. Powerful results.
🔔 Want to catch these trades in real-time?
➡️ Follow us and DM to get access to the ELFIE system.
📈 Make your chart your edge.
#forex #tradingview #USDJPY #reversion #indicator #smartmoney #forexsignals #elfieDT #tradingsystem #pipcatcher #swingtrading #technicalanalysis

weekly analysis for use/jpy June 23 - June 27weekly profit target for June 23 - 27
(short) 143.60 - 143.80 range
use/jpy (Short term move) 6/24/2025 10:39AM western time zone Stop loss: 144.40
Take profit: 145.30
(Short term move)

US$ Carry Trade BLOWUP IS SETTING UP The chart posted is the Yen/US$ I have NOT changed the labeling see forecast I feel something is about to Break in the markets ! best of trades WAVETIMER

USD/JPY Bearish Correction in Progress – Key Supports in Focus
USD/JPY is showing signs of weakness after rejecting the 146.00 level. The pair has started a corrective move on the 1H timeframe, trading below the previous support at 145.455, which has now turned into resistance.
As long as the price remains below this level, the current momentum suggests a possible drop toward the next support zones at:
First target: 144.78
Second target: 144.343
Any bullish retracement toward 145.455 may serve as a retest before continuing lower. This idea reflects the current price structure and does not constitute financial advice.
