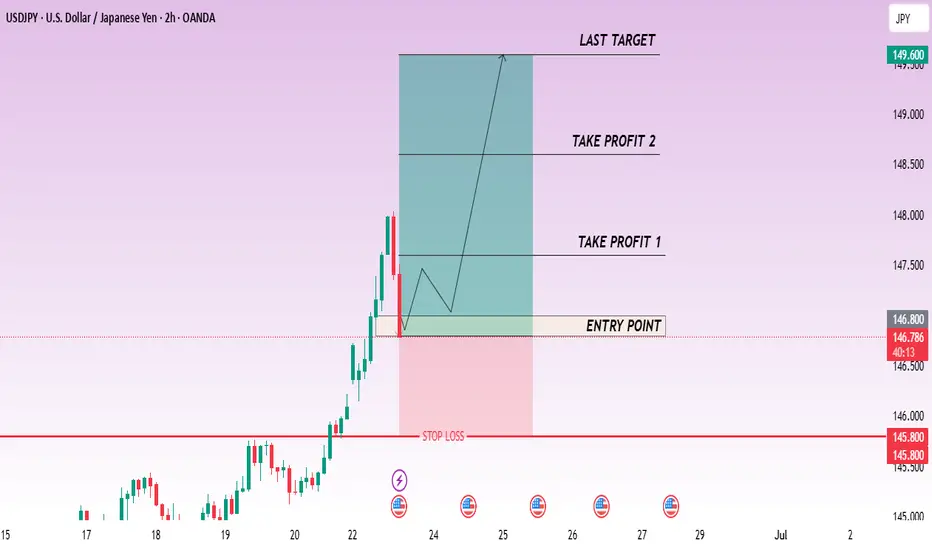
CHECK USDJPY SIGNAL READ CAPTAINusdjpy buy now ✅
entry point (147.000) (146.800)
TAKE PROFIT 1: (147.600)
TAKE PROFIT 2: (148.600)
LAST TARGET(149.600)
STOP LOSS (145.800)
USDJPY trade ideas
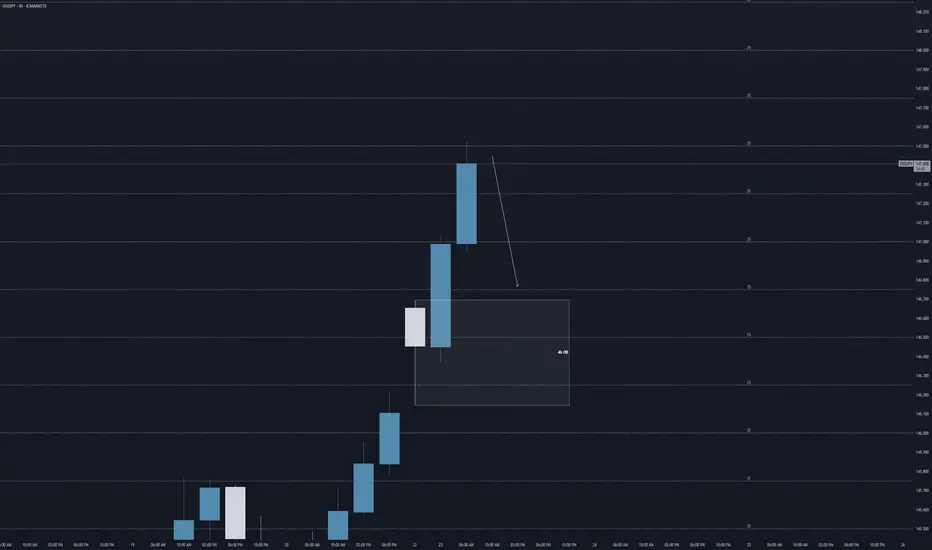
USDJPYLooking at this chart after I just did the EURJPY analysis, now this one looks more bullish than bearish BUT that's only if there is a breakout from the supply zone which Im assuming will give us a consolidation first before it shoots straight up to complete Wave 5. At the completion of Wave 5, we can expect the drop again as a correction and retest, which should usher in more buyers to form a Cup and Holder pattern. I really see the JPY being stronger than USD futuristically and practically.

Quick Forex Market Overview | USDJPY, GBPUSD, CADJPY, EURUSD...In this video, I give an unstructured but insightful overview of the current market conditions across several major forex pairs. I walk through key price action and technical levels on USDJPY, GBPUSD, CADJPY, EURJPY, EURUSD, and EURAUD — sharing what I’m seeing in the moment and how the setups are developing.
Perfect if you're looking for a raw, real-time perspective without the fluff.

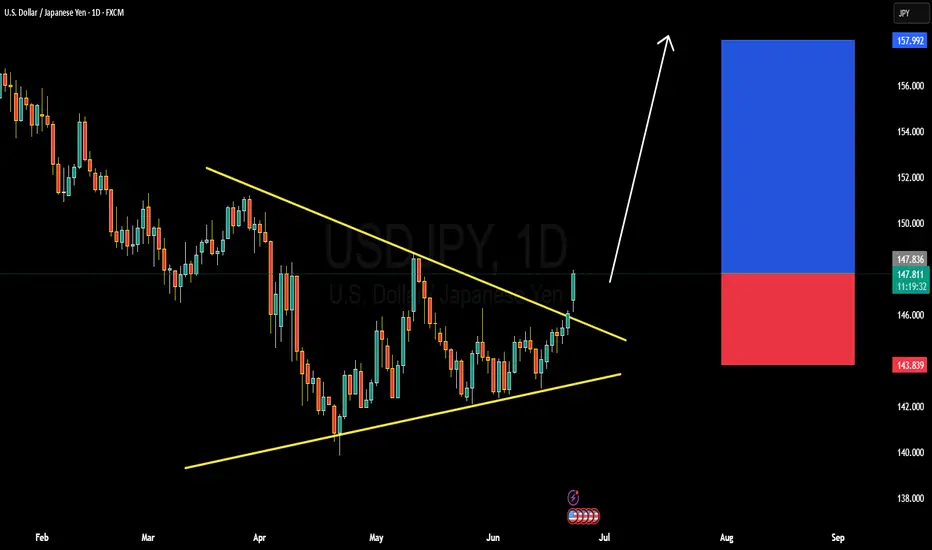
SDJPY BULLISH OR BEARISH DETAILED ANALYSISUSDJPY has successfully broken out of the symmetrical triangle structure that has been forming since early April, with today’s daily candle showing strong bullish momentum above the resistance zone around 147.500. The breakout is clean and backed by volume, which suggests that bulls are in full control. Price action is respecting the trendline structure and has now confirmed a fresh higher high, setting the stage for the next bullish leg. My immediate upside target for this move stands at 157.900.
Fundamentally, the divergence between the Federal Reserve and the Bank of Japan continues to widen. The Fed remains hawkish with inflation still sticky in the US and interest rate cuts being pushed further out. In contrast, the Bank of Japan remains ultra-dovish, with no major policy tightening in sight and continued yield curve control. This policy mismatch is keeping the Yen under consistent selling pressure. Additionally, Japan's core inflation slipped again this week, further reducing the probability of any BOJ rate hike this quarter.
The technical breakout aligns perfectly with the macro narrative. A strong bullish candle breaking structure on the daily suggests momentum will likely continue. With no strong resistance until the 157.900 area, this setup offers a high-conviction long opportunity. Traders should watch for minor pullbacks toward 147.000–146.800 as potential re-entry or add-on zones.
With rising US bond yields, weak Japanese fundamentals, and breakout confirmation on the chart, USDJPY is now well-positioned for a continuation rally. This is a trend-following setup with solid fundamentals and momentum confirmation—ideal conditions for a profitable move in the current forex environment.
U
Yen Falls Despite Japan’s Manufacturing ReboundThe yen fell past 146 on Monday, its lowest in over five weeks, as the US dollar gained on safe-haven demand after US airstrikes on Iranian nuclear sites escalated Middle East tensions. Domestically, Japan’s manufacturing sector grew in June for the first time since May 2024, and services expanded for a third straight month, showing economic resilience.
The key resistance is at $148.15 meanwhile the major support is located at $146.15.
UJ: Could we see a bearish leg looking at the 4h?USD/JPY is currently trading at a key price level of 147.5. We've got a 4h order block about 75 pips to the downside at 146.75.
If we see some lower time frame confirmations, we could potentially see a bearish leg towards this 4h OB today.
- Aman
USDJPY 15m H&S CORRECTION Quick trade on this H&S formation (GOOD RISK REWARD)
Plant to buy back if plays out @ 146.742
LONG TERM STILL BULLISH,
This will be just quick earner if plays out
Holla

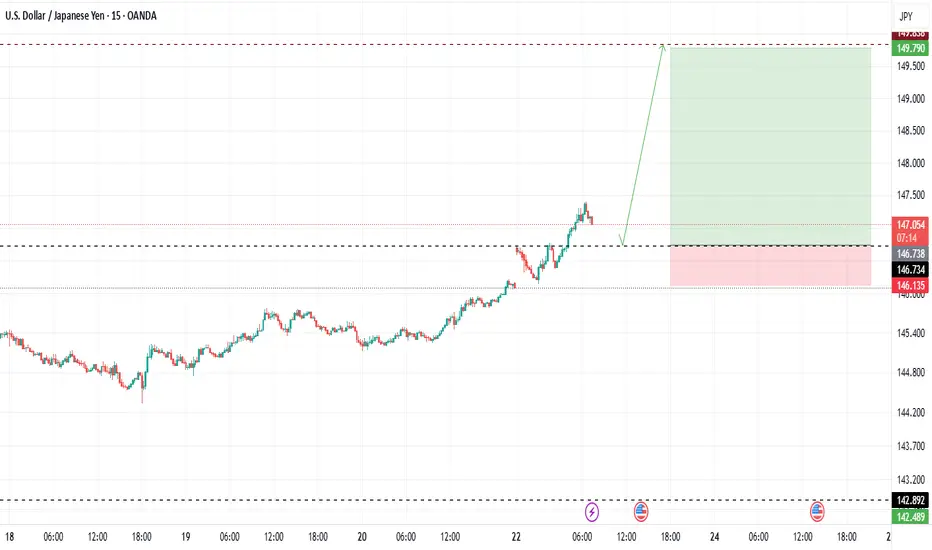
USDJPY BULLS DONT PLAY STILL LONG WAY TO GOOOWaiting for PULL BACK @ around 146.73 (that will be my buy entry)
This trade its straight forward, i have only 1 target @ 149.79
All the best TRADERS
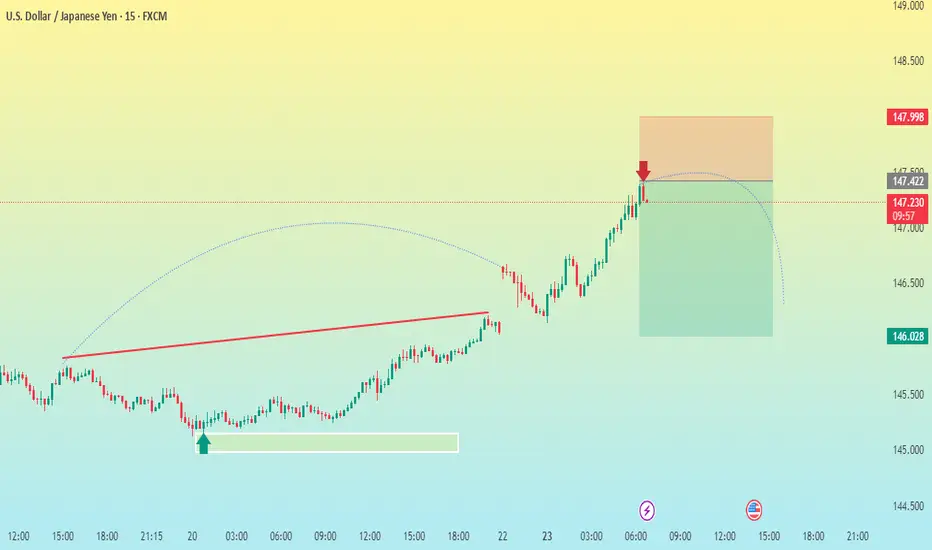
USD/JPY 15M CHART PATTERNHere’s a breakdown and analysis of your USDJPY SELL trade setup on the 15-minute timeframe:
---
Trade Details:
Entry: 147.280 (Short)
Stop Loss (SL): 147.998 (≈71.8 pips risk)
Targets:
T1: 146.960 (≈32 pips)
T2: 146.600 (≈68 pips)
T3: 146.019 (≈126 pips)
---
Risk/Reward Ratios:
Target Reward (pips) R:R Ratio
T1 32 ~0.45:1
T2 68 ~0.95:1
T3 126 ~1.75:1
---
Quick Technical Evaluation (Assuming standard price behavior):
Entry near local high? If yes, solid idea to sell after rejection/candle confirmation.
SL Placement: 147.998 is quite wide—possibly above a recent high or resistance zone.
T1 is relatively close, offering a partial TP level but low reward/risk.
T2 provides near 1:1 R:R, which is more balanced.
T3 is aggressive and may require a strong bearish continuation or news catalyst.
---
Suggestions:
1. Adjust SL? – If the 147.998 level isn’t key resistance, consider tightening it closer to the swing high (e.g., 147.400–147.500) to improve R:R.
2. Scaling Out – Consider closing part of the position at T1 or T2, then letting the rest run to T3.
3. Monitor Price Action – On the 15m chart, look for bearish continuation (e.g., lower highs, bearish engulfing, MACD crossover, etc.).
USDJPY SELL OPPORTUNITY Am selling a sell trade coming on USDJPY
Entry: 148.570
Stoploss: 148:800
Take profit: 145.300
Comment your opinion pls 🙏
For fund management. DM now on X @shajudeakinoba1

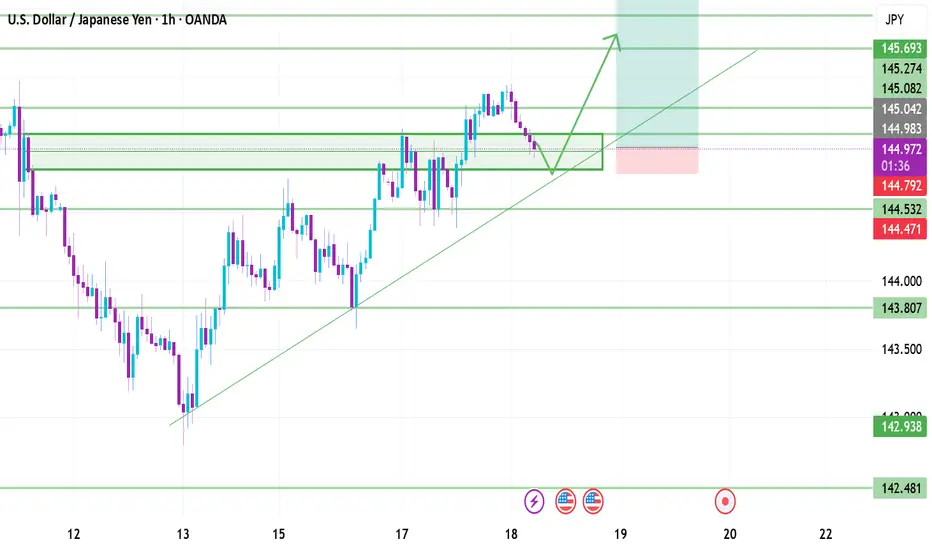
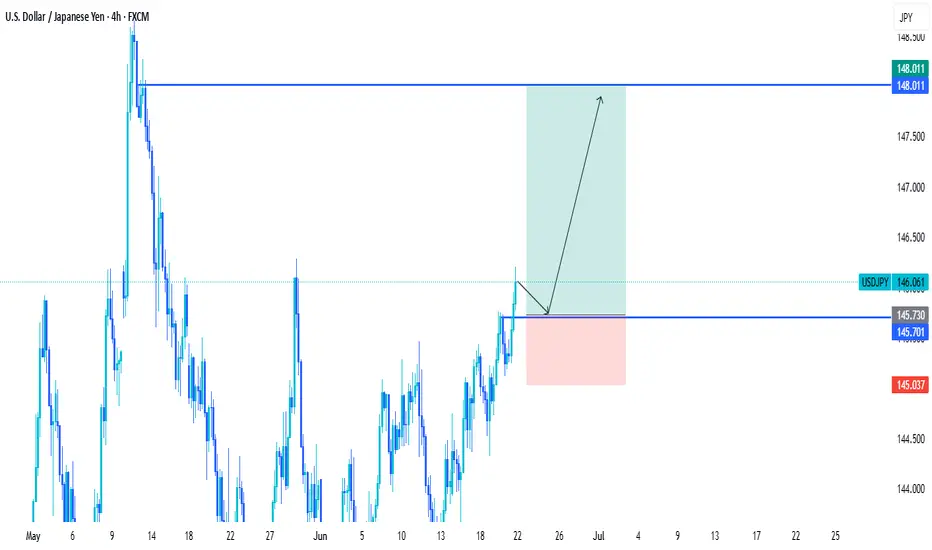
USD/JPYNow that USD/JPY has made a clear bullish move in price we can look for entries for long positions. At this point il wait for price to retest the zone its just broke out of - 445.000 and tp at the next resistance level - 145.693 & 146.000
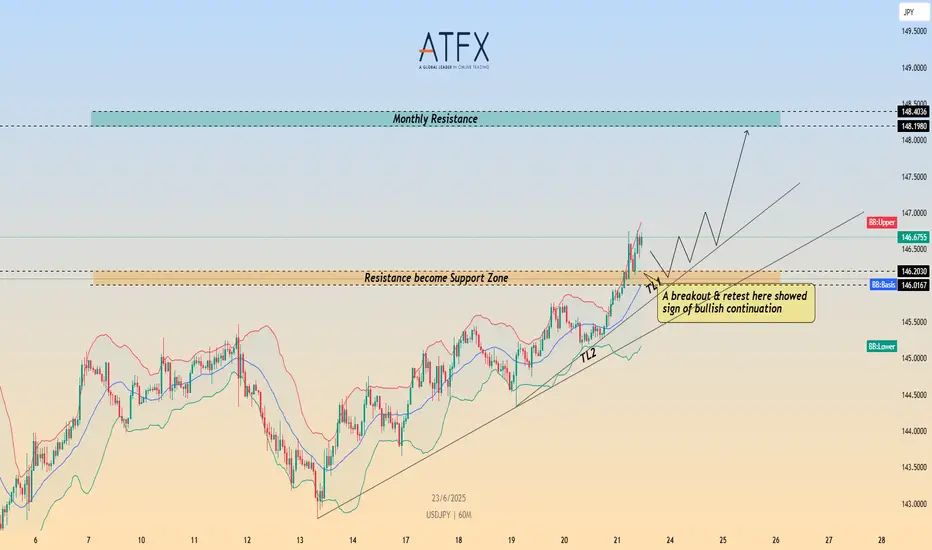
USD/JPY Breaks Higher – Bullish Momentum Targets 148.40FX:USDJPY CMCMARKETS:USDJPY USD/JPY continues to climb, extending gains above the key 146.00 breakout level, supported by Fed–BoJ policy divergence and rising geopolitical tensions. Despite Japan’s strong CPI and PMI prints, the BoJ maintains a dovish tone, while tariff concerns continue to cap yen sentiment. The Middle East conflict further fuels demand for the USD as a safe haven.
Technically, the pair confirmed a bullish breakout, with price hugging the upper Bollinger Band – a sign of sustained upside pressure. As long as 146.00 holds, bulls may aim for the 148.40 monthly resistance.
Key Levels :
Resistance : 146.75 / 148.40
Support : 146.00 / 145.25
⚠️ Momentum favours the upside while above 146.00. Break below may trigger short-term pullback toward 145.25.
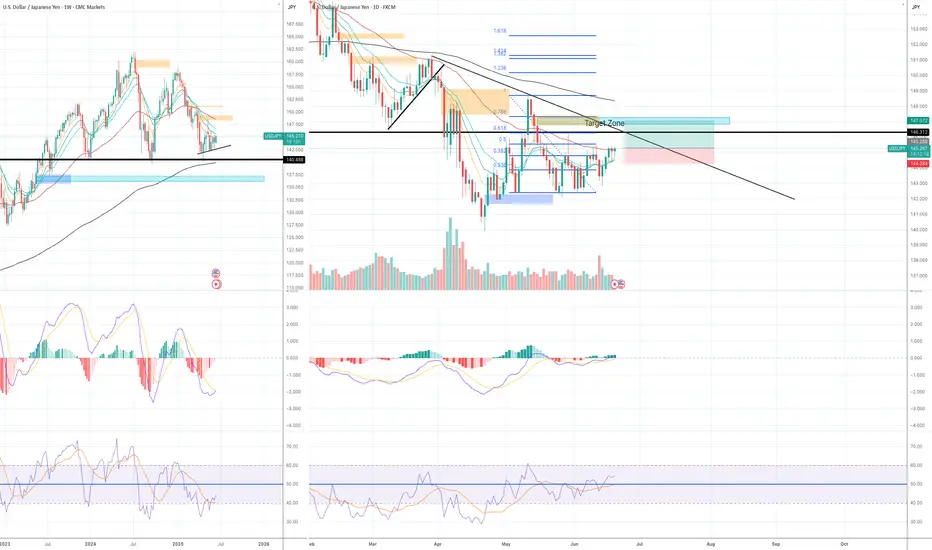
Long - the final move up before moving to the downsideMy macro bias for USDJPY is bearish. However, I opened a long position today.
Reasons for a long trade:
Weekly chart:
1) Both MACD and RSI are in the bear territory, however, both MACD and RSI lines are starting to cross and move to the upside.
2) The price has been moving sideways for weeks, however, weekly candle has been forming higher low since late April (subtle move).
3) There is a major support line at 140.50 area and weekly EMA200 is also sitting right below it.
Although the price has been moving to the downside, it will require strong momentum to pierce through the major support zone that has been holding since July 2023.
Daily chart:
1) EMA9 > EMA14 > EMA 21 - bullish trend
2) Yesterday's daily candle retested EMA 9/14/21 and closed above all of them.
3) MACD has entered the bull zone.
4) RSI has entered the bull zone.
5) There is an unmitigated fair value gap in the Fib 0.618-0.786 area. (see blue rectangular box in the chart).
As I said above, it will take strong momentum for the price to break below the major support line. It makes sense for the price to retrace to the unmitigated fair value gap area to take out all the liquidity to fuel the momentum to the downside.
My trade setup is below:
Entry: 145 Stop/Loss: 144.25 (just under yesterday's candle wick)Target: 147.12
Risk:Rewards 1:1.78
Usdjpy SELL setup Selling usdjpy now because we have swept last week high and I anticipate price to drop off to H1 BB
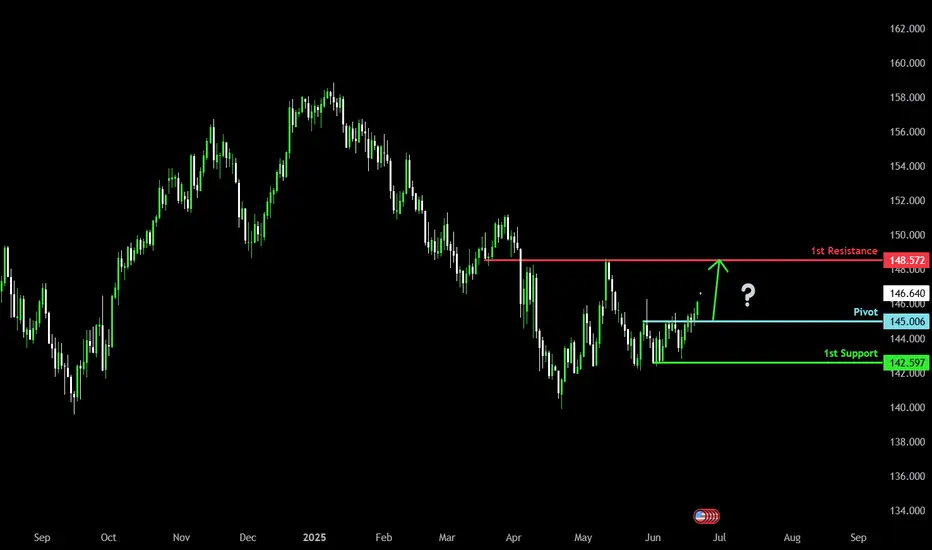
Potential bullish rise?USD/JPY has reacted off the pivot which is a pullback support and could rise to the 1st resistance which is a pullback resistance.
Pivot: 145.00
1st Support: 142.59
1st Resistance: 148.57
Risk Warning:
Trading Forex and CFDs carries a high level of risk to your capital and you should only trade with money you can afford to lose. Trading Forex and CFDs may not be suitable for all investors, so please ensure that you fully understand the risks involved and seek independent advice if necessary.
Disclaimer:
The above opinions given constitute general market commentary, and do not constitute the opinion or advice of IC Markets or any form of personal or investment advice.
Any opinions, news, research, analyses, prices, other information, or links to third-party sites contained on this website are provided on an "as-is" basis, are intended only to be informative, is not an advice nor a recommendation, nor research, or a record of our trading prices, or an offer of, or solicitation for a transaction in any financial instrument and thus should not be treated as such. The information provided does not involve any specific investment objectives, financial situation and needs of any specific person who may receive it. Please be aware, that past performance is not a reliable indicator of future performance and/or results. Past Performance or Forward-looking scenarios based upon the reasonable beliefs of the third-party provider are not a guarantee of future performance. Actual results may differ materially from those anticipated in forward-looking or past performance statements. IC Markets makes no representation or warranty and assumes no liability as to the accuracy or completeness of the information provided, nor any loss arising from any investment based on a recommendation, forecast or any information supplied by any third-party.
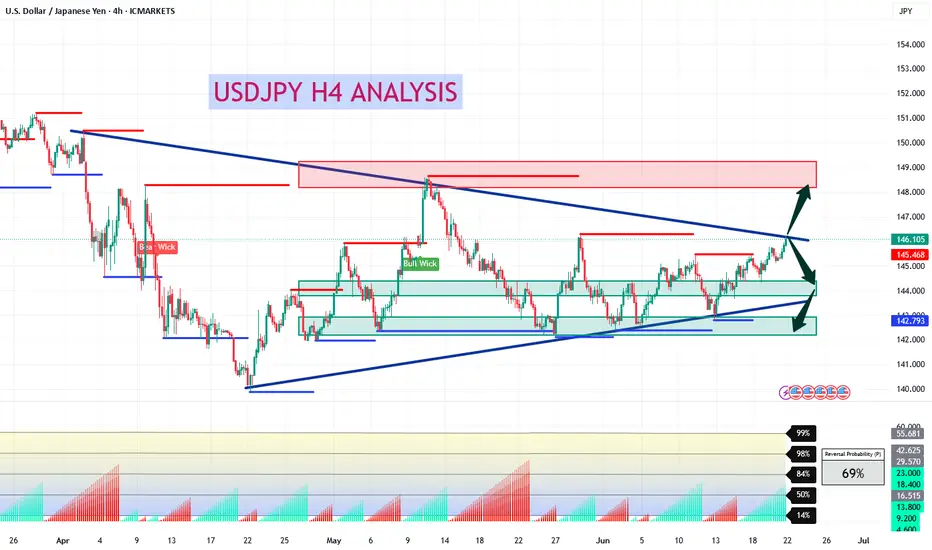
USDJPY H4 AnalysisUSDJPY Showing a Bearish Flag. If it breaks this zone above, Most probably can fly up to 148.668 and higher to 150.538. If no, Can rally between 143.981 or even lower to 142.410. Trading Analysis from 23-06-25 to 27-06-25. Take your risk under control and wait for market to break support or resistance on smaller time frame. Best of luck everyone and happy trading.🤗
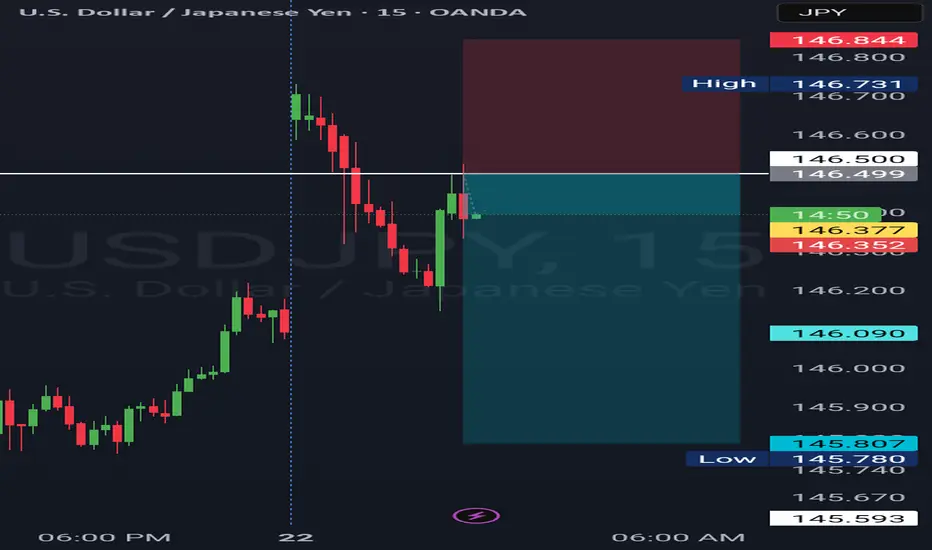
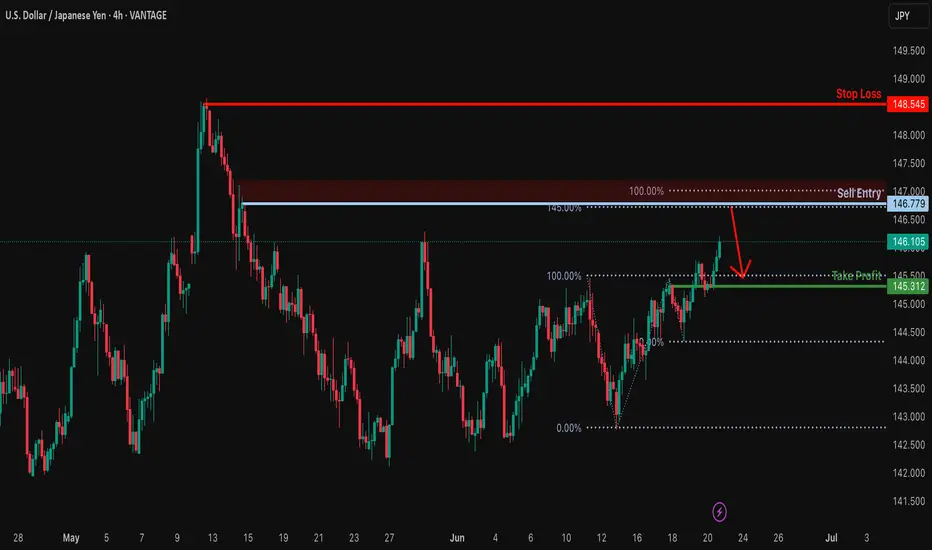
Heading into pullback resistance?USD/JPY is rising towards the resistance level which is a pullback resistance that aligns with the 145% Fibonacci extension and also slightly below the 100% Fibonacci projection and could drop from this level to our take profit.
Entry: 146.77
Why we like it:
There is a pullback resistance level that lines up with the 145% Fibonacci extension and also slightly below the 100% Fibonacci projection.
Stop loss: 148.54
Why we like it:
There is a pullback resistance level.
Take profit: 145.31
Why we like it:
There is an overlap support level.
Enjoying your TradingView experience? Review us!
Please be advised that the information presented on TradingView is provided to Vantage (‘Vantage Global Limited’, ‘we’) by a third-party provider (‘Everest Fortune Group’). Please be reminded that you are solely responsible for the trading decisions on your account. There is a very high degree of risk involved in trading. Any information and/or content is intended entirely for research, educational and informational purposes only and does not constitute investment or consultation advice or investment strategy. The information is not tailored to the investment needs of any specific person and therefore does not involve a consideration of any of the investment objectives, financial situation or needs of any viewer that may receive it. Kindly also note that past performance is not a reliable indicator of future results. Actual results may differ materially from those anticipated in forward-looking or past performance statements. We assume no liability as to the accuracy or completeness of any of the information and/or content provided herein and the Company cannot be held responsible for any omission, mistake nor for any loss or damage including without limitation to any loss of profit which may arise from reliance on any information supplied by Everest Fortune Group.
USDJPY TRADE SETUPWait for retest the entry level and bullish momentum then a trade for Buy otherwise skip this setup
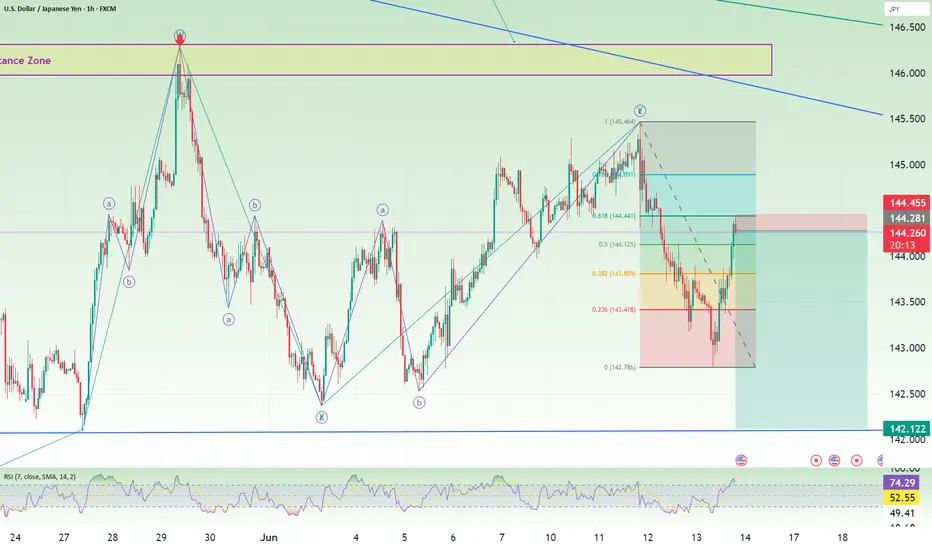
USDJPY Short: 61.8% retracementHi, a simple reason to short: 61.8% retracement. Stop above 144.44.
Thank you.
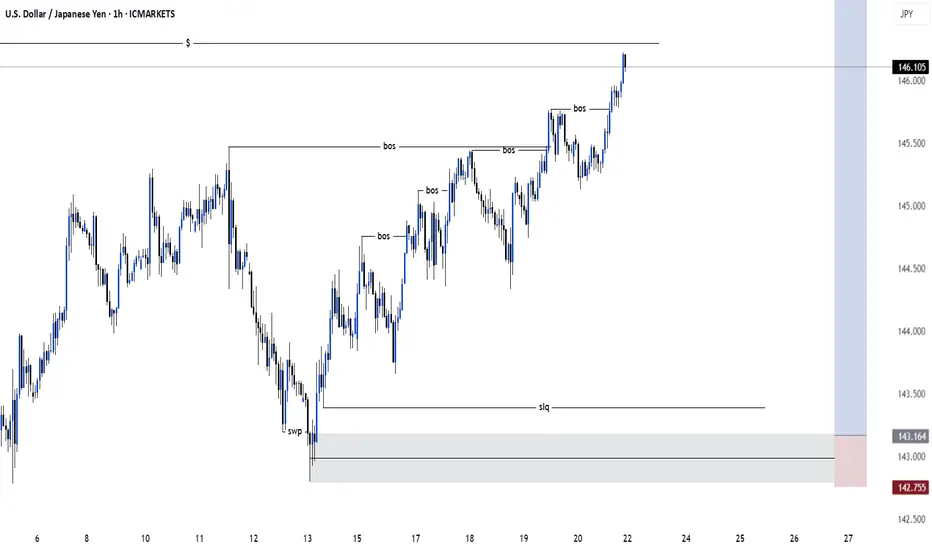
USDJPY: buy to sellstructure: range
liquidity: from weak swings to structural liquidity
orderblocks: demand and supply point of interests
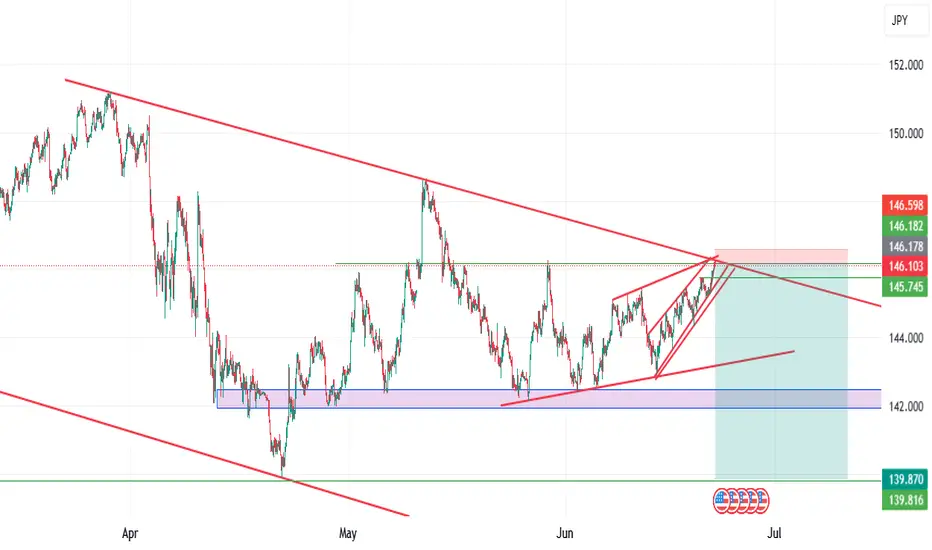
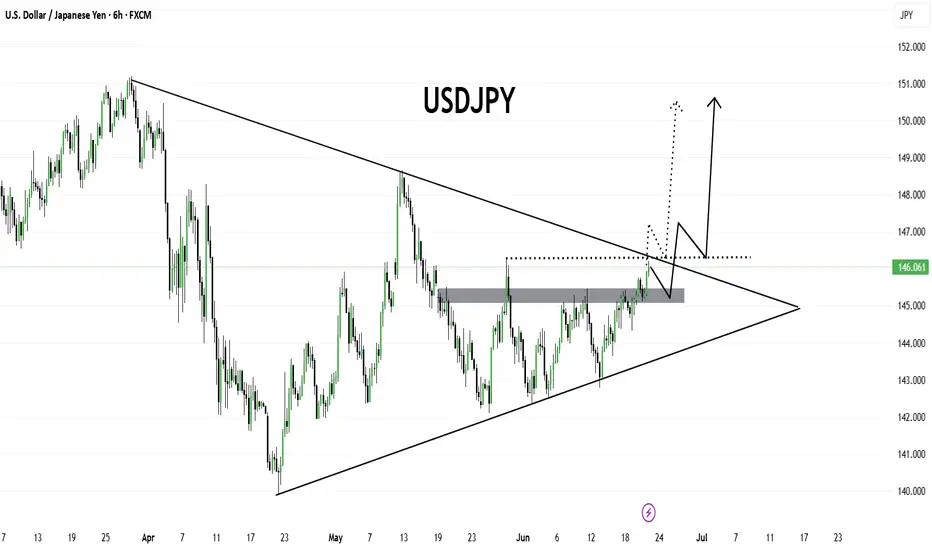
USDJPYUSDJPY is currently approaching a major breakout zone as it nears the apex of a symmetrical triangle pattern. The pair has broken above the key horizontal resistance area around 145.80–146.00, which previously acted as a strong supply zone. Price is now challenging the descending trendline resistance.
A confirmed breakout and retest of the triangle and resistance zone may open the door for a bullish continuation toward 147.50, and potentially 150.00+, as marked on the chart. However, if the breakout fails, we may see a pullback toward the 145.00–144.80 support region before any further upside.
This setup highlights a potential breakout-retest-continuation scenario. Traders should watch for price action confirmation near the trendline for further direction.
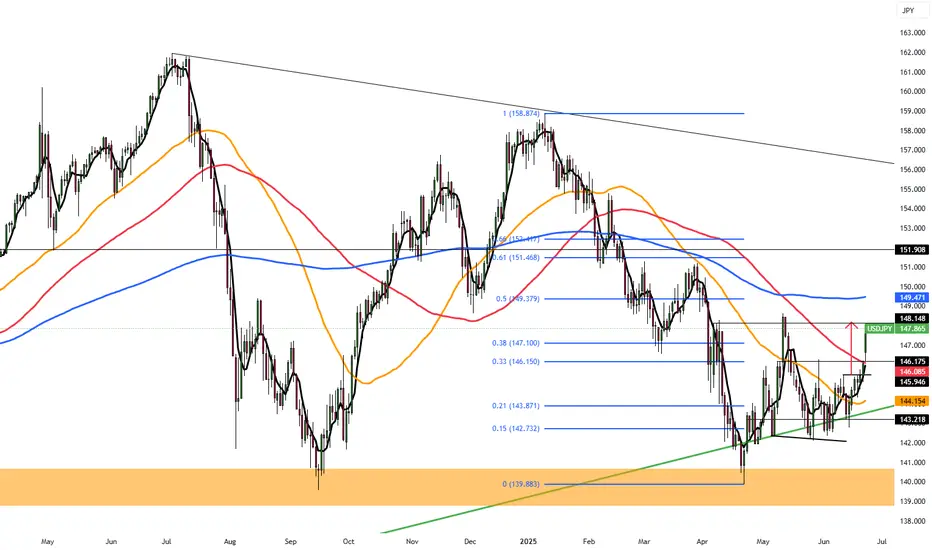
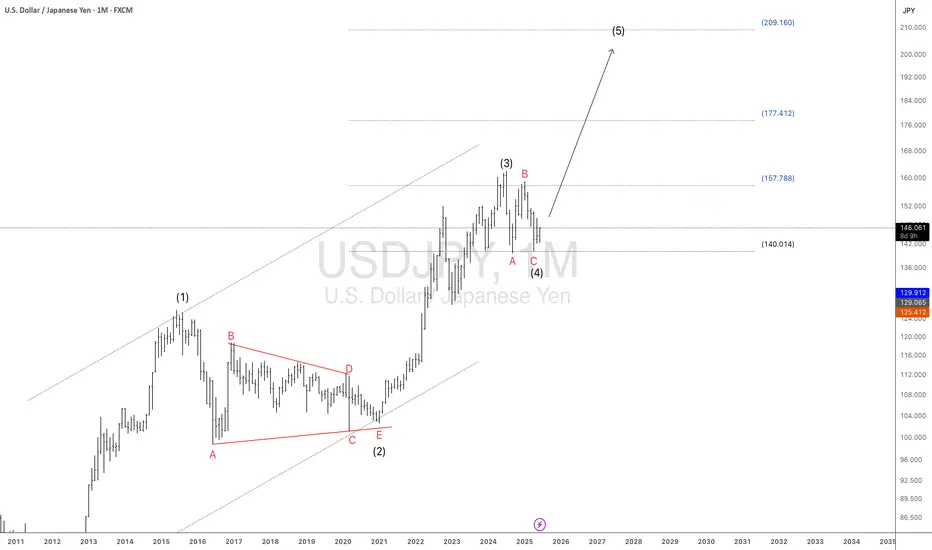
USDJPY: Ready for Wave 5?USDJPY is showing a strong bullish wave structure, with a clear path toward higher levels based on Elliott Wave Theory. After a successful breakout from a multi-year consolidation, price action appears to be completing a Wave (4) correction thereby setting the stage for a Wave (5) rally.
Based on the bullish structure and projected continuation:
1st Target = 157.78
2nd Target = 177.41
Final Target = 209.16 Full wave extension, top of macro channel
With support holding above ¥140.00 and a bullish bounce forming, this could mark the Wave C bottom of (4), setting the stage for the next major leg up.
Disclaimer:
This analysis is for informational and educational purposes only and does not constitute financial advice. Markets are dynamic and unpredictable.
USDJPY is about to sell down for long timeFrom the chart, you can see that usdjpy is about to sell for a long time.
Reason;
1, Third trendline touch
2, double top
3, small ascending channel