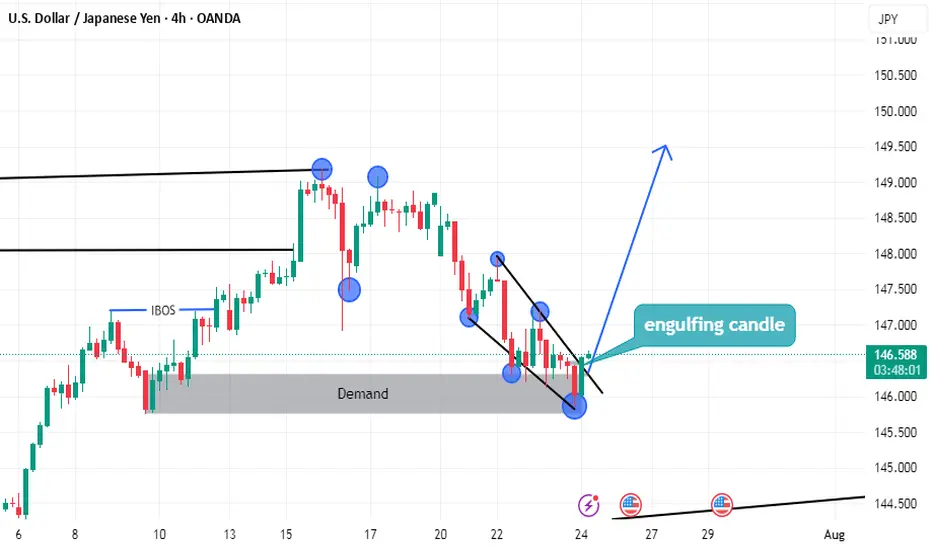
USDJPY LONG setupsimply
we have demand
and the price can't lower low
end we have break of structure on low time frame
and we have more but i don't have enough time to tell you
Look the photo well
USDJPY trade ideas
USD/JPY) Bullish Analysis Read The captionSMC Trading point update
Technical analysis of USD/JPY on the 4-hour timeframe, signaling a potential rally toward the 149.191–149.202 resistance zone. Here's the full breakdown
---
Technical Analysis – USD/JPY (4H)
1. Fair Value Gap (FVG) Support
Price recently filled a Fair Value Gap (FVG) level (yellow box) and is now pulling back toward it.
The FVG zone is expected to act as a support and potential entry point for buyers (marked by the green upward arrow).
2. Uptrend Structure
Price is moving within an ascending trendline, suggesting bullish market structure.
The current retracement is seen as a higher low setup, aligning with bullish continuation logic.
3. 200 EMA as Support
The 200 EMA at 146.198 is providing dynamic support.
Confluence between the EMA, FVG, and ascending trendline strengthens the bullish bias.
4. Resistance Target Zone
The projected target zone is between 149.191–149.202, which aligns with a previous high and key resistance level.
This zone is highlighted as the final take-profit area.
5. RSI Momentum
RSI is at 57.11, showing positive momentum but not yet overbought — which supports further upside.
RSI remains above 50, maintaining bullish momentum.
Mr SMC Trading point
---
Summary
Bias: Bullish
Current Price: 147.653
Support Zone (FVG): 146.20–146.92 (approx)
Trendline Support: Uptrend line intact
200 EMA: Acting as dynamic support (146.198)
Resistance Target: 149.191–149.202
RSI: 57.11 – healthy bullish momentum
plesse support boost 🚀 this analysis)

SellRejection Level
Daily Volume
Market Structure Shift
London Session
Trend Line Break
Untapped Order Point

USDJPY I Technical and Fundamental Analysis Welcome back! Let me know your thoughts in the comments!
** USDJPY Analysis - Listen to video!
We recommend that you keep this on your watchlist and enter when the entry criteria of your strategy is met.
Please support this idea with a LIKE and COMMENT if you find it useful and Click "Follow" on our profile if you'd like these trade ideas delivered straight to your email in the future.
Thanks for your continued support!

USDJPY POTENTIAL CONTINUATION AFTER A PULLBACK Price has returned to a higher time frame supply zone after a change in structure and is now showing signs of rejection following a pullback (retracement). The mitigation of the supply zone suggests that institutions may have filled their sell orders and are now ready to push price lower.
📉 Execution Plan:
• Entry: On lower timeframe BOS/CHOCH or strong bearish reaction after mitigation.
• SL: Just above the supply zone (allow breathing room).
• TP: Next demand zone or based on structure (e.g., swing low, imbalance fill).
• RR: Minimum 1:3, ideally 1:5 depending on refinement and volatility.
USDJPY Forming Bullish Reversal | MMC Analysis + Target🧠 Chart Overview (2H Timeframe)
🔸 1. Head and Shoulders Inverse Pattern – MMC Bullish Blueprint
The chart beautifully shows an Inverse Head & Shoulders pattern, one of the most powerful reversal signals under MMC logic:
Left Shoulder: Formed after the initial drop and quick recovery.
Head : Deep liquidity grab and reversal from the lowest point (demand zone).
Right Shoulder: Higher low structure, indicating reduced selling pressure and shift in momentum.
This pattern is forming around a previous liquidity zone, which makes it more valid and aligned with smart money behavior.
🔸 2. Retesting Zone – Critical MMC Demand Area
Price is now retesting a highlighted demand zone, which acted as the springboard for the previous bullish move:
Bullish Pattern marked aligns with MMC’s concept of “Return to Origin”.
This zone also sits just above the right shoulder, confirming that buyers are defending aggressively.
If this level holds, we may see a strong continuation move to the upside.
🔸 3. Previous Reversal Zone (Supply) – Next Target Area
Marked in light green, this area is the next critical resistance:
Acts as liquidity target for institutions if price rallies.
Historically acted as a major reversal point.
Price is likely to show reactions or profit-taking behavior here.
Once broken and retested, it becomes a new support for further upside continuation (as marked on the chart).
🔸 4. Dual Scenarios – Bullish vs Bearish Pathways
Your chart correctly outlines two strategic possibilities:
✅ Bullish Scenario:
Price respects demand zone.
Breaks above previous reversal zone (149.000+).
Bullish continuation toward 149.800–150.500 range.
MMC tip: “If it goes bullish, use previous demand or double it” = Add confluence or stack demand zones for scale-in entries.
❌ Bearish Scenario:
If price breaks below retesting zone, bullish invalidation triggers.
Look to the previous all supply zone (Zone Pattern Must) for next reaction.
This scenario reflects smart money rejection of upside continuation.
🗂️ MMC Structural Elements Identified:
Zone/Pattern Role in Analysis
Inverse H&S Trend reversal signal
Retesting Zone Demand/entry area
Previous Reversal Zone First key resistance / next liquidity pool
Supply Zone Below Target in case of downside breakdown
MMC Logic Follow price structure, fakeouts, demand/supply traps
📈 Summary Outlook:
USDJPY is showing a technical bullish structure backed by MMC-based price psychology. The current pullback into a demand zone gives traders an excellent R:R opportunity for long positions, targeting higher zones upon breakout confirmation.
🟩 If bullish, breakout >149.000 will likely lead toward 150.000+
🟥 If bearish, breakdown <147.600 opens doors to deeper drop toward 146.000 zone (watch for reversal pattern).
🔑 Key Levels to Watch:
Type Level Range Notes
Support 147.600–147.800 Current retesting demand
Resistance 148.800–149.300 Previous Reversal Zone (Profit booking area)
Higher Resistance 150.500+ Final upside objective
Breakdown Zone <147.500 Flip to bearish scenario


Bullish reversal?USD/JPY is falling towards the support level, which is an overlap support that aligns with the 50% Fibonacci retracement and could bounce from this level to our take profit.
Entry: 145.84
Why we like it:
There is an overlap support that aligns with the 50% Fibonacci retracement.
Stop loss: 144.91
Why we like it:
There is a pullback support that is slightly below the 61.8% Fibonacci retracement.
Take profit: 147.15
Why we like it:
There is an overlap resistance that lines up with the 38.2% Fibonacci retracement.
Enjoying your TradingView experience? Review us!
Please be advised that the information presented on TradingView is provided to Vantage (‘Vantage Global Limited’, ‘we’) by a third-party provider (‘Everest Fortune Group’). Please be reminded that you are solely responsible for the trading decisions on your account. There is a very high degree of risk involved in trading. Any information and/or content is intended entirely for research, educational and informational purposes only and does not constitute investment or consultation advice or investment strategy. The information is not tailored to the investment needs of any specific person and therefore does not involve a consideration of any of the investment objectives, financial situation or needs of any viewer that may receive it. Kindly also note that past performance is not a reliable indicator of future results. Actual results may differ materially from those anticipated in forward-looking or past performance statements. We assume no liability as to the accuracy or completeness of any of the information and/or content provided herein and the Company cannot be held responsible for any omission, mistake nor for any loss or damage including without limitation to any loss of profit which may arise from reliance on any information supplied by Everest Fortune Group.

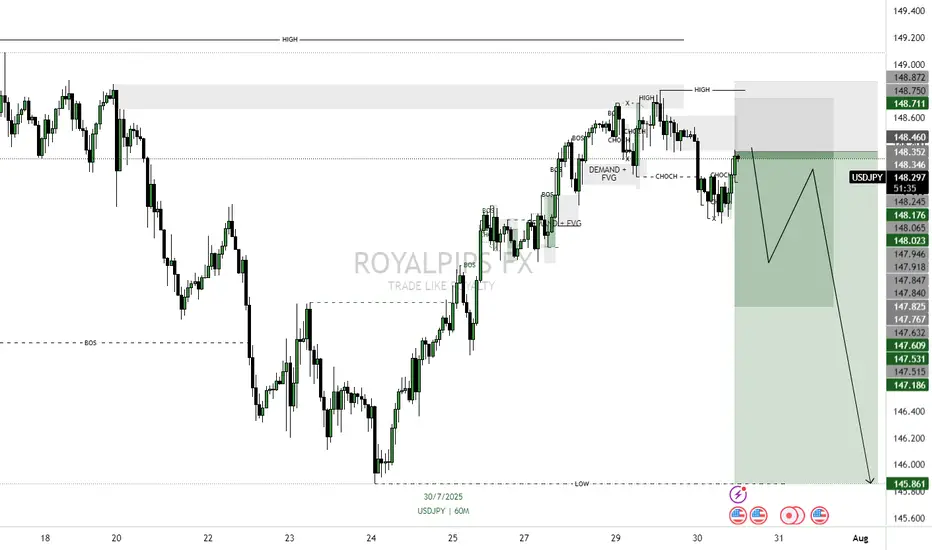
USDJPY – Liquidity Grab Before Continuation Down
**📉 USDJPY – Liquidity Grab Before Continuation Down**
📍 *Update to previous publication*
Following further technical analysis, the current price action suggests a **short-term bullish move** on USDJPY — likely acting as a **liquidity grab over previous session highs**.
This corrective movement is expected **before price resumes its broader bearish direction**.
🔍 Key observations:
* Price may seek short-term buy-side liquidity above recent highs.
* Liquidity engineering likely, especially around the **148.800 zone**.
* My **bias remains bearish**, but only **after liquidity is taken** and structure confirms a reversal.
Waiting for signs of exhaustion or confirmation around the upper FVG to align with the primary short thesis.
---DO NOT USE AS SIGNAL OR ANY OF A KIND--
EMERSON MASSAWE
COO | FINANCIAL MARKET ANALYST 6+
USDJPY – DAILY FORECAST Q3 | W31 | D29 | Y25📊 USDJPY – DAILY FORECAST
Q3 | W31 | D29 | Y25
Daily Forecast 🔍📅
Here’s a short diagnosis of the current chart setup 🧠📈
Higher time frame order blocks have been identified — these are our patient points of interest 🎯🧭.
It’s crucial to wait for a confirmed break of structure 🧱✅ before forming a directional bias.
This keeps us disciplined and aligned with what price action is truly telling us.
📈 Risk Management Protocols
🔑 Core principles:
Max 1% risk per trade
Only execute at pre-identified levels
Use alerts, not emotion
Stick to your RR plan — minimum 1:2
🧠 You’re not paid for how many trades you take, you’re paid for how well you manage risk.
🧠 Weekly FRGNT Insight
"Trade what the market gives, not what your ego wants."
Stay mechanical. Stay focused. Let the probabilities work.
OANDA:USDJPY

Bullish bounce off an overlap support?USD/JPY is falling towards the pivot, which has been identified as an overlap support and could bounce to the 1st resistance, which acts as a swing high resistance.
Pivot: 147.67
1st Support: 146.99
1st Resistance: 149.04
Risk Warning:
Trading Forex and CFDs carries a high level of risk to your capital and you should only trade with money you can afford to lose. Trading Forex and CFDs may not be suitable for all investors, so please ensure that you fully understand the risks involved and seek independent advice if necessary.
Disclaimer:
The above opinions given constitute general market commentary, and do not constitute the opinion or advice of IC Markets or any form of personal or investment advice.
Any opinions, news, research, analyses, prices, other information, or links to third-party sites contained on this website are provided on an "as-is" basis, are intended only to be informative, is not an advice nor a recommendation, nor research, or a record of our trading prices, or an offer of, or solicitation for a transaction in any financial instrument and thus should not be treated as such. The information provided does not involve any specific investment objectives, financial situation and needs of any specific person who may receive it. Please be aware, that past performance is not a reliable indicator of future performance and/or results. Past Performance or Forward-looking scenarios based upon the reasonable beliefs of the third-party provider are not a guarantee of future performance. Actual results may differ materially from those anticipated in forward-looking or past performance statements. IC Markets makes no representation or warranty and assumes no liability as to the accuracy or completeness of the information provided, nor any loss arising from any investment based on a recommendation, forecast or any information supplied by any third-party.

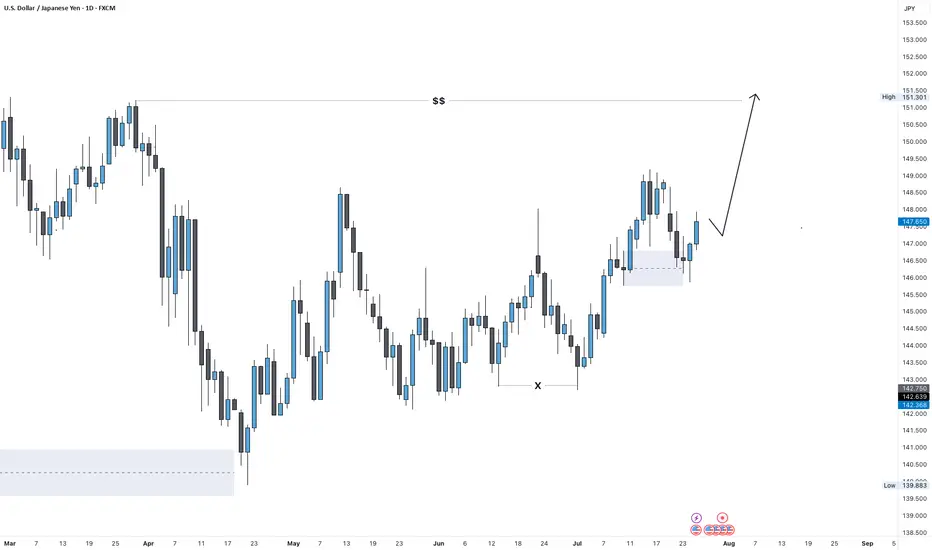
USD/JPY Outlook: Bullish Target Set at 151.0 USD/JPY Weekly Forecast – July Week 4
Last week, USD/JPY retested a weekly Fair Value Gap and closed with strong bullish pressure, confirming demand. Now, the next key liquidity level sits around 151.00 — just above the previous major highs.
On the daily timeframe, we may see a bearish retest toward 147.00 early in the week. From there, supported by both Federal Reserve sentiment and a bullish dollar, price could launch a strong bullish move to sweep the 151.00 highs.
Bias: Bullish
Key Zones:
• Support / Retest: 147.00
• Target: 151.00
• FVG Reaction: Confirmed on weekly close
The setup aligns with dollar strength and clean bullish structure.
—
Weekly forecast by Sphinx Trading
Drop your view in the comments.
#USDJPY #ForexForecast #SmartMoney #LiquidityTargets #SphinxWeekly #DollarStrength #PriceAction #FVG
July 29, Forex Outlook : High-Reward Setups You Shouldn’t Miss!Welcome back, traders!
In today’s video, we’ll be conducting a Forex Weekly Outlook, analyzing multiple currency pairs from a top-down perspective—starting from the higher timeframes and working our way down to the lower timeframes.
Pairs to focus on this Week:
USDJPY
AUDJPY
CADJPY
EURGBP
GBPCHF
USDCHF
NZDCHF
EURNZD
Our focus will be on identifying high-probability price action scenarios using clear market structure, institutional order flow, and key confirmation levels. This detailed breakdown is designed to give you a strategic edge and help you navigate this week’s trading opportunities with confidence.
📊 What to Expect in This Video:
1. Higher timeframe trend analysis
2. Key zones of interest and potential setups
3. High-precision confirmations on lower timeframes
4. Institutional insight into where price is likely to go next
Stay tuned, take notes, and be sure to like, comment, and subscribe so you don’t miss future trading insights!
Have a great week ahead, God bless you!
The Architect 🏛️📉

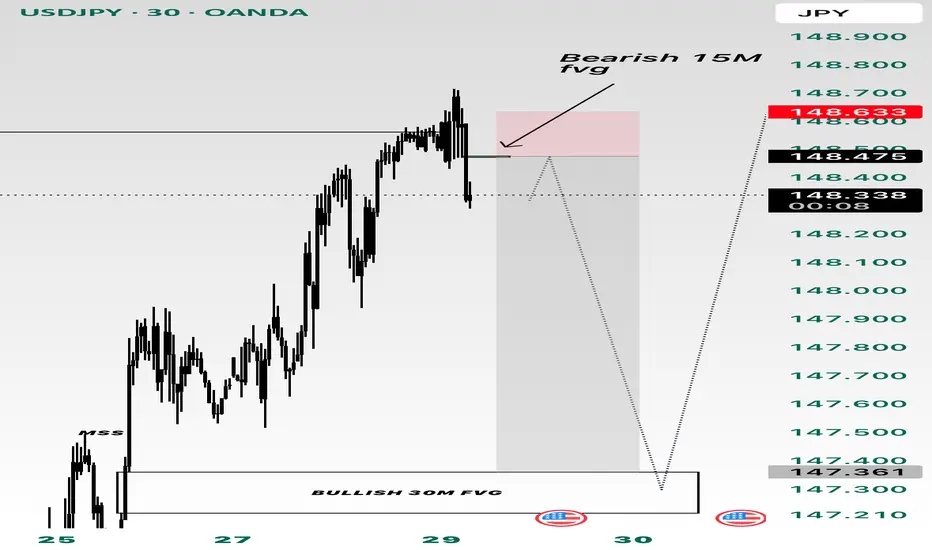
USDJPY USDJPY has reached liquidity level on the higher timeframe. A bearish 15M FVG has formed and I’m going to short to the 30/1H FVG gap. And then look for long positions
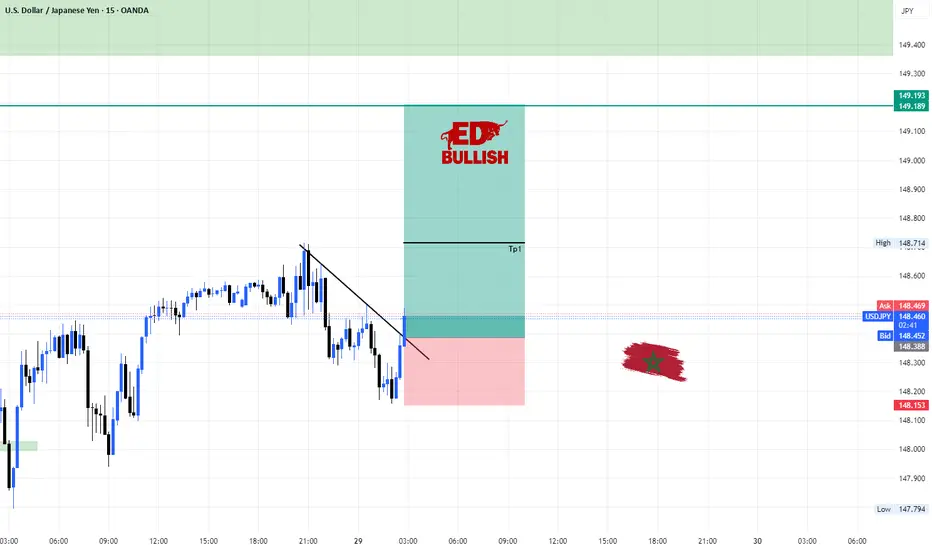
USDJPY long position 29/07/2025English : According to our analysis, we anticipate a bearish scenario.
Morocan Darija : kanchofo d'apres l'analyse dyalna antsanaw hboot
ATENTION : I only share my ideas, not signals
if TP1 hit i will move SL to BE
USDJPY (daily + Monthly analysis)hi everyone happy trading as always hope this video finds you some value.

USDJPY: Breaking Out With Macro Backing 🟢 USDJPY | Breakout Opportunity Above Resistance
Timeframe: 1H
Bias: Bullish
Type: Break and Retest
📊 Technical Setup
USDJPY is currently consolidating at a key 4H resistance zone (147.75–147.90). A clean breakout and retest of this area will confirm bullish continuation.
• Entry: Above 147.90 (after confirmed candle close + retest)
• SL: Below 147.30
• TP: 148.90 / 149.60
• RR: ~1:2.5
• Indicators: RSI showing strong upside momentum, holding above 50
🧠 Fundamentals + Macro Confluence
• USD Strength: Strong macro & delayed rate cuts support USD upside
• JPY Weakness: BOJ remains dovish; risk-on sentiment weighing on JPY
• COT + Conditional Score: USD score increased to 17, JPY dropped to 8
• Risk Sentiment: VIX at 14.2 = RISK ON → bearish JPY bias
🧭 Gameplan
“Wait for confirmation above resistance before entering”
🔔 Set alerts around 147.90 and monitor lower timeframes for retest and bullish candle structure.
USDJPY (daily analysis) 1/8hi everyone hope everyone had a great week and have a great weekend happy trading as always

USDJPY new highs on the horizon?we might begin the week with some short-term bearish moves. hopefully we get the needed bullish pressure to push us towards new highs

USDJPY POTENTIAL CONTINUATION AFTER A PULLBACKPrice has returned to the recent demand zone after a BOS and is now showing signs of rejection following a pullback (retracement). The mitigation of the DEMAND zone suggests that institutions may have filled their buy orders and are now ready to push price higher.
📉 Execution Plan:
• Entry: On the demand zone
• SL: Just below the demand zone (allow breathing room).
• TP: Next supply zone or based on structure (e.g., swing high, imbalance fill).
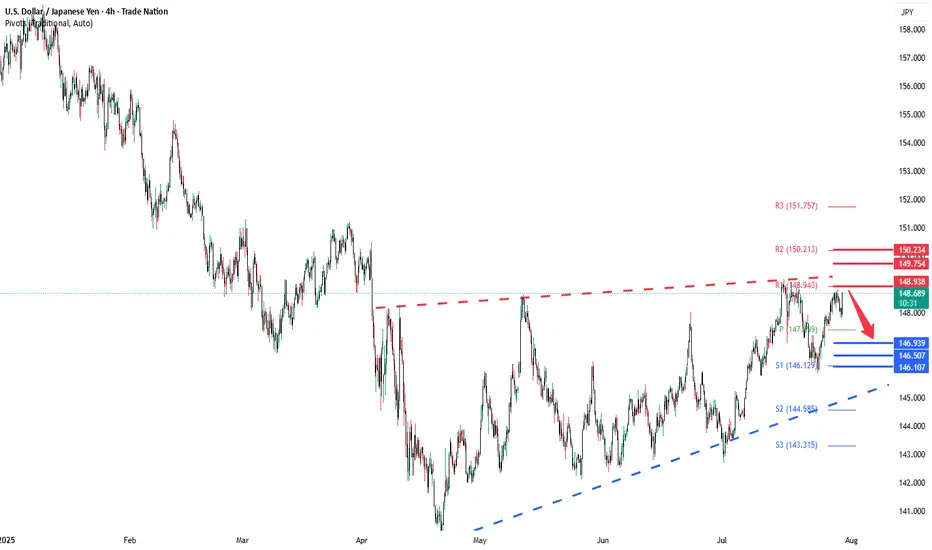
USDJPY rising wedge capped at 148,90The USDJPY pair is currently trading with a bearish bias, aligned with the broader downward trend. Recent price action shows a retest of the falling resistance, suggesting a temporary relief rally within the downtrend.
Key resistance is located at 149.90, a prior consolidation zone. This level will be critical in determining the next directional move.
A bearish rejection from 148.90 could confirm the resumption of the downtrend, targeting the next support levels at 146.93, followed by 146.50 and 146.10 over a longer timeframe.
Conversely, a decisive breakout and daily close above 148.93 would invalidate the current bearish setup, shifting sentiment to bullish and potentially triggering a move towards 149.75, then 150.20.
Conclusion:
The short-term outlook remains bearish unless the pair breaks and holds above 148.90. Traders should watch for price action signals around this key level to confirm direction. A rejection favours fresh downside continuation, while a breakout signals a potential trend reversal or deeper correction.
This communication is for informational purposes only and should not be viewed as any form of recommendation as to a particular course of action or as investment advice. It is not intended as an offer or solicitation for the purchase or sale of any financial instrument or as an official confirmation of any transaction. Opinions, estimates and assumptions expressed herein are made as of the date of this communication and are subject to change without notice. This communication has been prepared based upon information, including market prices, data and other information, believed to be reliable; however, Trade Nation does not warrant its completeness or accuracy. All market prices and market data contained in or attached to this communication are indicative and subject to change without notice.
USD-JPY Is Overbought! Sell!
Hello,Traders!
USD-JPY is trading in a
Strong uptrend and the pair
Will soon hit a horizontal
Resistance of 149.200
So after the retest a
Local bearish pullback
Is to be expected
Sell!
Comment and subscribe to help us grow!
Check out other forecasts below too!
Disclosure: I am part of Trade Nation's Influencer program and receive a monthly fee for using their TradingView charts in my analysis.
USD/JPY Stepping Up to Key Resistance Ahead of Fed, BoJIt's a big week for both the U.S. Dollar and the Japanese Yen.
Last week started with a sell-off in USD/JPY following results of elections that came in over the weekend. I looked at support structure in the pair shortly after, and the 145.92 level came into play to hold the lows in early-Thursday trade and since then bulls have been going to work.
The pair is now nearing a big batch of resistance with the July high of 149.19 followed by the 200-day moving average and the 150.00 handle in the pair.
USD/JPY is key for larger themes of USD-strength and if we do hear the Powell talk down the prospect of a September cut, and the BoJ relax on rate hike talk, there could be bullish fundamental move to be priced-in on the pair this week. - js
