USDJPY trade ideas
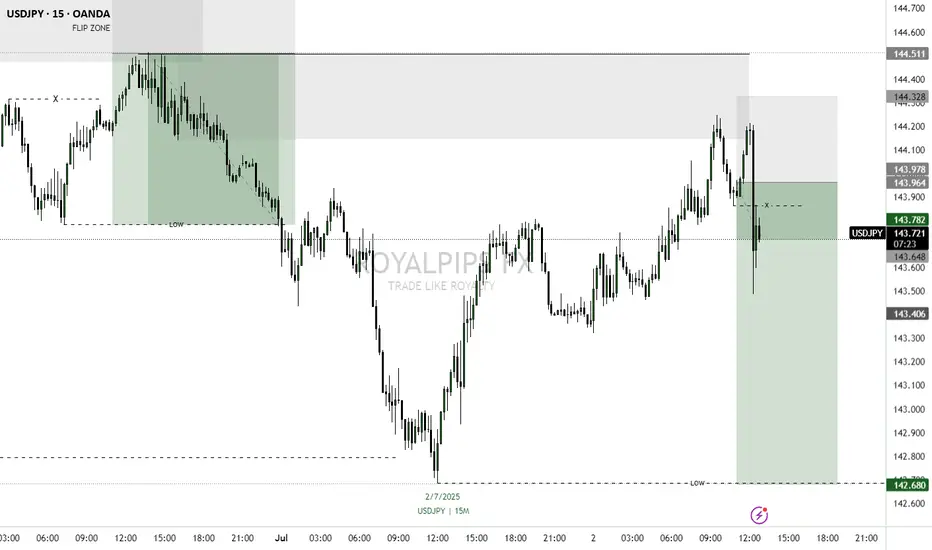
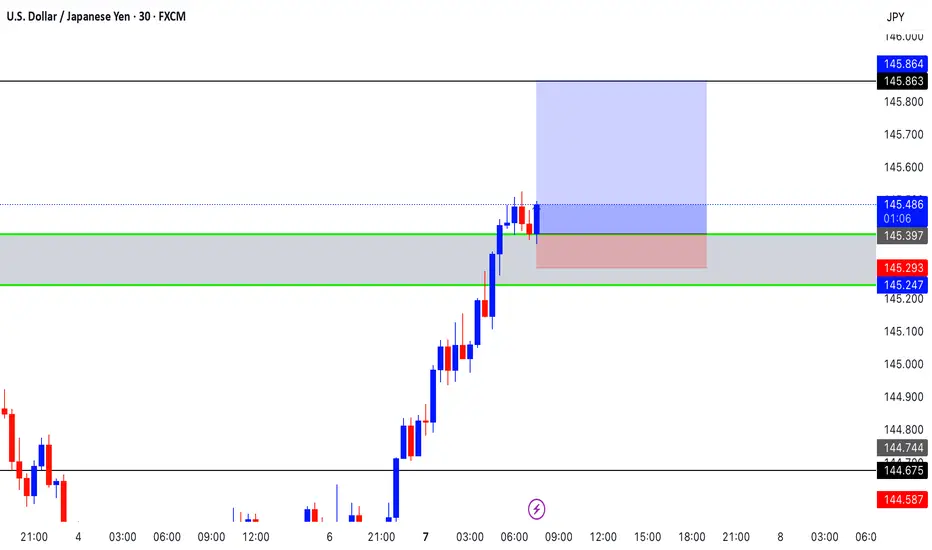
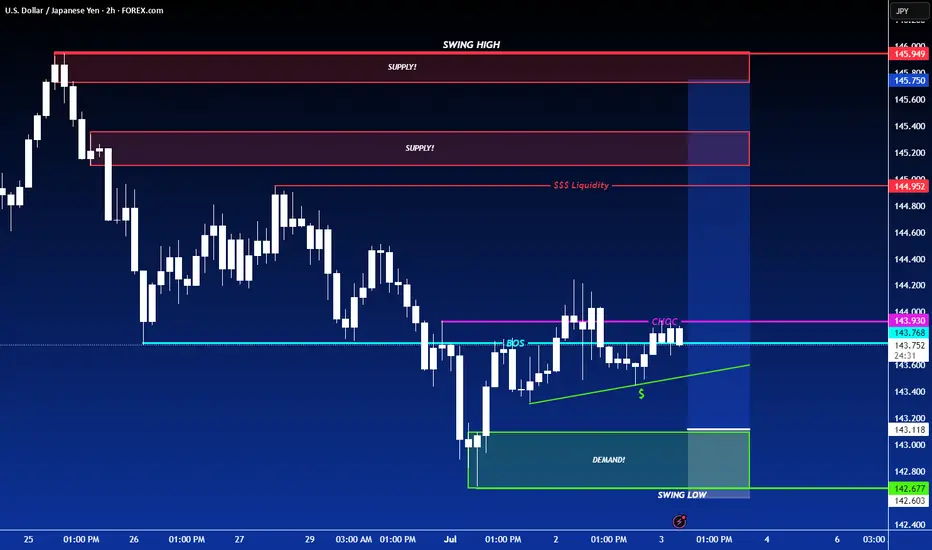
USDJPY GOING SHORT🔥 Sellers in control after breaking structure.
🎯 TP: Demand Zone below
🛑 SL: Just above Supply
🔴 Looking to sell the premium and ride the drop!
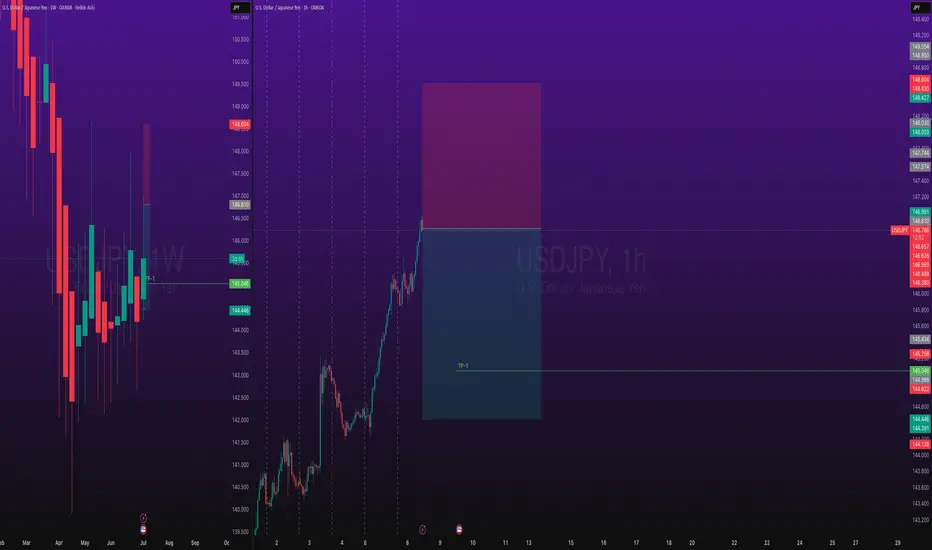
X1: USDJPY Short TradeFX:USDJPY Short swing trade, with my back testing of this strategy, it hits multiple possible take profits, manage your position accordingly.
Risking 1% to make 1.35%
Don't overload your risk like greedy, be disciplined trader, this is good trade.
Use proper risk management
Looks like good trade.
Lets monitor.
Use proper risk management.
Disclaimer: only idea, not advice
USDJPY continuation buyThe daily bias is still bullish. I am looking to take profit at the daily resistance above 148.430
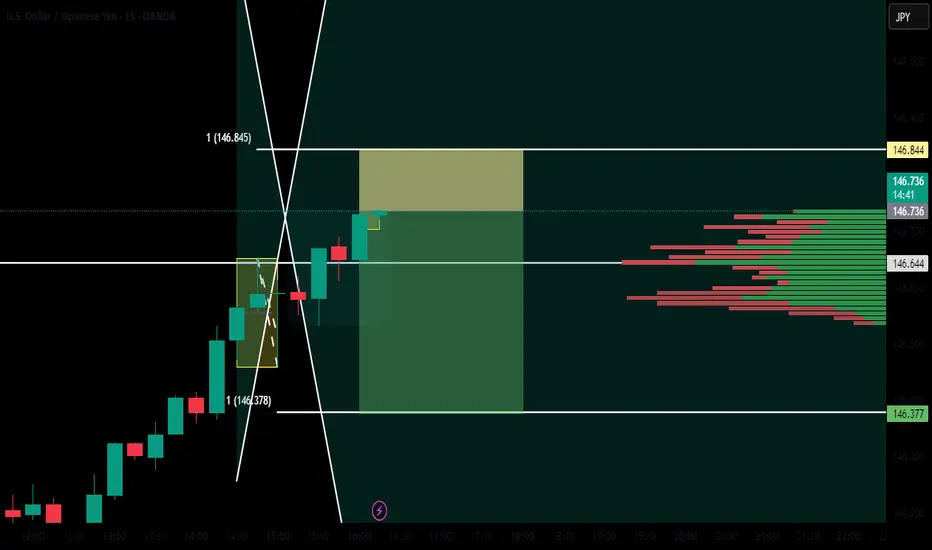
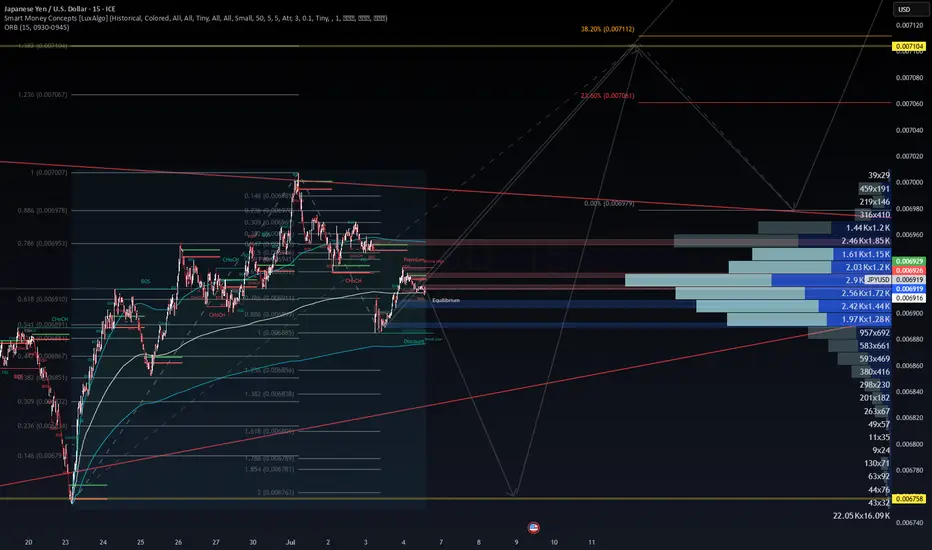
WaverVanir DSS Trade Plan – JPYUSD=X (July 6, 2025)🧭 Directional Bias: Bullish Reversal from Discount Zone
📉 Current Price: 0.006919
🧠 Thesis:
Price reacted strongly from the Discount Wick Low Zone (≈ 0.006885–0.006856).
The current structure shows:
✅ CHoCH to the upside near the EQ
✅ Volume cluster support at 0.00691
🟦 Liquidity sweep occurred at prior lows.
Expecting a reversal back into Premium zone toward Fibonacci extension clusters near 0.00707–0.00711.
🎯 Trade Setup: Long JPY/USD (Short USD/JPY)
Element Value / Zone
Entry Zone 0.00691–0.00692 (Equilibrium / 0.618 Fib)
Stop Loss (SL) 0.006875 (below recent Discount Low / 0.786 Fib)
Take Profit 1 0.006978 (0.886 Fib / SMC Break level)
Take Profit 2 0.00707 (1.236 Fib / major OB target)
Take Profit 3 0.007112 (38.2% extension – long-term target)
Risk-Reward TP1 ≈ 2.3:1, TP2 ≈ 3.6:1, TP3 ≈ 5.4:1
🔍 Volume Profile Insight:
Heavy accumulation at:
0.00691 (high confluence of OB, Fib, and volume)
Above 0.00695, price enters "inefficient" zone → price may accelerate rapidly.
Most volume near 0.00692 confirms institutional interest.
🔐 Risk Management:
Max 1–2% capital exposure per position
Position sizing should reflect SL width of ~4.4 pips
Trailing stop once TP1 is reached to protect profits
🔄 Alternate Scenario (Invalidate if):
Price breaks and closes below 0.006875 with high volume
Then, revisit 0.006758 (Golden Zone) as next long accumulation zone
Consider reversing bias if a CHoCH to the downside occurs post TP1 rejection
⏱️ Timeframe:
Holding Period: 2–5 days (swing scalping opportunity)
Suitable for: CFD traders, JPY futures traders (e.g., J6), or FX options buyers
🔗 Suggested Option Strategy (for FX traders using options):
Bull Call Spread on JPYUSD=X or inverse Put Spread on USDJPY
Strike range:
Expiry: July 12–19
✅ Summary:
Execute long from Equilibrium zone (~0.00691) toward 0.00707–0.00711. Strong confluence from Fib extensions, SMC structure, and volume profile validates a reversal.
Protect with tight SL under 0.006875. Scale out at key premiums.
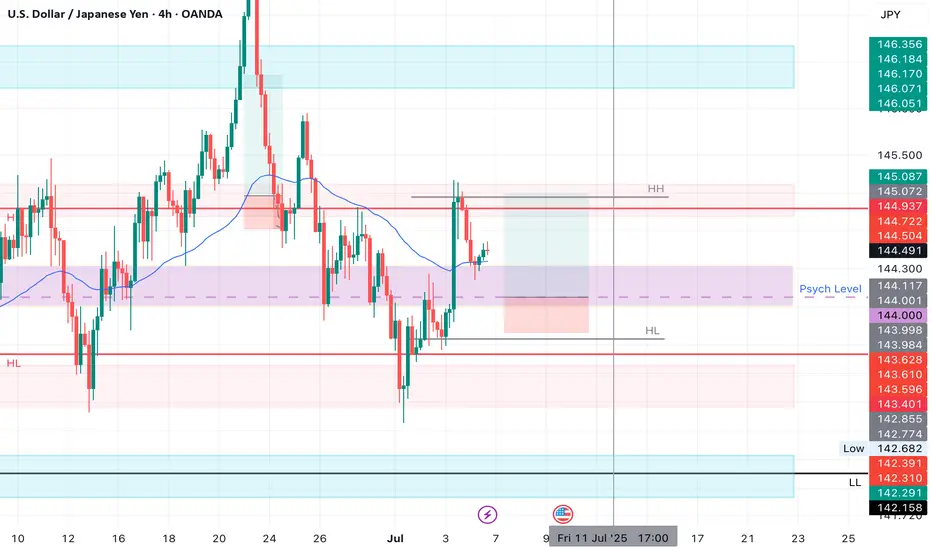
USDJPY LONGMarket structure bullish on HTFs DH
Entry at both Weekly and Daily AOi
Weekly Rejection at AOi
Daily Rejection At AOi
Previous Structure point Daily
Around Psychological Level 144.000
H4 Candlestick rejection
Rejection from Previous structure
Levels 2.91
Entry 95%
REMEMBER : Trading is a Game Of Probability
: Manage Your Risk
: Be Patient
: Every Moment Is Unique
: Rinse, Wash, Repeat!
: Christ is King.
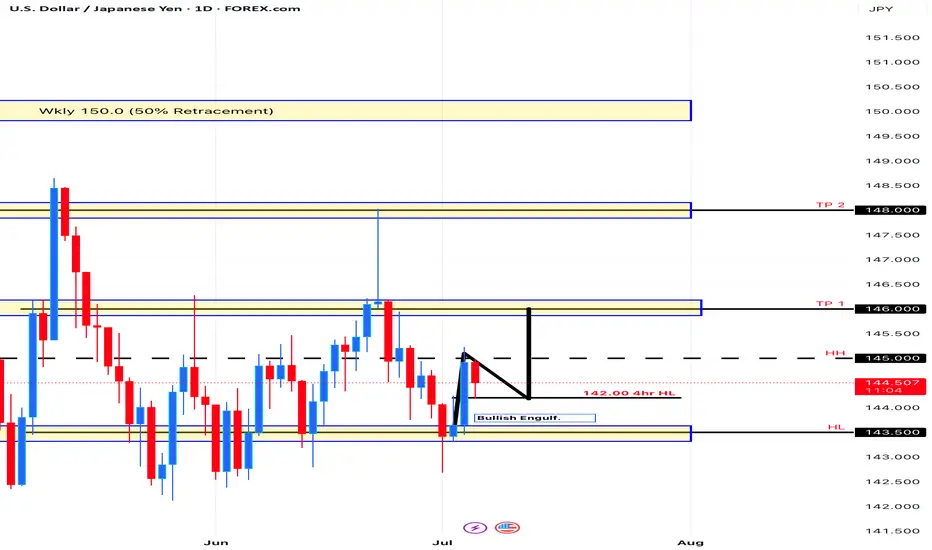
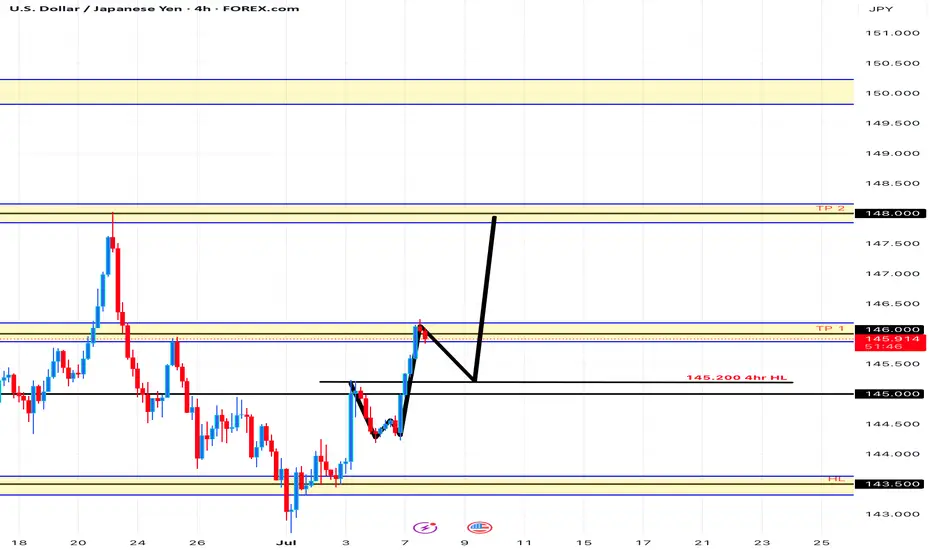
Uptrend USD/JPYDaily - uptrend
4hr- uptrend
Price hit a key level at 145.000
We can possibly see a retrace back to the 4hr HL @ 144.200 then shoot up to the 1st TP @ 146.000
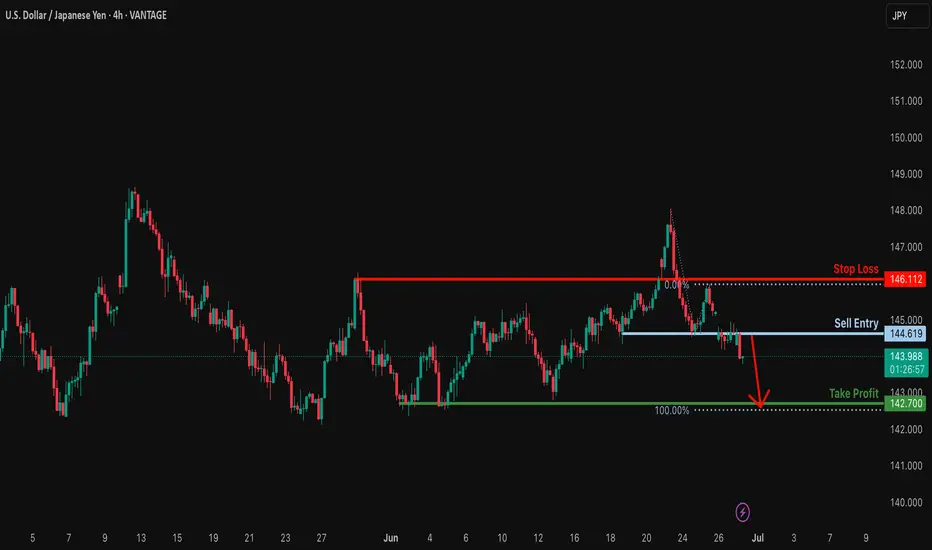
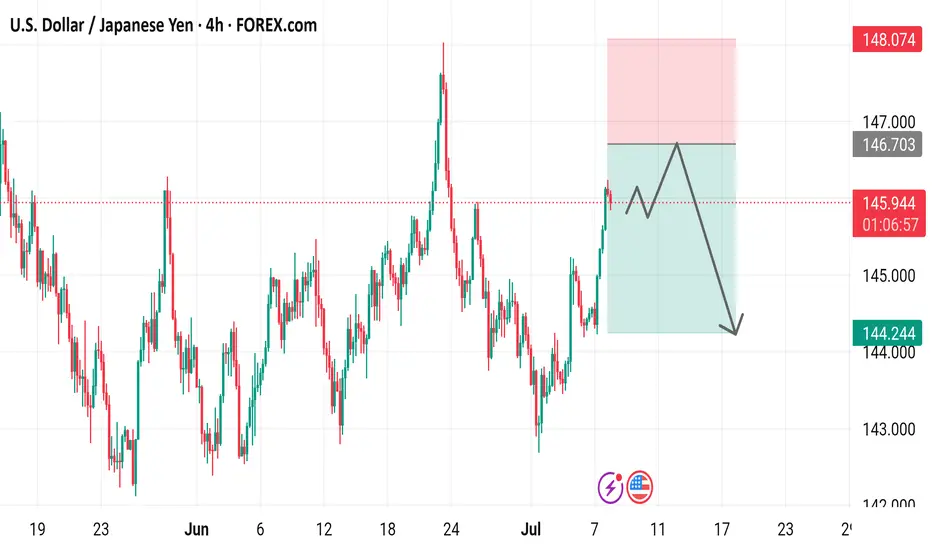
Potential bearish drop?USD/JPY has rejected off the resistance level which is a pullback resistance and could drop from this level to our take profit.
Entry: 144.61
Why we like it:
There is a pullback resistance level.
Stop loss: 146.11
Why we like it:
There is a pullback resistance level.
Take profit: 142.70
Why we like it:
There is a pullback support level that lines up with the 100% Fibonacci projection.
Enjoying your TradingView experience? Review us!
Please be advised that the information presented on TradingView is provided to Vantage (‘Vantage Global Limited’, ‘we’) by a third-party provider (‘Everest Fortune Group’). Please be reminded that you are solely responsible for the trading decisions on your account. There is a very high degree of risk involved in trading. Any information and/or content is intended entirely for research, educational and informational purposes only and does not constitute investment or consultation advice or investment strategy. The information is not tailored to the investment needs of any specific person and therefore does not involve a consideration of any of the investment objectives, financial situation or needs of any viewer that may receive it. Kindly also note that past performance is not a reliable indicator of future results. Actual results may differ materially from those anticipated in forward-looking or past performance statements. We assume no liability as to the accuracy or completeness of any of the information and/or content provided herein and the Company cannot be held responsible for any omission, mistake nor for any loss or damage including without limitation to any loss of profit which may arise from reliance on any information supplied by Everest Fortune Group.
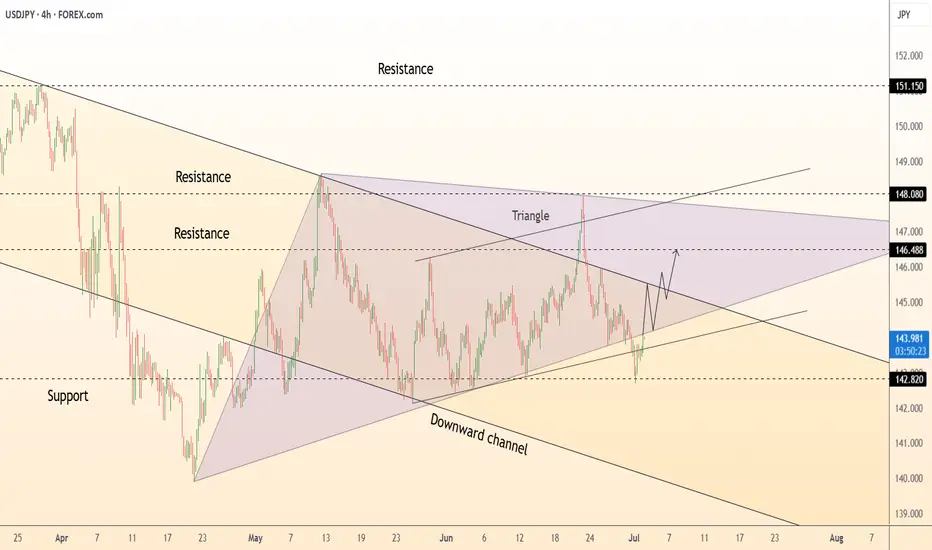
DeGRAM | USDJPY formed the triangle📊 Technical Analysis
● Price defended the 142.80 confluence (triangle base + channel median), printing a bullish hammer and reclaiming the short-term trendline; structure now forms an ascending triangle inside the broader consolidation.
● Momentum is rising toward 146.50 – the pattern’s 1:1 swing and prior supply – with the next objective the upper triangle wall at 148.10. Invalid if candles fall back under 142.80.
💡 Fundamental Analysis
● Rebound in US ISM manufacturing and Fed minutes hinting “no near-term cuts” lifted 2-yr yields, while weak Japanese wage growth keeps the BoJ patient. The widening policy gap revives USD/JPY bid.
✨ Summary
Long 143.4-144.1; targets 146.5 then 148.1. Exit on a 4 h close below 142.8.
-------------------
Share your opinion in the comments and support the idea with like. Thanks for your support!
USD/JPY Uptrend On the 4hr We can still see price making Higher Lows and Higher Highs.
Price will retrace to 145.200-145.000 before going back up to 148.000.
USD/JPY 4-Hour Chart Analysis4-hour chart for the U.S. Dollar/Japanese Yen (USD/JPY) currency pair, sourced from The chart displays the exchange rate's fluctuations over time, with key indicators and annotations
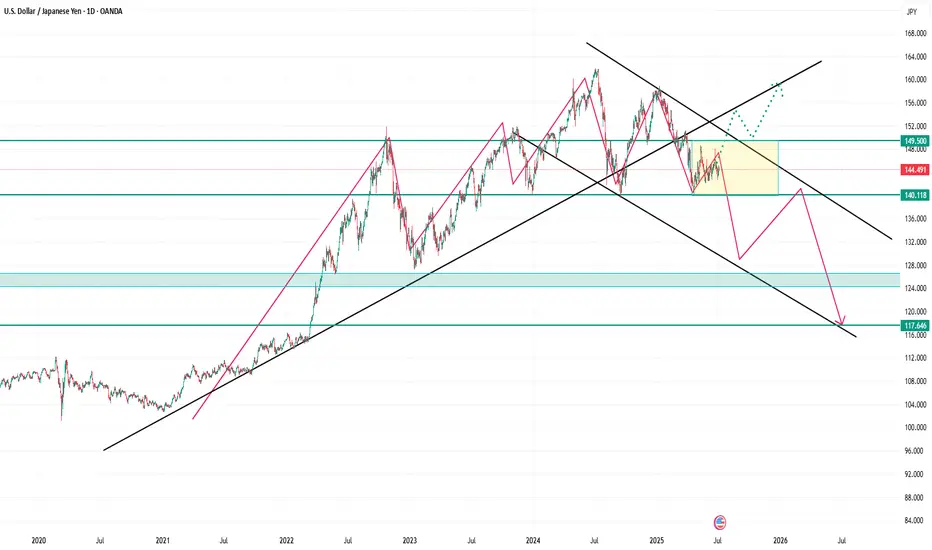
USD/JPY at Crossroads: Breakout or Big Drop Ahead? USD/JPY Analysis – July 2025
🔍 Technical:
Price: 144.50
Key Resistance: 149.50
Key Support: 140.12, then 117.64
Two possible moves:
Bullish: Break above 149.50 → Target 156+
Bearish: Stay below 149.50 → Drop to 140 → 128 → 117
🌍 Fundamental:
USD Strength: If inflation stays high, Fed may delay rate cuts.
JPY Strength: BOJ may shift policy or intervene if Yen weakens more.
🔑 Upcoming Events:
July 11 – US CPI
BOJ outlook & Fed comments matter
🎯 Outlook:
Bearish bias if price stays below 149.50.
Bullish only if clean breakout above resistance.
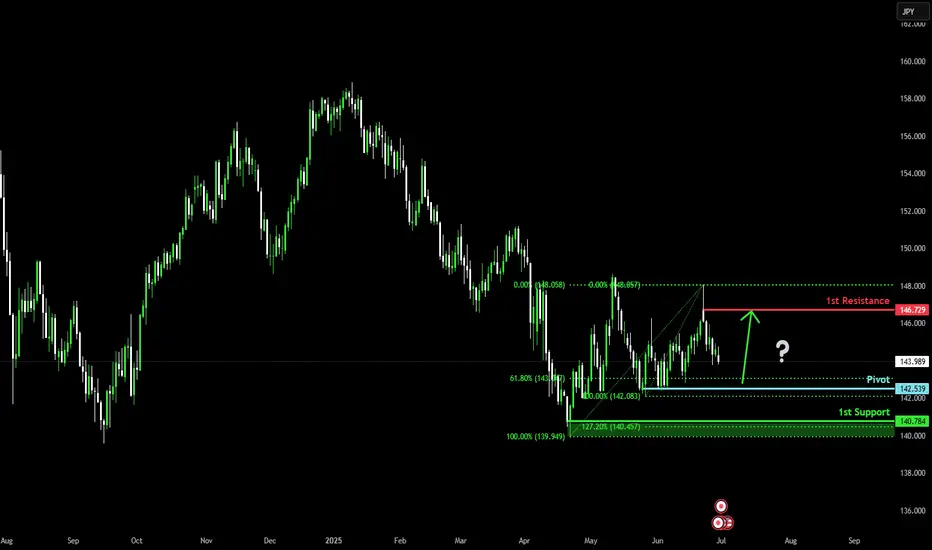
Bullish bounce off pullback support?USD/JPY is falling towards the pivot and could bounce to the 1st resistance, which is a pullback resistance.
Pivot: 142.53
1st Support: 140.78
1st Resistance: 146.72
Risk Warning:
Trading Forex and CFDs carries a high level of risk to your capital and you should only trade with money you can afford to lose. Trading Forex and CFDs may not be suitable for all investors, so please ensure that you fully understand the risks involved and seek independent advice if necessary.
Disclaimer:
The above opinions given constitute general market commentary, and do not constitute the opinion or advice of IC Markets or any form of personal or investment advice.
Any opinions, news, research, analyses, prices, other information, or links to third-party sites contained on this website are provided on an "as-is" basis, are intended only to be informative, is not an advice nor a recommendation, nor research, or a record of our trading prices, or an offer of, or solicitation for a transaction in any financial instrument and thus should not be treated as such. The information provided does not involve any specific investment objectives, financial situation and needs of any specific person who may receive it. Please be aware, that past performance is not a reliable indicator of future performance and/or results. Past Performance or Forward-looking scenarios based upon the reasonable beliefs of the third-party provider are not a guarantee of future performance. Actual results may differ materially from those anticipated in forward-looking or past performance statements. IC Markets makes no representation or warranty and assumes no liability as to the accuracy or completeness of the information provided, nor any loss arising from any investment based on a recommendation, forecast or any information supplied by any third-party.
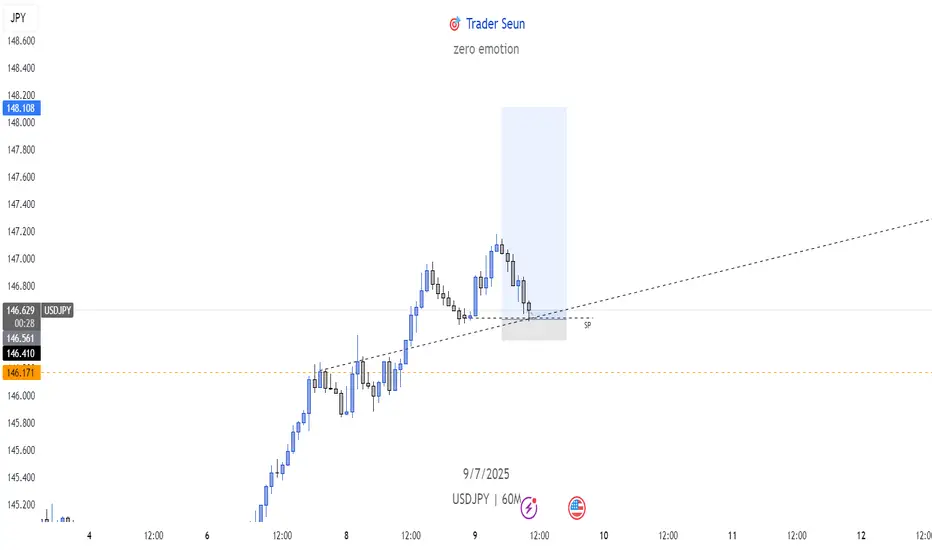
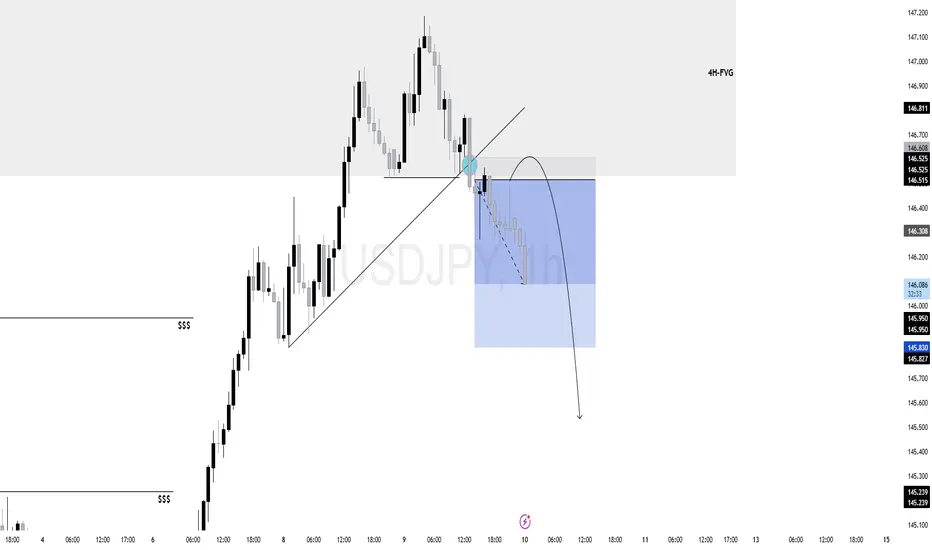
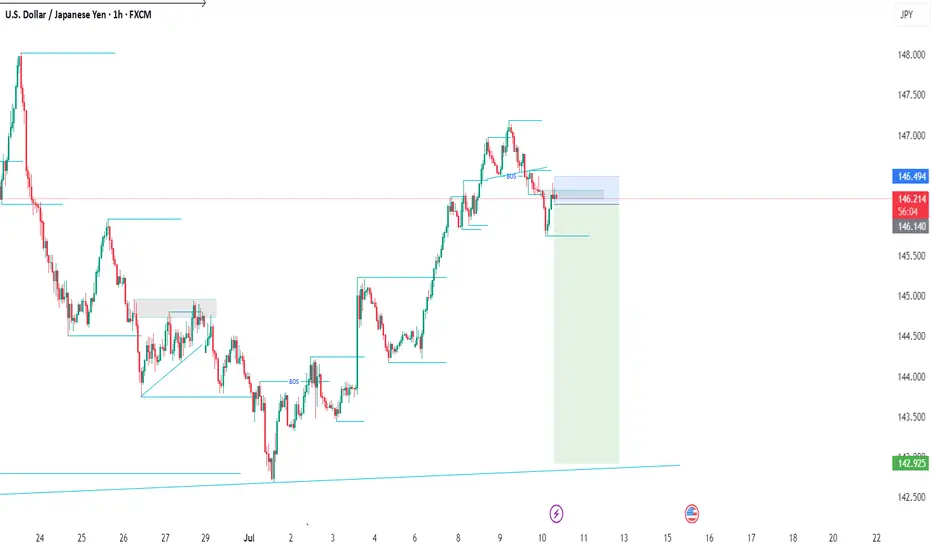
$UJ (USDJPY) 1HPrice tapped into a 4H FVG (gray zone 146.800–146.300), a high-probability reversal zone when paired with liquidity sweep and break of structure.
The bullish internal trendline was cleanly broken, signaling a short-term shift in momentum.
Prior to the drop, price ran buy-side liquidity resting above previous highs (marked $$$), fulfilling liquidity objectives before reversing.
The move into the 4H-FVG occurred in premium territory, ideal for institutional distribution.
As long as price holds below 146.300 (top of the FVG), the bearish leg remains valid.
Next liquidity target is around 145.240, where previous sell-side liquidity (lows marked $$$) is resting.
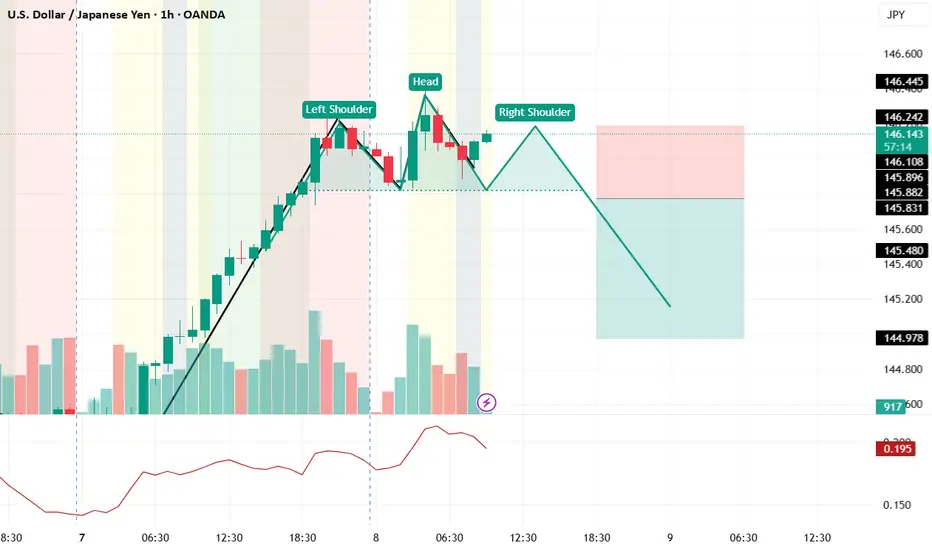
usdjpy head and shoulder emergingexperimental !!! it can be a possible scenario , pls feel free to coment and share your ideas with me hop you have green portfolio!!!
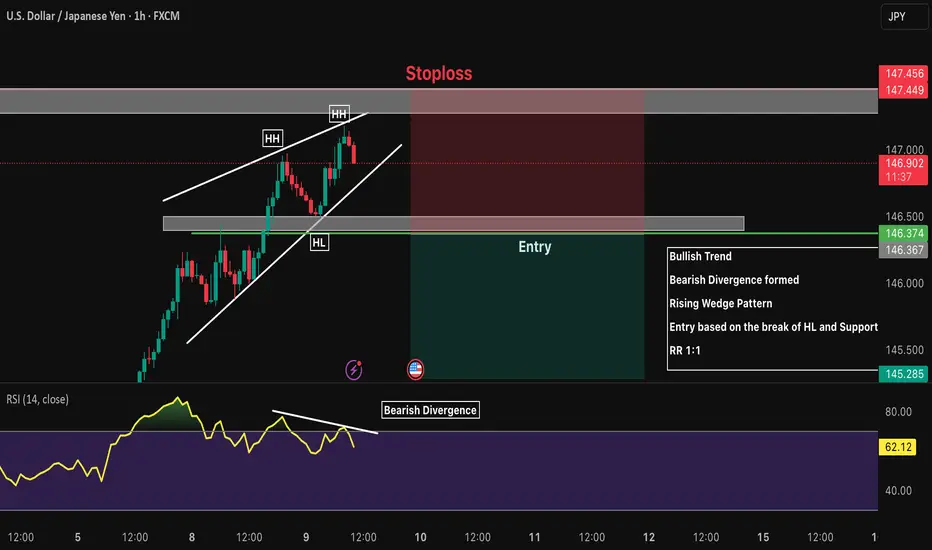
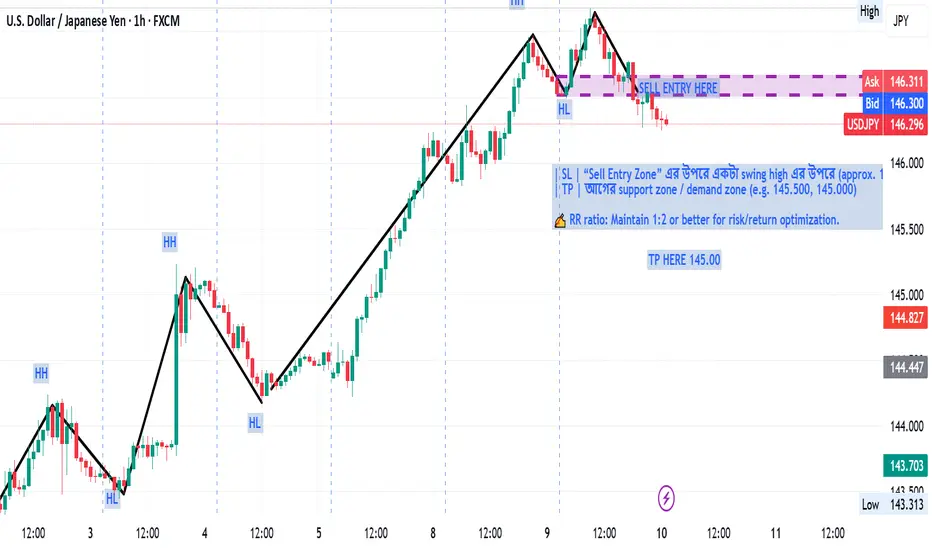
USDJPY 1H Short Bullish Trend
Bearish Divergence formed
Rising Wedge Pattern
Entry based on the break of HL and Support
RR 1:1
LONG ON USD/JPYUSD/JPY has given us a CHOC (change of character) from down to up.
It has engineered sell side liquidity right above a demand zone.
I expect price to sweep sell side liquidity, tap into the demand zone then take off to the upside.
looking to catch 150-250 pips on UJ. (Economic News could set this trade on Fire!)
USDJPY SELLWe have officially gotten a change of trend as proven by the transition from a sequence of higher highs and higher lows to a lower low and lower high. Stacked on top of this sequence is a pullback for a retest of a key level confirming our setup.
USDJPY SELLGet real time data on the USD/JPY pair including the live rate, as well as our currency converter, analysis, news, historical data and more.
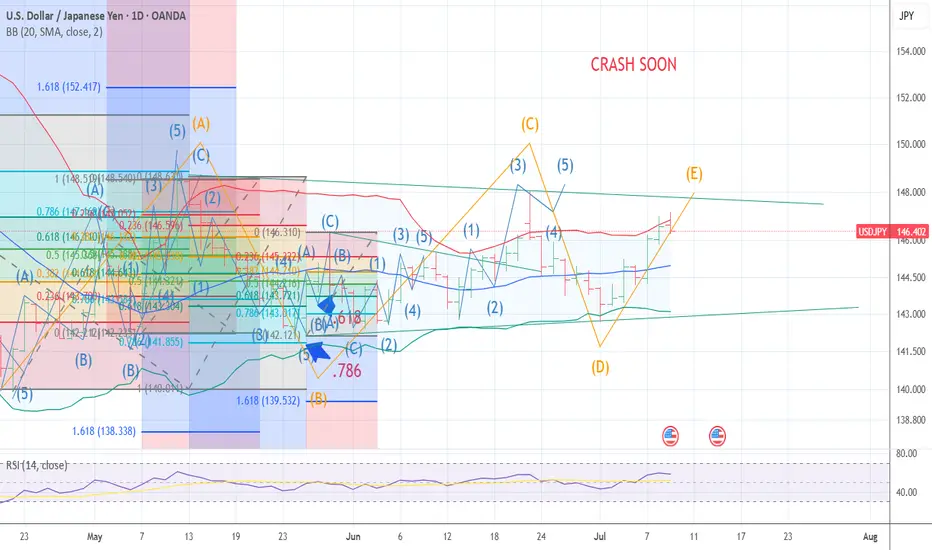
YEN CARRY TRADE TICK TICK BOOM WAVE E The chart posted is my work on the yen trade I have maintained the same labeling and as you can see What I think is rather near . I am major bearish the US stock market and I am starting to reposition for a MAJOR DOWN TURN into mid OCT the 10th best of trades WAVETIMER
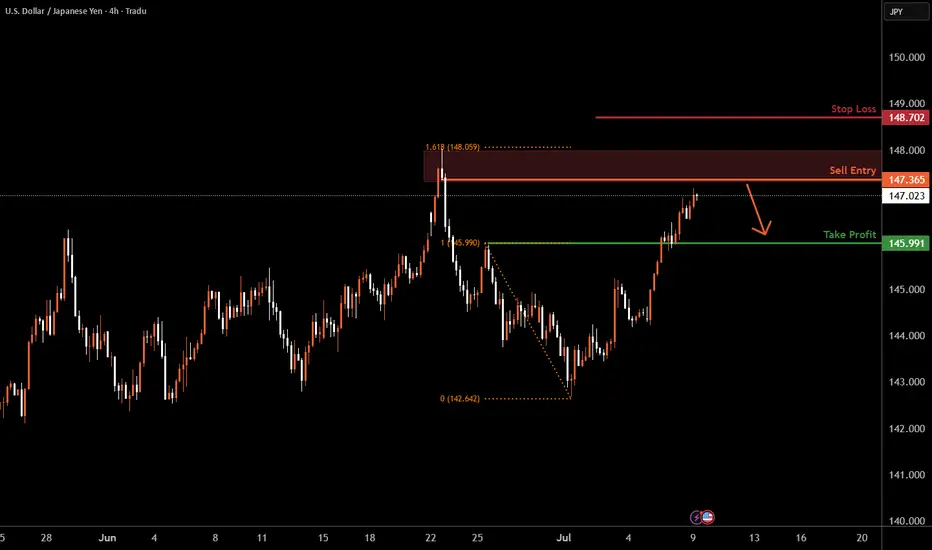
USDJPY H4 I Bearish Reversal Based on the H4 chart analysis, the price is approaching our buy entry level at 147.36, a pullback support that aligns closely with the 161.8% Fib retracement.
Our take profit is set at 145.99, a pullback support.
The stop loss is placed at 148.70, above the 161.8% Fib extension.
High Risk Investment Warning
Trading Forex/CFDs on margin carries a high level of risk and may not be suitable for all investors. Leverage can work against you.
Stratos Markets Limited (tradu.com ):
CFDs are complex instruments and come with a high risk of losing money rapidly due to leverage. 63% of retail investor accounts lose money when trading CFDs with this provider. You should consider whether you understand how CFDs work and whether you can afford to take the high risk of losing your money.
Stratos Europe Ltd (tradu.com ):
CFDs are complex instruments and come with a high risk of losing money rapidly due to leverage. 63% of retail investor accounts lose money when trading CFDs with this provider. You should consider whether you understand how CFDs work and whether you can afford to take the high risk of losing your money.
Stratos Global LLC (tradu.com ):
Losses can exceed deposits.
Please be advised that the information presented on TradingView is provided to Tradu (‘Company’, ‘we’) by a third-party provider (‘TFA Global Pte Ltd’). Please be reminded that you are solely responsible for the trading decisions on your account. There is a very high degree of risk involved in trading. Any information and/or content is intended entirely for research, educational and informational purposes only and does not constitute investment or consultation advice or investment strategy. The information is not tailored to the investment needs of any specific person and therefore does not involve a consideration of any of the investment objectives, financial situation or needs of any viewer that may receive it. Kindly also note that past performance is not a reliable indicator of future results. Actual results may differ materially from those anticipated in forward-looking or past performance statements. We assume no liability as to the accuracy or completeness of any of the information and/or content provided herein and the Company cannot be held responsible for any omission, mistake nor for any loss or damage including without limitation to any loss of profit which may arise from reliance on any information supplied by TFA Global Pte Ltd.
The speaker(s) is neither an employee, agent nor representative of Tradu and is therefore acting independently. The opinions given are their own, constitute general market commentary, and do not constitute the opinion or advice of Tradu or any form of personal or investment advice. Tradu neither endorses nor guarantees offerings of third-party speakers, nor is Tradu responsible for the content, veracity or opinions of third-party speakers, presenters or participants.
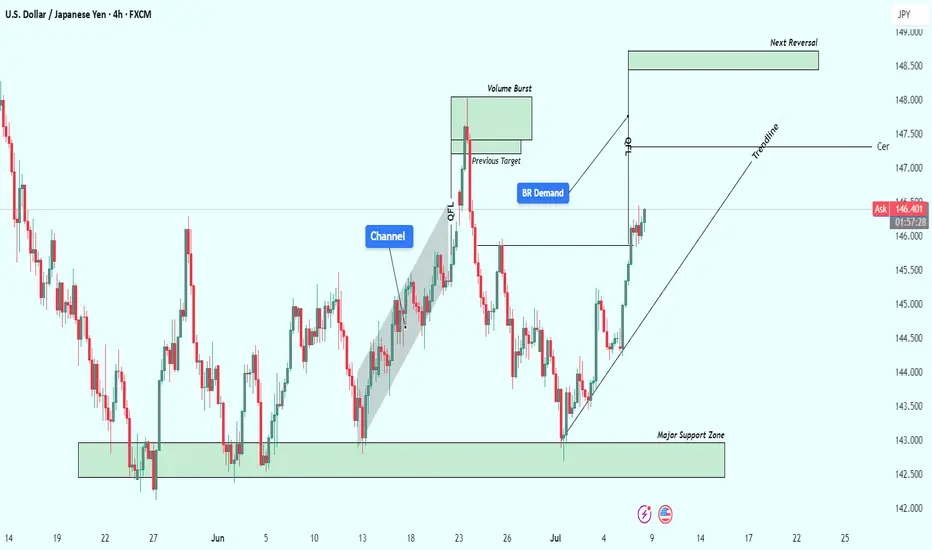
USDJPY Structural Analysis : Breakout Demand Play + Target🗺️ Market Structure & Key Technical Zones
On the USDJPY 4-hour timeframe, the market is clearly respecting smart money levels and giving us an ideal case study of institutional demand, trend continuation, and liquidity engineering.
🔰 1. Major Support Zone (142.500 – 143.200):
This zone acted as a high-value area where price consolidated previously before rallying. It has been tested multiple times and each touch has led to a strong bullish reaction, indicating accumulation by large players.
Think of this zone as the market’s base camp — when price visits it, big money steps in to reload longs.
🔰 2. Channel Formation & Breakout:
A clean bullish channel formed mid-June, with price respecting both bounds while gradually climbing. Once the channel was broken with strong volume (noted by the breakout candle), it suggested a shift from controlled bullish flow to an impulsive move — a change in pace that often indicates smart money is active.
🧱 Institutional Concepts in Action
🔵 QFL (Quick Flip Level):
This area marks a prior consolidation or sideways action that gets aggressively broken. In this chart, price dipped to a QFL zone then sharply reversed — suggesting a trap for early shorts and a liquidity grab before moving up. A classic “manipulation → accumulation → expansion” sequence.
🟦 Breaker Demand (BR Demand):
This is where previous resistance has flipped into new support. Breaker blocks are extremely important in identifying where institutions may re-enter positions. Price respected this area before continuing higher — confirming bullish control.
Price tapped into this BR demand, showed low-wick rejections, and moved strongly, signaling confidence from large orders.
📊 Volume Burst Zone (~147.2–147.7):
This zone has historically seen high volume and sudden price acceleration. Price is re-approaching it now. This is where a lot of pending orders and take-profits are likely clustered — expect strong reactions here.
📈 Current Price Action
Price is climbing along a clean bullish trendline, reinforcing current momentum.
Price has broken previous structure highs and is now making higher highs and higher lows — a textbook bullish trend.
Buyers are in control as long as the price continues to respect:
The bullish trendline
The BR demand zone (~145.5)
🔮 Projection & Potential Scenarios
🟢 Bullish Continuation Case:
If current momentum holds, the price is likely to push toward the Next Reversal Zone (148.500–149.000).
This zone aligns with multiple confluences:
Fibonacci extension targets
Previous high liquidity trap zone
Potential institutional profit-taking level
Expect this zone to cause a reversal or deep pullback.
🔴 Bearish Breakdown Case:
If price breaks below the BR Demand Zone and closes under the trendline, expect a drop back toward the Central Zone (~144.8–145.0), or even deeper into the Major Support Zone.
This would shift market structure back to neutral or bearish depending on volume and rejection patterns.
📌 Summary:
✅ Bias: Bullish
🎯 Short-Term Target: 147.5 (volume burst area)
🧱 Key Support: 145.50 (breaker demand)
❗ Trendline Break = Red Flag
🏁 Final Reversal Zone: 148.500–149.000
💬 Final Thoughts
This chart is a brilliant example of smart money accumulation and market engineering. USDJPY continues to respect well-defined zones, presenting high-probability opportunities for traders who understand structure and patience.
This setup is NOT about chasing price — it's about following the footprints of volume, breakout structure, and institutional intent. Stick to the plan and manage risk around key invalidation zones.