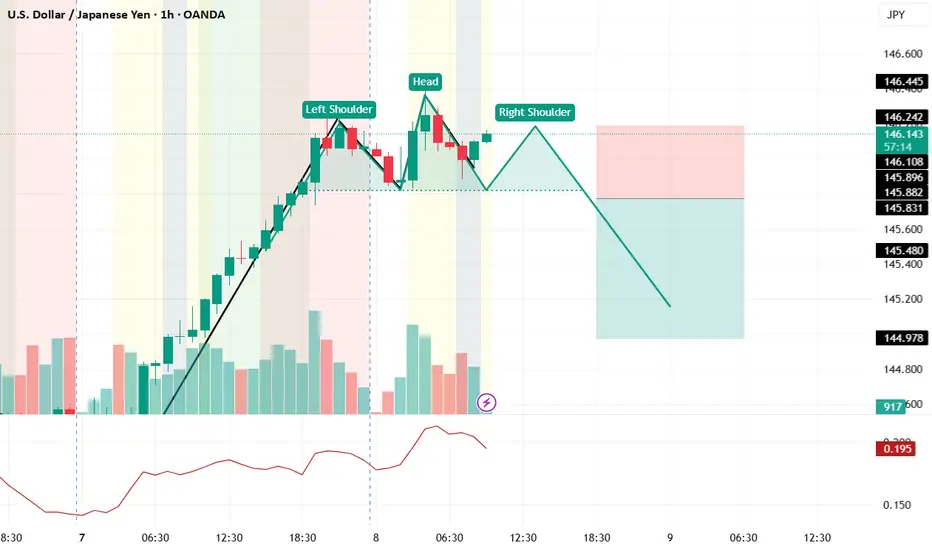
usdjpy head and shoulder emergingexperimental !!! it can be a possible scenario , pls feel free to coment and share your ideas with me hop you have green portfolio!!!
USDJPY trade ideas
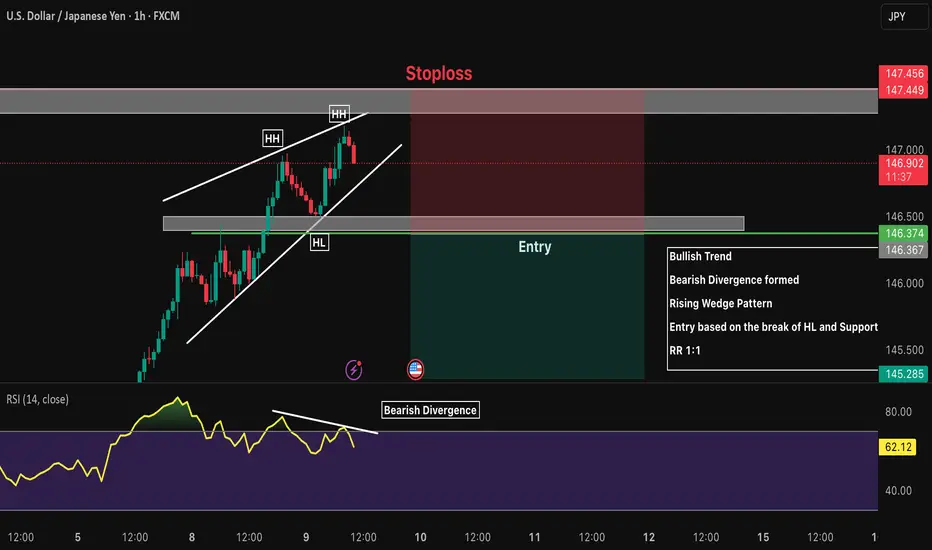
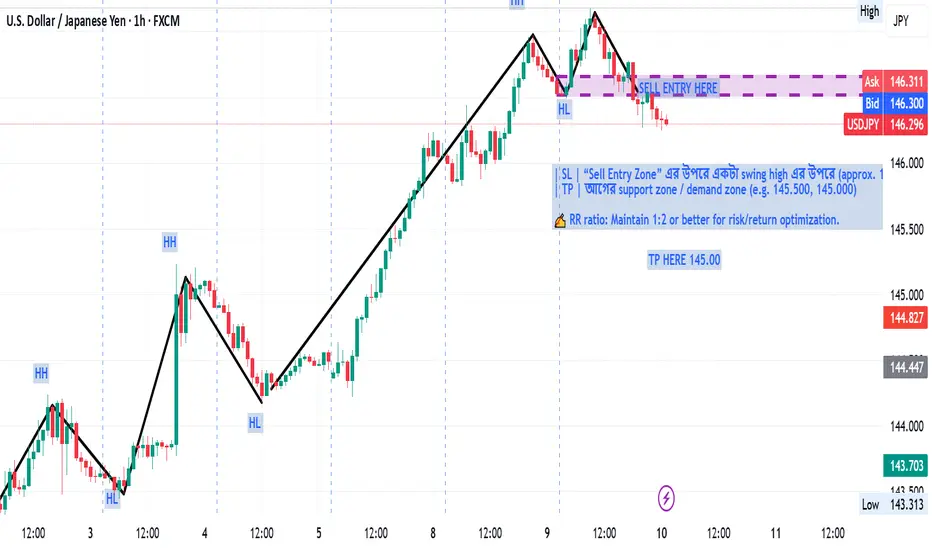
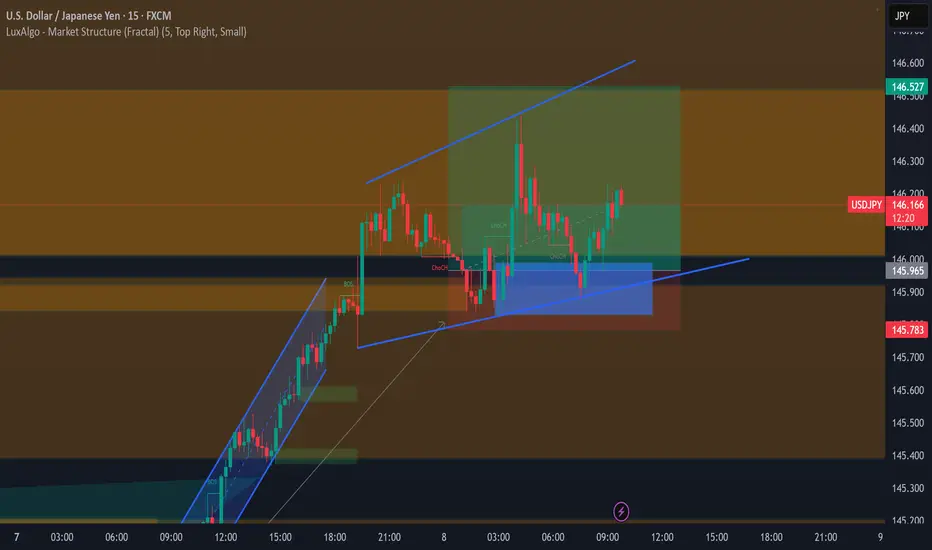
USDJPY 1H Short Bullish Trend
Bearish Divergence formed
Rising Wedge Pattern
Entry based on the break of HL and Support
RR 1:1
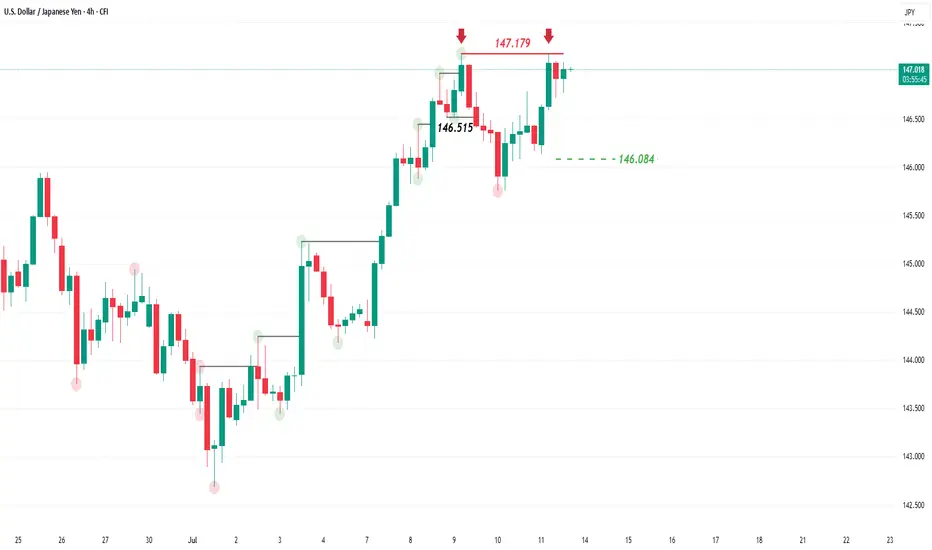
Is the US dollar taking a breather against the Japanese yen?After the recent rebound of the US dollar following two quarters of decline, the USD/JPY pair has been on an upward trajectory, forming a series of higher highs on both the 4-hour and daily charts.
However, the recent drop below the 146.515 level and the formation of a new low suggests a potential shift in trend on the 4-hour timeframe from bullish to bearish. This could signal a possible pullback in the short to medium term, with the first short-term target located at the 146.084 level.
The bearish scenario would be invalidated if the price rises above 147.179 and a 4-hour candle closes above that level.
USDJPY SELLGet real time data on the USD/JPY pair including the live rate, as well as our currency converter, analysis, news, historical data and more.
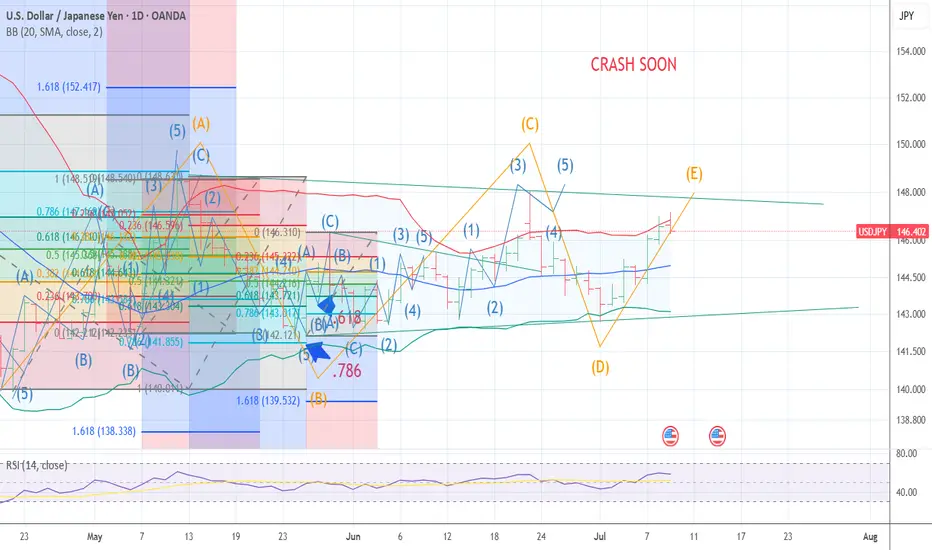
YEN CARRY TRADE TICK TICK BOOM WAVE E The chart posted is my work on the yen trade I have maintained the same labeling and as you can see What I think is rather near . I am major bearish the US stock market and I am starting to reposition for a MAJOR DOWN TURN into mid OCT the 10th best of trades WAVETIMER
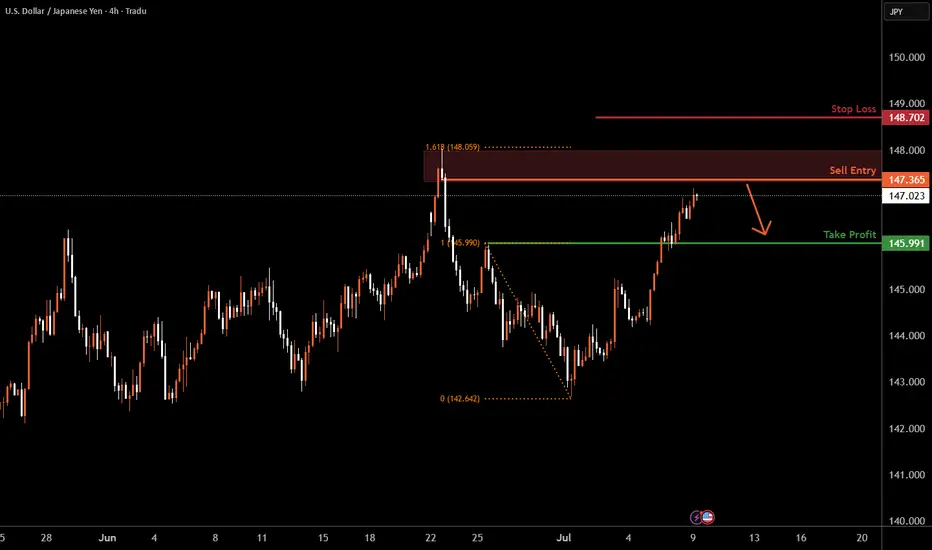
USDJPY H4 I Bearish Reversal Based on the H4 chart analysis, the price is approaching our buy entry level at 147.36, a pullback support that aligns closely with the 161.8% Fib retracement.
Our take profit is set at 145.99, a pullback support.
The stop loss is placed at 148.70, above the 161.8% Fib extension.
High Risk Investment Warning
Trading Forex/CFDs on margin carries a high level of risk and may not be suitable for all investors. Leverage can work against you.
Stratos Markets Limited (tradu.com ):
CFDs are complex instruments and come with a high risk of losing money rapidly due to leverage. 63% of retail investor accounts lose money when trading CFDs with this provider. You should consider whether you understand how CFDs work and whether you can afford to take the high risk of losing your money.
Stratos Europe Ltd (tradu.com ):
CFDs are complex instruments and come with a high risk of losing money rapidly due to leverage. 63% of retail investor accounts lose money when trading CFDs with this provider. You should consider whether you understand how CFDs work and whether you can afford to take the high risk of losing your money.
Stratos Global LLC (tradu.com ):
Losses can exceed deposits.
Please be advised that the information presented on TradingView is provided to Tradu (‘Company’, ‘we’) by a third-party provider (‘TFA Global Pte Ltd’). Please be reminded that you are solely responsible for the trading decisions on your account. There is a very high degree of risk involved in trading. Any information and/or content is intended entirely for research, educational and informational purposes only and does not constitute investment or consultation advice or investment strategy. The information is not tailored to the investment needs of any specific person and therefore does not involve a consideration of any of the investment objectives, financial situation or needs of any viewer that may receive it. Kindly also note that past performance is not a reliable indicator of future results. Actual results may differ materially from those anticipated in forward-looking or past performance statements. We assume no liability as to the accuracy or completeness of any of the information and/or content provided herein and the Company cannot be held responsible for any omission, mistake nor for any loss or damage including without limitation to any loss of profit which may arise from reliance on any information supplied by TFA Global Pte Ltd.
The speaker(s) is neither an employee, agent nor representative of Tradu and is therefore acting independently. The opinions given are their own, constitute general market commentary, and do not constitute the opinion or advice of Tradu or any form of personal or investment advice. Tradu neither endorses nor guarantees offerings of third-party speakers, nor is Tradu responsible for the content, veracity or opinions of third-party speakers, presenters or participants.
USDJPY Structural Analysis : Breakout Demand Play + Target🗺️ Market Structure & Key Technical Zones
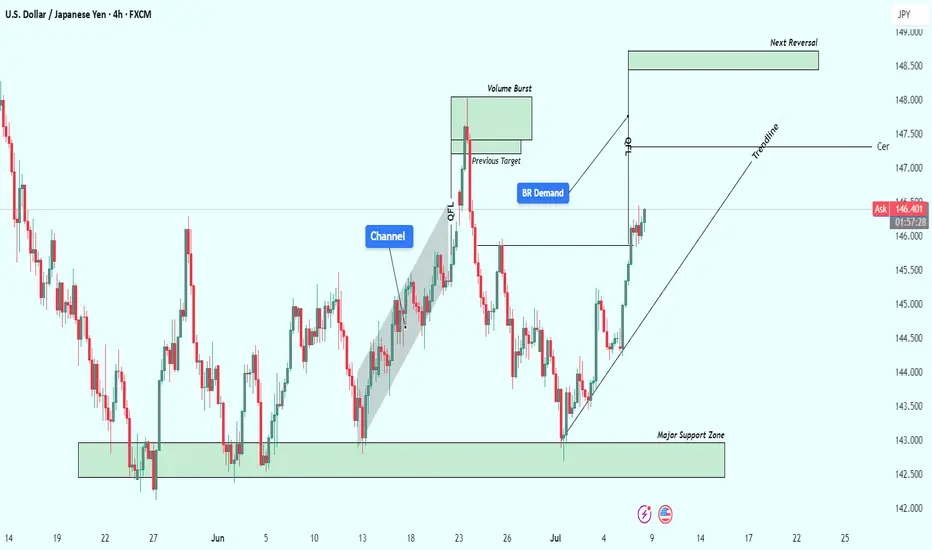
On the USDJPY 4-hour timeframe, the market is clearly respecting smart money levels and giving us an ideal case study of institutional demand, trend continuation, and liquidity engineering.
🔰 1. Major Support Zone (142.500 – 143.200):
This zone acted as a high-value area where price consolidated previously before rallying. It has been tested multiple times and each touch has led to a strong bullish reaction, indicating accumulation by large players.
Think of this zone as the market’s base camp — when price visits it, big money steps in to reload longs.
🔰 2. Channel Formation & Breakout:
A clean bullish channel formed mid-June, with price respecting both bounds while gradually climbing. Once the channel was broken with strong volume (noted by the breakout candle), it suggested a shift from controlled bullish flow to an impulsive move — a change in pace that often indicates smart money is active.
🧱 Institutional Concepts in Action
🔵 QFL (Quick Flip Level):
This area marks a prior consolidation or sideways action that gets aggressively broken. In this chart, price dipped to a QFL zone then sharply reversed — suggesting a trap for early shorts and a liquidity grab before moving up. A classic “manipulation → accumulation → expansion” sequence.
🟦 Breaker Demand (BR Demand):
This is where previous resistance has flipped into new support. Breaker blocks are extremely important in identifying where institutions may re-enter positions. Price respected this area before continuing higher — confirming bullish control.
Price tapped into this BR demand, showed low-wick rejections, and moved strongly, signaling confidence from large orders.
📊 Volume Burst Zone (~147.2–147.7):
This zone has historically seen high volume and sudden price acceleration. Price is re-approaching it now. This is where a lot of pending orders and take-profits are likely clustered — expect strong reactions here.
📈 Current Price Action
Price is climbing along a clean bullish trendline, reinforcing current momentum.
Price has broken previous structure highs and is now making higher highs and higher lows — a textbook bullish trend.
Buyers are in control as long as the price continues to respect:
The bullish trendline
The BR demand zone (~145.5)
🔮 Projection & Potential Scenarios
🟢 Bullish Continuation Case:
If current momentum holds, the price is likely to push toward the Next Reversal Zone (148.500–149.000).
This zone aligns with multiple confluences:
Fibonacci extension targets
Previous high liquidity trap zone
Potential institutional profit-taking level
Expect this zone to cause a reversal or deep pullback.
🔴 Bearish Breakdown Case:
If price breaks below the BR Demand Zone and closes under the trendline, expect a drop back toward the Central Zone (~144.8–145.0), or even deeper into the Major Support Zone.
This would shift market structure back to neutral or bearish depending on volume and rejection patterns.
📌 Summary:
✅ Bias: Bullish
🎯 Short-Term Target: 147.5 (volume burst area)
🧱 Key Support: 145.50 (breaker demand)
❗ Trendline Break = Red Flag
🏁 Final Reversal Zone: 148.500–149.000
💬 Final Thoughts
This chart is a brilliant example of smart money accumulation and market engineering. USDJPY continues to respect well-defined zones, presenting high-probability opportunities for traders who understand structure and patience.
This setup is NOT about chasing price — it's about following the footprints of volume, breakout structure, and institutional intent. Stick to the plan and manage risk around key invalidation zones.
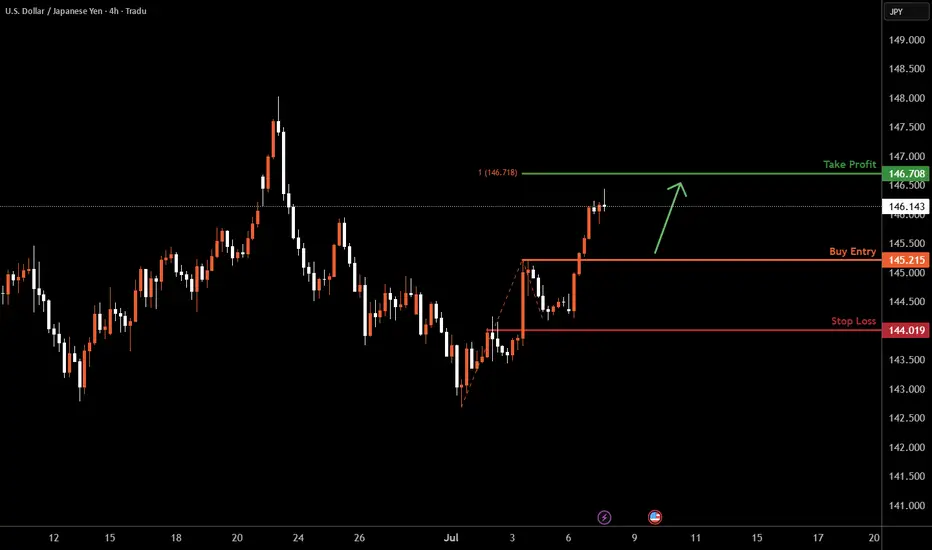
USDJPY H4 I Bullish Bounce Off Based on the H4 chart analysis, the price is falling toward our buy entry level at 145.21, a pullback support.
Our take profit is set at 146.70, aligning with the 100% Fibo projection.
The stop loss is placed at 144.01, a pullback support.
High Risk Investment Warning
Trading Forex/CFDs on margin carries a high level of risk and may not be suitable for all investors. Leverage can work against you.
Stratos Markets Limited (tradu.com ):
CFDs are complex instruments and come with a high risk of losing money rapidly due to leverage. 63% of retail investor accounts lose money when trading CFDs with this provider. You should consider whether you understand how CFDs work and whether you can afford to take the high risk of losing your money.
Stratos Europe Ltd (tradu.com ):
CFDs are complex instruments and come with a high risk of losing money rapidly due to leverage. 63% of retail investor accounts lose money when trading CFDs with this provider. You should consider whether you understand how CFDs work and whether you can afford to take the high risk of losing your money.
Stratos Global LLC (tradu.com ):
Losses can exceed deposits.
Please be advised that the information presented on TradingView is provided to Tradu (‘Company’, ‘we’) by a third-party provider (‘TFA Global Pte Ltd’). Please be reminded that you are solely responsible for the trading decisions on your account. There is a very high degree of risk involved in trading. Any information and/or content is intended entirely for research, educational and informational purposes only and does not constitute investment or consultation advice or investment strategy. The information is not tailored to the investment needs of any specific person and therefore does not involve a consideration of any of the investment objectives, financial situation or needs of any viewer that may receive it. Kindly also note that past performance is not a reliable indicator of future results. Actual results may differ materially from those anticipated in forward-looking or past performance statements. We assume no liability as to the accuracy or completeness of any of the information and/or content provided herein and the Company cannot be held responsible for any omission, mistake nor for any loss or damage including without limitation to any loss of profit which may arise from reliance on any information supplied by TFA Global Pte Ltd.
The speaker(s) is neither an employee, agent nor representative of Tradu and is therefore acting independently. The opinions given are their own, constitute general market commentary, and do not constitute the opinion or advice of Tradu or any form of personal or investment advice. Tradu neither endorses nor guarantees offerings of third-party speakers, nor is Tradu responsible for the content, veracity or opinions of third-party speakers, presenters or participants.
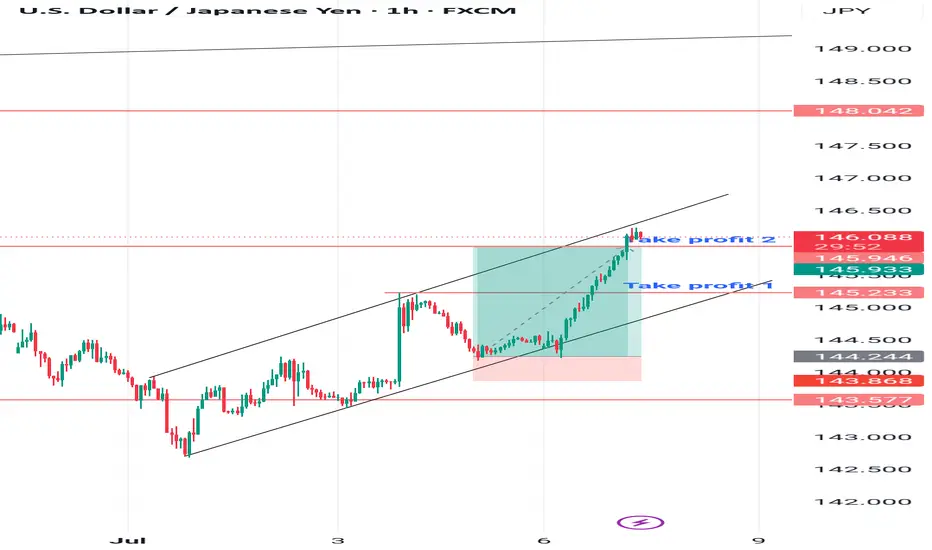
Usdjpy Long updateTarget reached for my previous UJ bulls, lets see how the chart behaves... pullback until 145.24(take profit 1) or continuation?
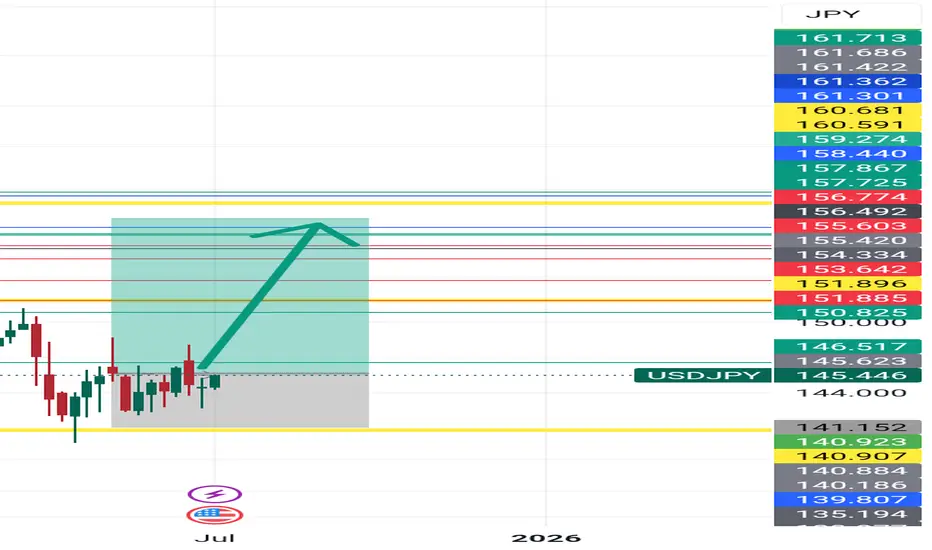
BUY usdjpy
The JPY sector is going to be the most promising sector, for the next half of the year, low risk, huge margin of safety, economic indicators are supportive of the pairs intrinsic value .
It's advisable to place huge amount of your portfolio into this sector
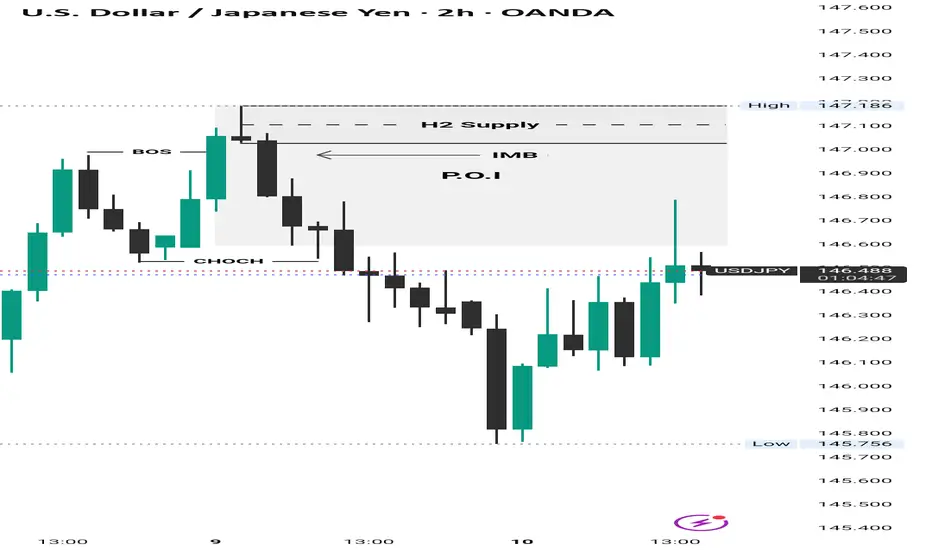
USDJPY IDEA Sell plan for this week or the upcoming week
All eyes on the supply above
Idea: A weak Dollar is possible, a strong JPY (yen 💹)
Proper risk management is advised.
Prop Firm Funnded Account UpdateHello Traders! Was able to get to the first payout last week, and got it processed today.

Expanding Triangle (Megaphone)Expanding Triangle (Megaphone) Expanding Triangle (Megaphone) to my trade stratey i use commander
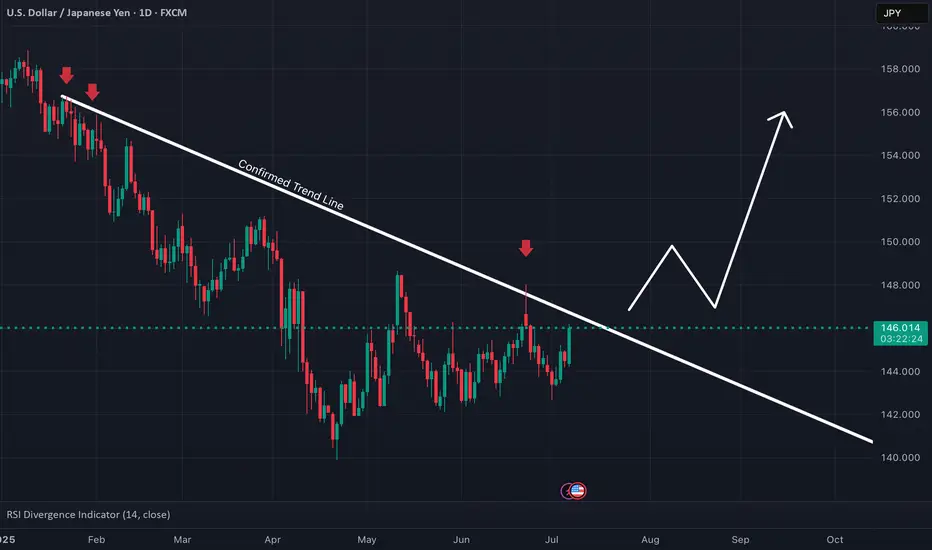
Potential Long position on USDJPYReasons I think this pair will rise:
- Confirmed trend line meaning harder breakout
- Price printed higher low after bouncing off trend line signaling momentum loss
- RSI oversold on Daily chart
What do you think?
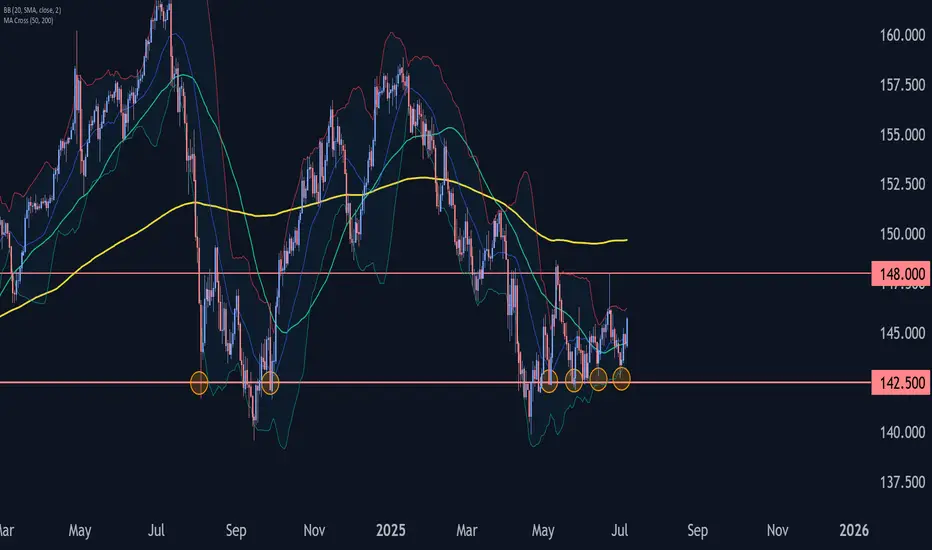
USDJPY Wave Analysis – 7 July 2025
- USDJPY reversed from long-term support level 142.50
- Likely to rise to resistance level 148.00
USDJPY currency pair recently reversed up from the support zone located between the long-term support level 142.50 (which has been steadily reversing the price from August of 2024, as can be seen from the daily USDJPY chart below) and the lower daily Bollinger Band.
The upward reversal from this support zone stopped the previous short-term ABC correction 2 from the end of June.
Given the strength of the support level 142.50 and the strongly bearish yen sentiment seen today, USDJPY currency pair can be expected to rise to the next resistance level 148.00 (top of the previous waves 4, (1) and 1).
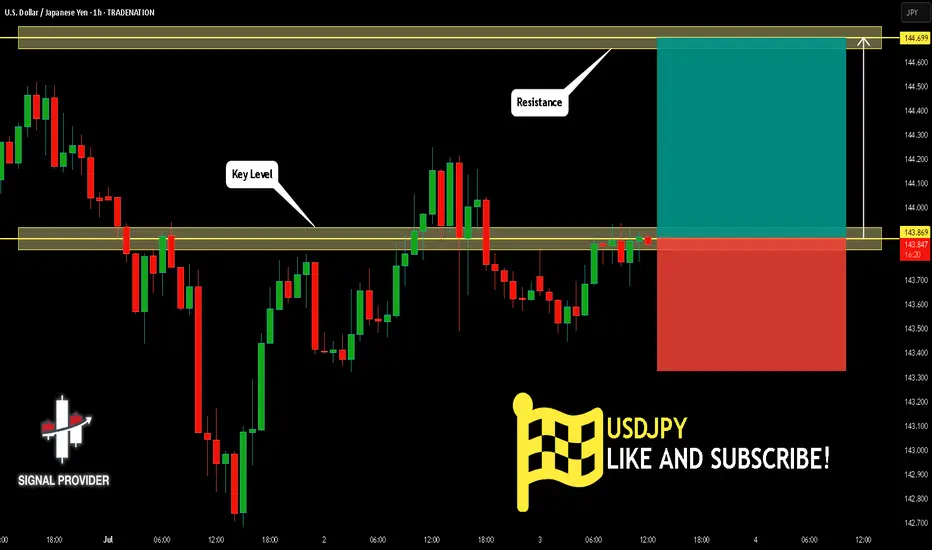
USDJPY Is Bullish! Buy!
Take a look at our analysis for USDJPY.
Time Frame: 1h
Current Trend: Bullish
Sentiment: Oversold (based on 7-period RSI)
Forecast: Bullish
The market is on a crucial zone of demand 143.869.
The oversold market condition in a combination with key structure gives us a relatively strong bullish signal with goal 144.699 level.
P.S
We determine oversold/overbought condition with RSI indicator.
When it drops below 30 - the market is considered to be oversold.
When it bounces above 70 - the market is considered to be overbought.
Disclosure: I am part of Trade Nation's Influencer program and receive a monthly fee for using their TradingView charts in my analysis.
Like and subscribe and comment my ideas if you enjoy them!
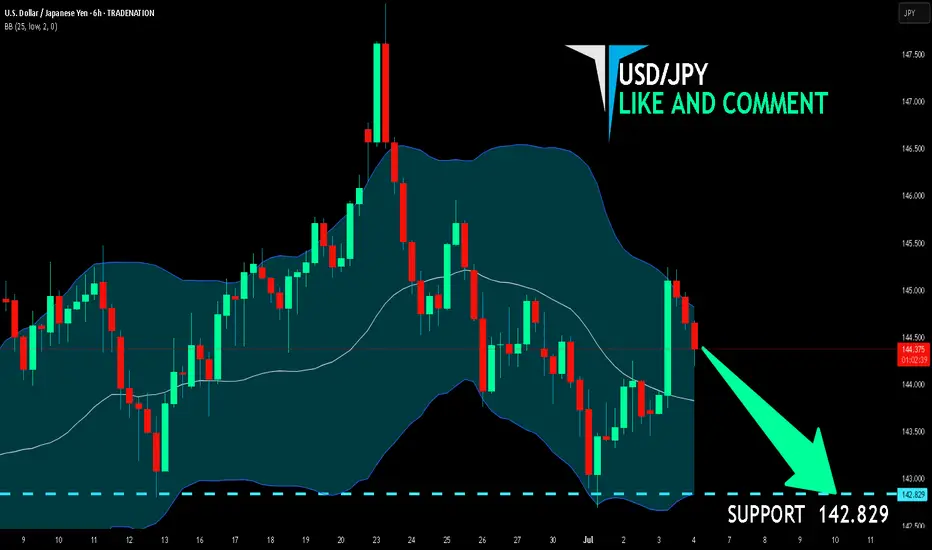
USD/JPY SENDS CLEAR BEARISH SIGNALS|SHORT
Hello, Friends!
USD-JPY uptrend evident from the last 1W green candle makes short trades more risky, but the current set-up targeting 142.829 area still presents a good opportunity for us to sell the pair because the resistance line is nearby and the BB upper band is close which indicates the overbought state of the USD/JPY pair.
Disclosure: I am part of Trade Nation's Influencer program and receive a monthly fee for using their TradingView charts in my analysis.
✅LIKE AND COMMENT MY IDEAS✅
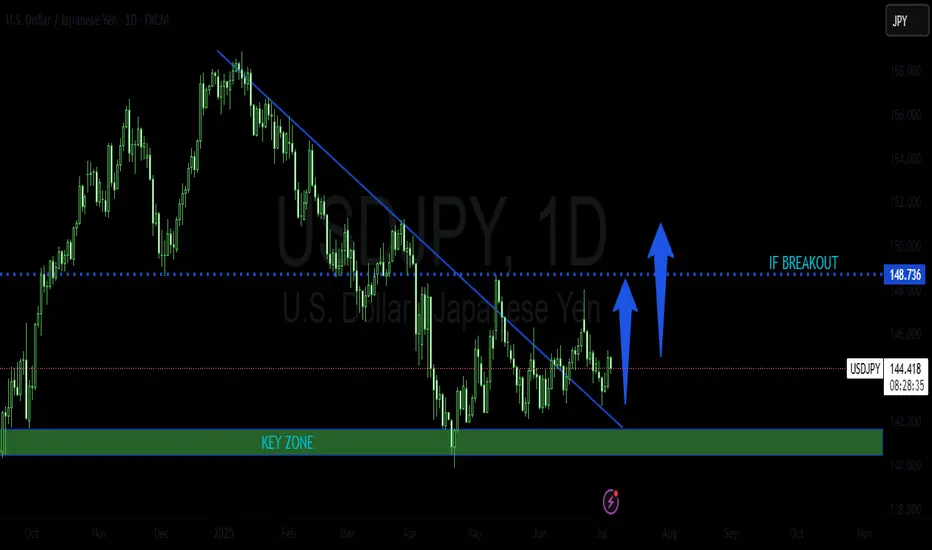
USDJPY POSSIBLE LONG TRADE PLANThe pair has been trading in a bearish trend for sometime now. It has recently rejected near a key zone and broke out a falling trend line. It looks like it is now retesting this zone before initiating a bull movement.
Please do your own analysis before placing any trades.
Cheers and happy trading !!!
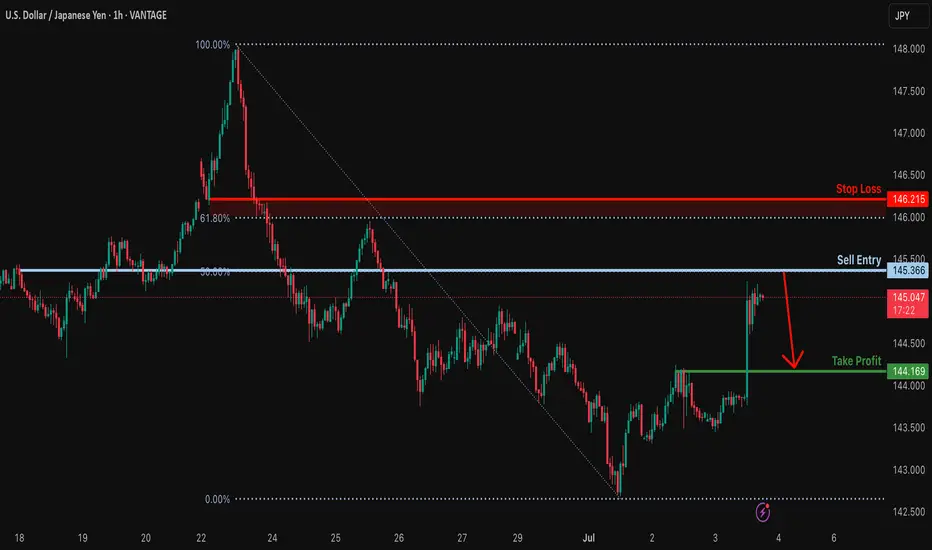
Could the price drop from here?USD/JPY is rising towards the resistance level which is a pullback resistance that aligns with the 50% Fibonacci retracement and could drop from this level to our take profit.
Entry: 145.36
Why we like it:
There is a pullback resistance that lines up with the 50% Fibonacci retracement.
Stop loss: 146.21
Why we like it:
There is a pullback resistance level that is slight above the 61.8% Fibonacci retracement.
Take profit: 144.16
Why we like it:
There is a pullback support level.
Enjoying your TradingView experience? Review us!
Please be advised that the information presented on TradingView is provided to Vantage (‘Vantage Global Limited’, ‘we’) by a third-party provider (‘Everest Fortune Group’). Please be reminded that you are solely responsible for the trading decisions on your account. There is a very high degree of risk involved in trading. Any information and/or content is intended entirely for research, educational and informational purposes only and does not constitute investment or consultation advice or investment strategy. The information is not tailored to the investment needs of any specific person and therefore does not involve a consideration of any of the investment objectives, financial situation or needs of any viewer that may receive it. Kindly also note that past performance is not a reliable indicator of future results. Actual results may differ materially from those anticipated in forward-looking or past performance statements. We assume no liability as to the accuracy or completeness of any of the information and/or content provided herein and the Company cannot be held responsible for any omission, mistake nor for any loss or damage including without limitation to any loss of profit which may arise from reliance on any information supplied by Everest Fortune Group.
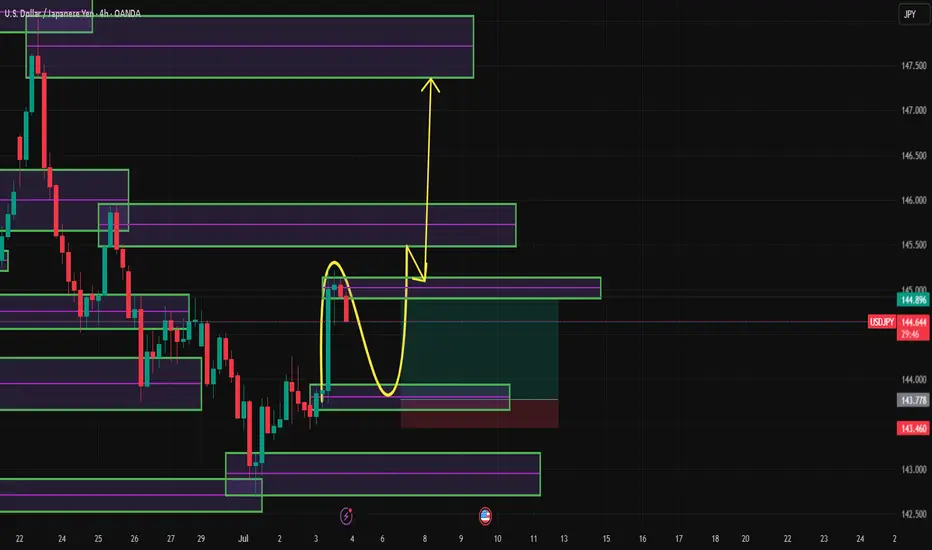
USDJPY Forecast – Bullish Roadmap with Key Retracement LevelsUSDJPY is currently sitting around 144.658. From this level, I’m anticipating a short-term retracement down toward the 143.800 zone, which may act as a demand area or liquidity grab before a bounce.
From 143.800, price is expected to climb back to 144.646, potentially breaking slightly above into 144.652, where intraday liquidity or stop hunts might occur. If bullish momentum remains strong, a slight retracement into the 145.132 region could follow — possibly retesting a breakout zone or OB — before a final bullish continuation*targeting 147.353.
> 🔽 Short-term pullback zone: 143.800
> 🔼 Initial bullish target: 144.646 – 144.652
> 🔁 Expected mid-level retracement: 145.132
> 🎯 Final bullish target: 147.353
> 📍 Current price: 144.658
I’ll be monitoring each key level closely for reactions such as W formations, bullish engulfing candles, or break of internal structure to confirm momentum shifts.
📌 Risk Management Note:
This is not financial advice. Always use strict risk management:
✔️ Risk no more than 1–2% per trade
✔️ Use proper **risk-to-reward setups (min 1:2 RR)
✔️ Wait for **clear confirmations before entering
✔️ Protect capital — consistency beats intensity
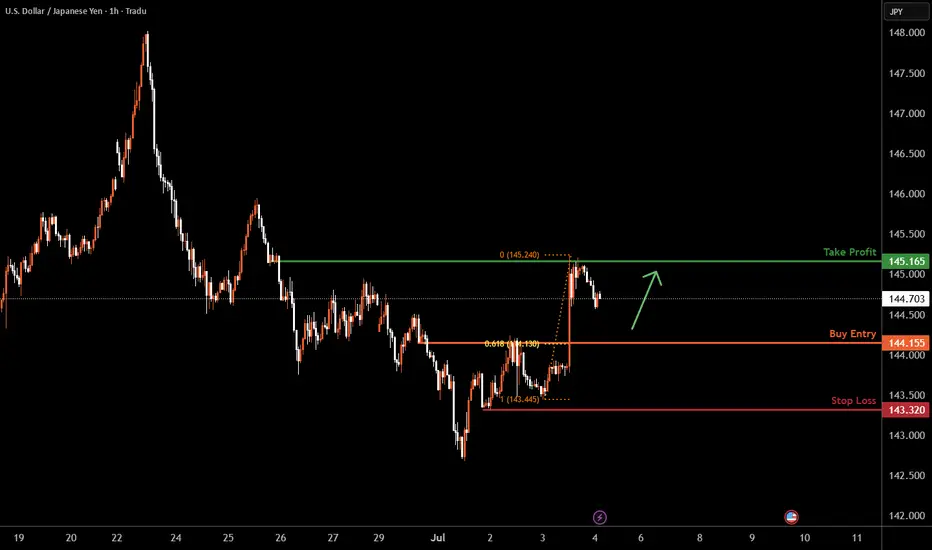
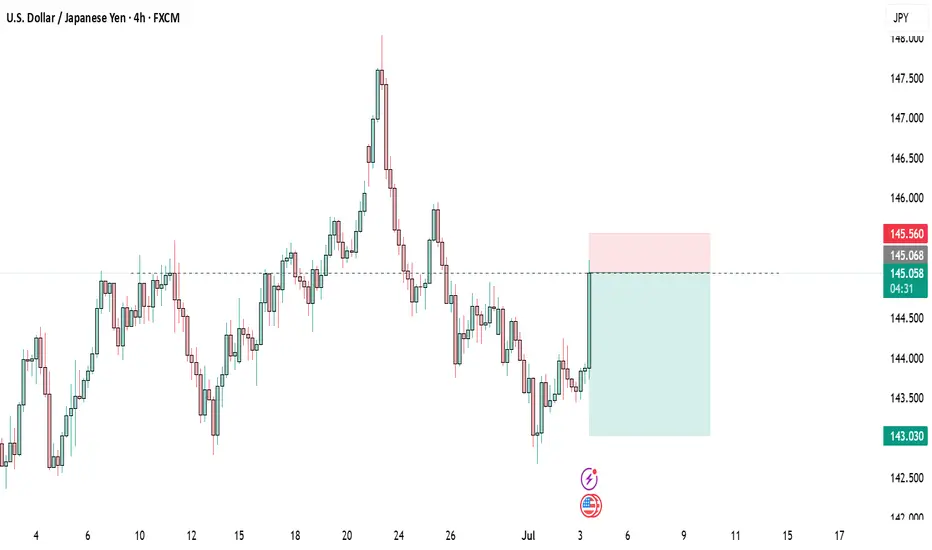
USDJPY H1 I Bullish Bounce off the 61.8% FibBased on the H1 chart analysis, the price is falling our buy entry level at 144.15, a pullback support that aligns with the 61.8% Fib retracement.
Our take profit is set at 145.16, an overlap resistance.
The stop loss is placed at 143.32, a swing low support.
High Risk Investment Warning
Trading Forex/CFDs on margin carries a high level of risk and may not be suitable for all investors. Leverage can work against you.
Stratos Markets Limited (tradu.com ):
CFDs are complex instruments and come with a high risk of losing money rapidly due to leverage. 63% of retail investor accounts lose money when trading CFDs with this provider. You should consider whether you understand how CFDs work and whether you can afford to take the high risk of losing your money.
Stratos Europe Ltd (tradu.com ):
CFDs are complex instruments and come with a high risk of losing money rapidly due to leverage. 63% of retail investor accounts lose money when trading CFDs with this provider. You should consider whether you understand how CFDs work and whether you can afford to take the high risk of losing your money.
Stratos Global LLC (tradu.com ):
Losses can exceed deposits.
Please be advised that the information presented on TradingView is provided to Tradu (‘Company’, ‘we’) by a third-party provider (‘TFA Global Pte Ltd’). Please be reminded that you are solely responsible for the trading decisions on your account. There is a very high degree of risk involved in trading. Any information and/or content is intended entirely for research, educational and informational purposes only and does not constitute investment or consultation advice or investment strategy. The information is not tailored to the investment needs of any specific person and therefore does not involve a consideration of any of the investment objectives, financial situation or needs of any viewer that may receive it. Kindly also note that past performance is not a reliable indicator of future results. Actual results may differ materially from those anticipated in forward-looking or past performance statements. We assume no liability as to the accuracy or completeness of any of the information and/or content provided herein and the Company cannot be held responsible for any omission, mistake nor for any loss or damage including without limitation to any loss of profit which may arise from reliance on any information supplied by TFA Global Pte Ltd.
The speaker(s) is neither an employee, agent nor representative of Tradu and is therefore acting independently. The opinions given are their own, constitute general market commentary, and do not constitute the opinion or advice of Tradu or any form of personal or investment advice. Tradu neither endorses nor guarantees offerings of third-party speakers, nor is Tradu responsible for the content, veracity or opinions of third-party speakers, presenters or participants.
Sell USDJPYFor the first time, I have done some fundamental analysis. Last time NFP release was on a Thursday due to Bank Holiday was July 2020 where the USD gained on the news release but later gave up the gains. I am expecting a pullback
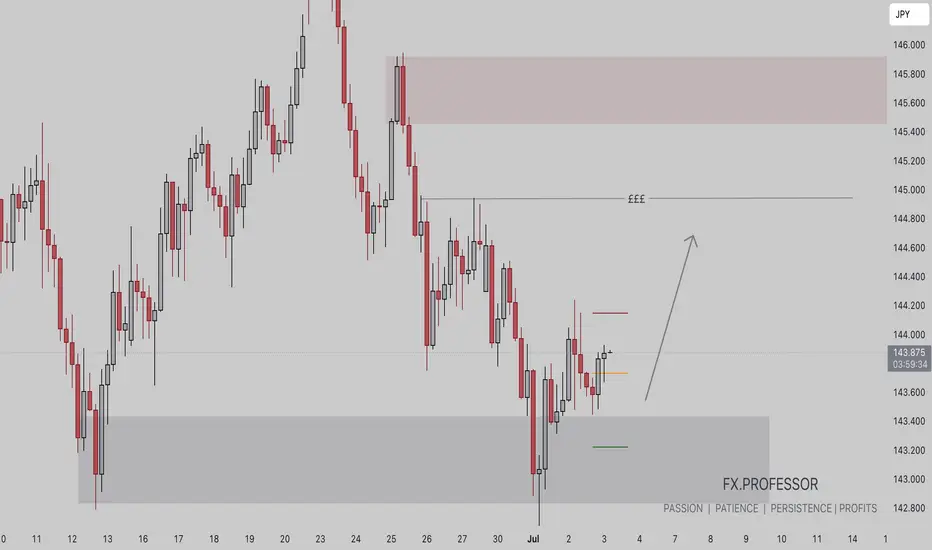
USDJPY BUY BIASWe are looking for buy continuation on this pair. Price rejected our demand level and since the we have seen a push to the upside.
We are looking to target 145.800 level as out TP.
This is a classic liquidity + demand zone + structure shift strategy suggesting:
• Potential long setup from current levels.
• Targeting liquidity above.
• Risk managed below demand zone.
• Bullish Bias
More insight
• A bullish continuation,
• Possibly a breakout above local resistance (marked by a thin red line),
• Then a push toward the next key level.
• Entry & Stop Zones:
• Entry trigger (Orange line) just above a short-term resistance.
• Stop-loss (Green line) placed under recent lows.
• Take-profit zone: near 144.900 or the upper supply zone (145.600+).