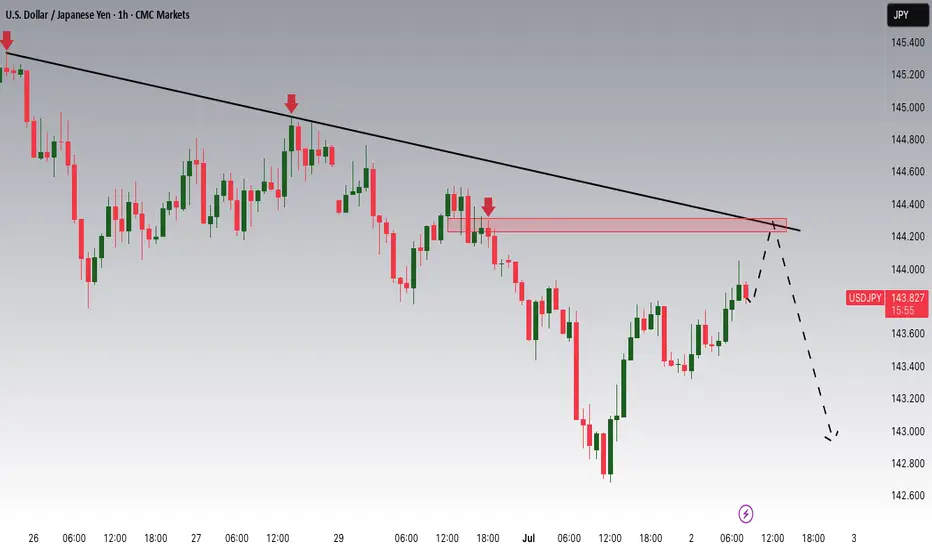
USDJPY Potential DownsidesHey Traders, in today's trading session we are monitoring USDJPY for a selling opportunity around 144.200 zone, USDJPY is trading in a downtrend and currently is in a correction phase in which it is approaching the trend at 144.200 support and resistance area.
Trade safe, Joe.
USDJPY trade ideas
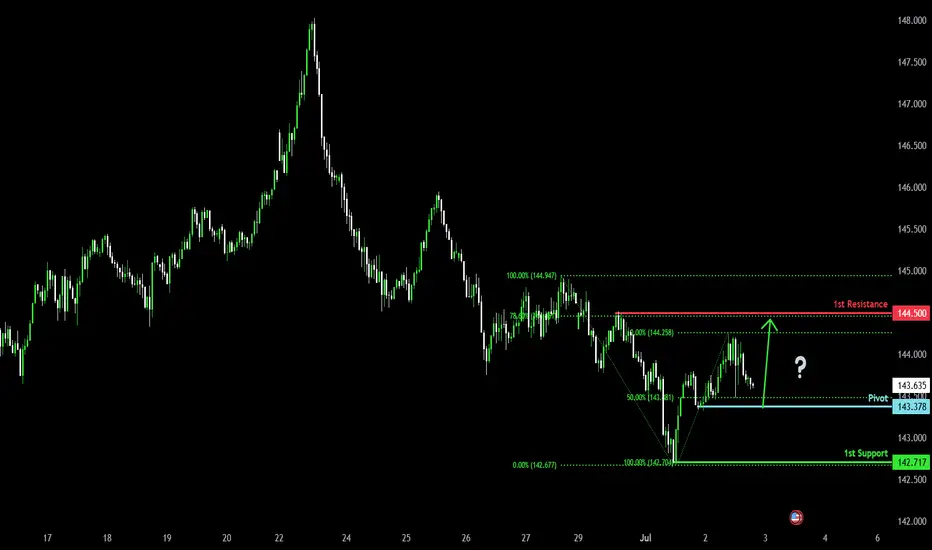
Bullish bouncer off pullback support?USD/JPY is falling towards the pivot and could bounce to the 1st resistance which acts as a pullback resistance.
Pivot: 143.37
1st Support: 142.71
1st Resistance: 144.50
Risk Warning:
Trading Forex and CFDs carries a high level of risk to your capital and you should only trade with money you can afford to lose. Trading Forex and CFDs may not be suitable for all investors, so please ensure that you fully understand the risks involved and seek independent advice if necessary.
Disclaimer:
The above opinions given constitute general market commentary, and do not constitute the opinion or advice of IC Markets or any form of personal or investment advice.
Any opinions, news, research, analyses, prices, other information, or links to third-party sites contained on this website are provided on an "as-is" basis, are intended only to be informative, is not an advice nor a recommendation, nor research, or a record of our trading prices, or an offer of, or solicitation for a transaction in any financial instrument and thus should not be treated as such. The information provided does not involve any specific investment objectives, financial situation and needs of any specific person who may receive it. Please be aware, that past performance is not a reliable indicator of future performance and/or results. Past Performance or Forward-looking scenarios based upon the reasonable beliefs of the third-party provider are not a guarantee of future performance. Actual results may differ materially from those anticipated in forward-looking or past performance statements. IC Markets makes no representation or warranty and assumes no liability as to the accuracy or completeness of the information provided, nor any loss arising from any investment based on a recommendation, forecast or any information supplied by any third-party.
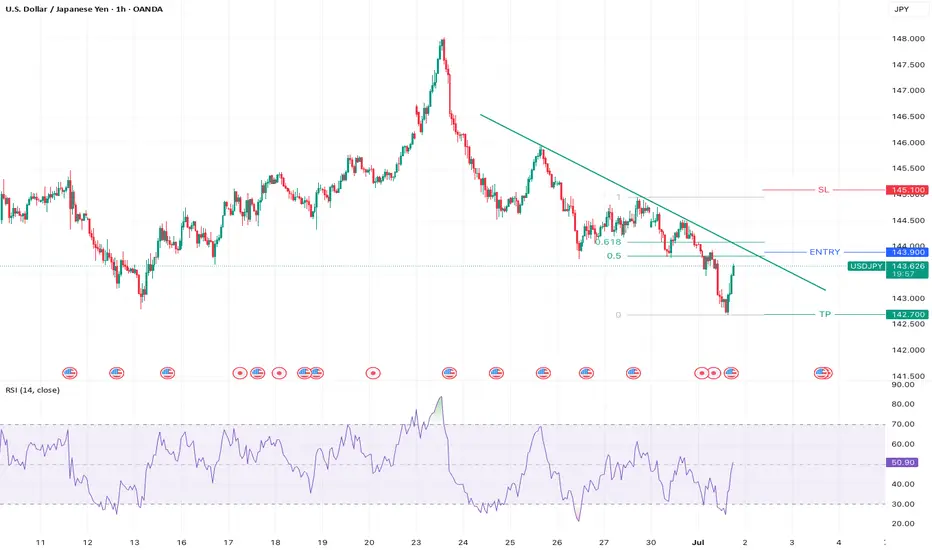
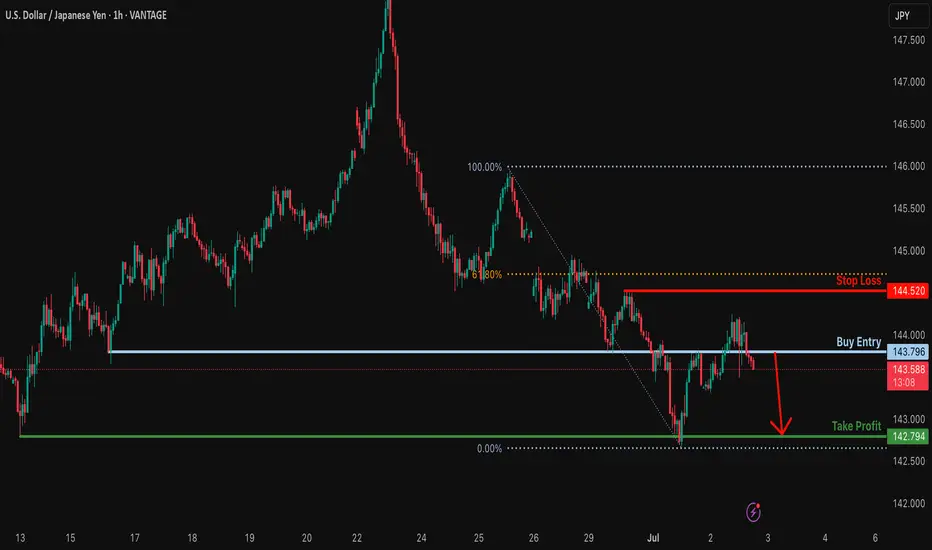
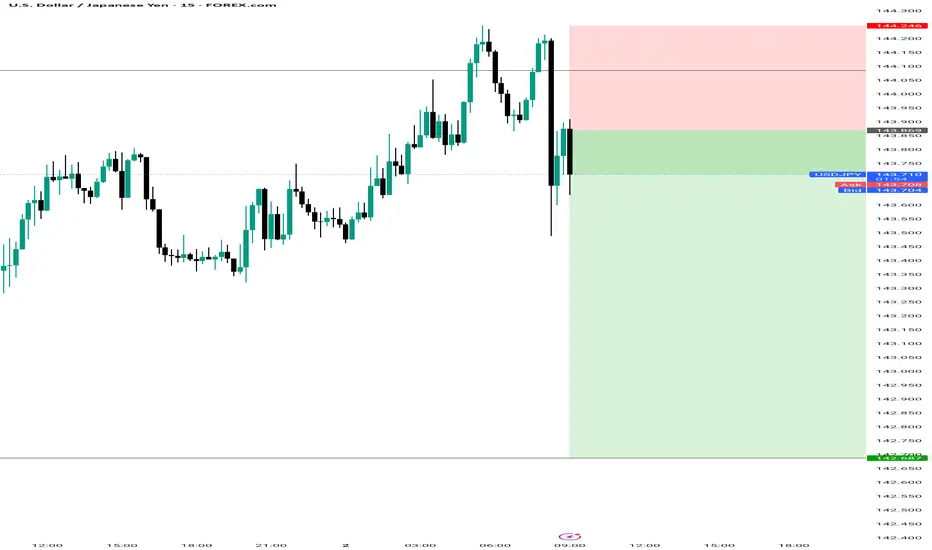
Potential bearish drop?USD/JPY is reacting off the resistance level which is an overlap resistance and could drop from this level too ur take profit.
Entry: 143.79
Why we like it:
There is a pullback resistance level.
Stop loss: 144.52
Why we like it:
There is a pullback resistance that is slightly below the 61.8% Fibonacci retracement.
Take profit: 142.79
Why we like it:
There is a pullback support level.
Enjoying your TradingView experience? Review us!
Please be advised that the information presented on TradingView is provided to Vantage (‘Vantage Global Limited’, ‘we’) by a third-party provider (‘Everest Fortune Group’). Please be reminded that you are solely responsible for the trading decisions on your account. There is a very high degree of risk involved in trading. Any information and/or content is intended entirely for research, educational and informational purposes only and does not constitute investment or consultation advice or investment strategy. The information is not tailored to the investment needs of any specific person and therefore does not involve a consideration of any of the investment objectives, financial situation or needs of any viewer that may receive it. Kindly also note that past performance is not a reliable indicator of future results. Actual results may differ materially from those anticipated in forward-looking or past performance statements. We assume no liability as to the accuracy or completeness of any of the information and/or content provided herein and the Company cannot be held responsible for any omission, mistake nor for any loss or damage including without limitation to any loss of profit which may arise from reliance on any information supplied by Everest Fortune Group.
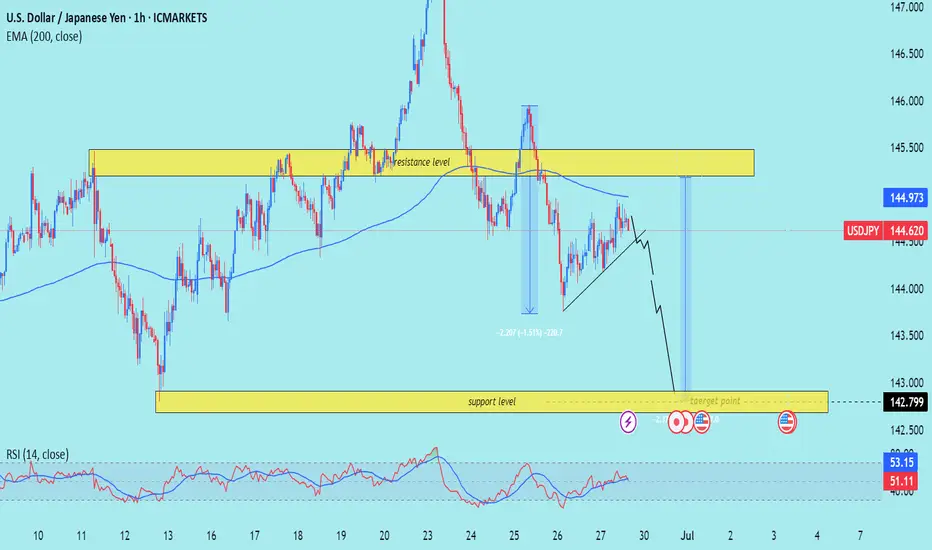
USD/JPY) bearish Trand analysis Read The captionSMC trading point update
Technical analysis of USD/JPY (U.S. Dollar vs Japanese Yen) on the 1-hour timeframe. Here's a clear breakdown of the idea presented:
---
Overview of the Setup
Current Price: 144.620
EMA 200 (Blue Line): 144.973 – price is trading below the EMA, indicating bearish momentum.
Resistance Zone: Around 145.000 – 145.500
Support/Target Zone: Around 142.799
RSI Indicator: ~51.11 – neutral zone (not overbought or oversold)
---
Interpretation of Chart Structure
1. Resistance Level:
Price tested the resistance zone and sharply rejected it.
This zone has held multiple times historically, making it strong.
2. EMA 200 as Resistance:
Price rejected just under the EMA, further confirming downside pressure.
3. Bearish Flag / Rising Wedge Breakdown:
There is a visible bearish continuation pattern (likely a rising wedge or bear flag).
Price is projected to break down from this pattern, continuing the downtrend.
4. Measured Move Projection:
Previous drop of ~230 pips (-1.5%) is mirrored for the next expected move.
The same size move projects the price to reach the target zone around 142.799.
5. Support/Target Zone:
Marked as the final take-profit zone.
Corresponds with historical demand and likely buyer interest.
---
Trade Idea Summary
Bias: Bearish
Entry Idea: After breakdown confirmation below wedge structure or rejection from resistance zone.
Target: 142.799
Stop-Loss Consideration: Above the resistance zone (~145.500) or just above the recent swing high.
Confirmation: Breakdown of rising wedge + below EMA + repeated resistance rejections.
Mr SMC Trading point
---
Key Considerations
Upcoming News Events (Three Icons):
These symbols signal potential USD or JPY volatility, so watch out for data releases that could disrupt the pattern.
RSI Neutral:
RSI is not yet oversold, allowing room for more downside before hitting exhaustion levels.
False Breakouts Possible:
Price may fake a break upward before continuing lower – wait for strong candle confirmation if entering a trade.
plesse support boost 🚀 this analysis)
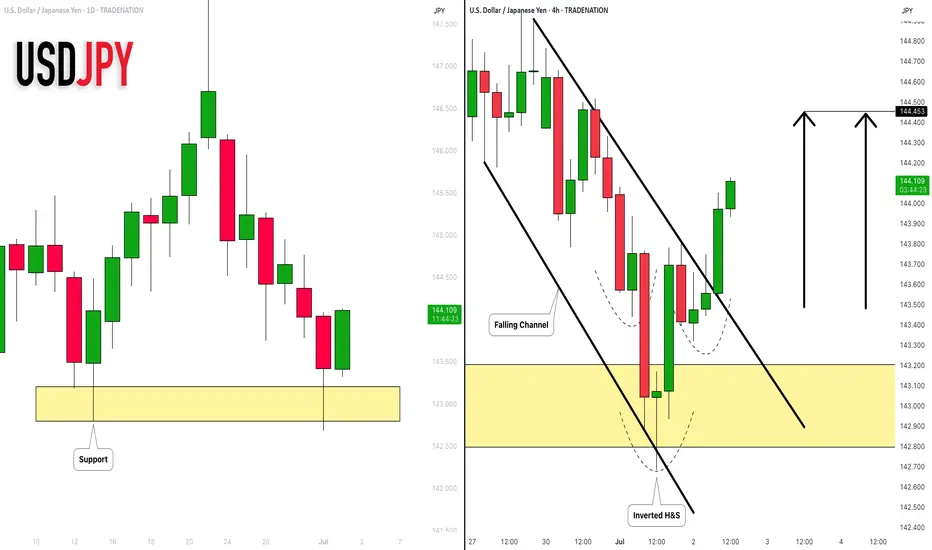
USDJPY: Strong Bullish Price Action 🇺🇸🇯🇵
I see 2 strong bullish confirmation on USDJPY after a test of a key daily
support cluster.
The price violated a trend line of a falling channel and a neckline of
an inverted head & shoulders pattern with one single strong bullish candle.
The pair may rise more and reach 144.45 level soon.
❤️Please, support my work with like, thank you!❤️
I am part of Trade Nation's Influencer program and receive a monthly fee for using their TradingView charts in my analysis.
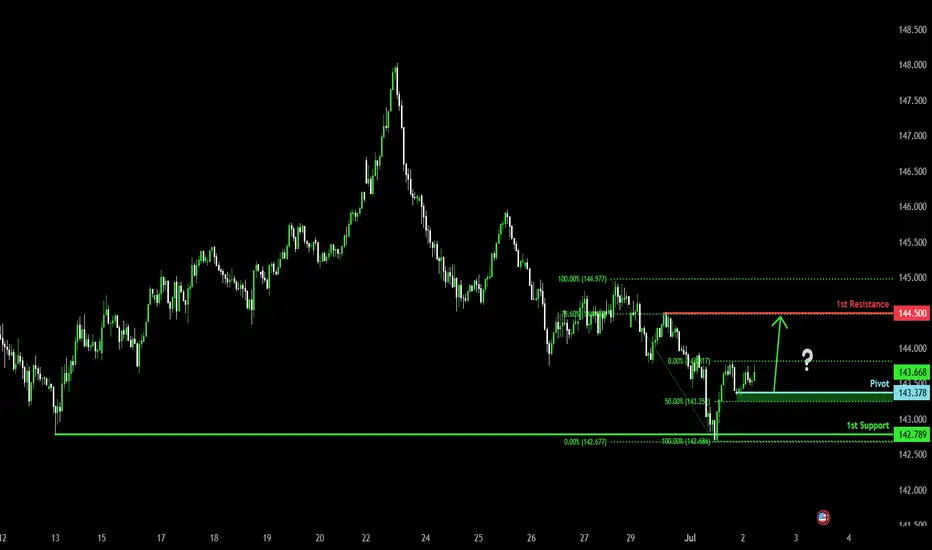
Potential bullish continuation?USD/JPY has bounced off the pivot and could rise to the 1st resistance, which aligns with the 78.6% Fibonacci retracement.
Pivot: 143.37
1st Support: 142.78
1st Resistance: 144.50
Risk Warning:
Trading Forex and CFDs carries a high level of risk to your capital and you should only trade with money you can afford to lose. Trading Forex and CFDs may not be suitable for all investors, so please ensure that you fully understand the risks involved and seek independent advice if necessary.
Disclaimer:
The above opinions given constitute general market commentary, and do not constitute the opinion or advice of IC Markets or any form of personal or investment advice.
Any opinions, news, research, analyses, prices, other information, or links to third-party sites contained on this website are provided on an "as-is" basis, are intended only to be informative, is not an advice nor a recommendation, nor research, or a record of our trading prices, or an offer of, or solicitation for a transaction in any financial instrument and thus should not be treated as such. The information provided does not involve any specific investment objectives, financial situation and needs of any specific person who may receive it. Please be aware, that past performance is not a reliable indicator of future performance and/or results. Past Performance or Forward-looking scenarios based upon the reasonable beliefs of the third-party provider are not a guarantee of future performance. Actual results may differ materially from those anticipated in forward-looking or past performance statements. IC Markets makes no representation or warranty and assumes no liability as to the accuracy or completeness of the information provided, nor any loss arising from any investment based on a recommendation, forecast or any information supplied by any third-party.
USDJPY TRADE SETUPWait for break of structure and retest the entry level then take a trade for Sell otherwise skip this setup
USDJPY SHORT Market structure bearish on HTFs 3
Entry at Daily AOi
Weekly Rejection at AOi
Daily Rejection at AOi
Daily EMA retest
Previous Structure point Daily
Around Psychological Level 145.000
H4 EMA retest
H4 Candlestick rejection
H4 Head and Shoulder Pattern, Retest of the neckline
Levels 3.56
Entry 95%
DUE TO H4 I WILL BE GOING 1/2 A % RISK TO SEE IF MY EDGE WILL WORK
REMEMBER : Trading is a Game Of Probability
: Manage Your Risk
: Be Patient
: Every Moment Is Unique
: Rinse, Wash, Repeat!
: Christ is King.
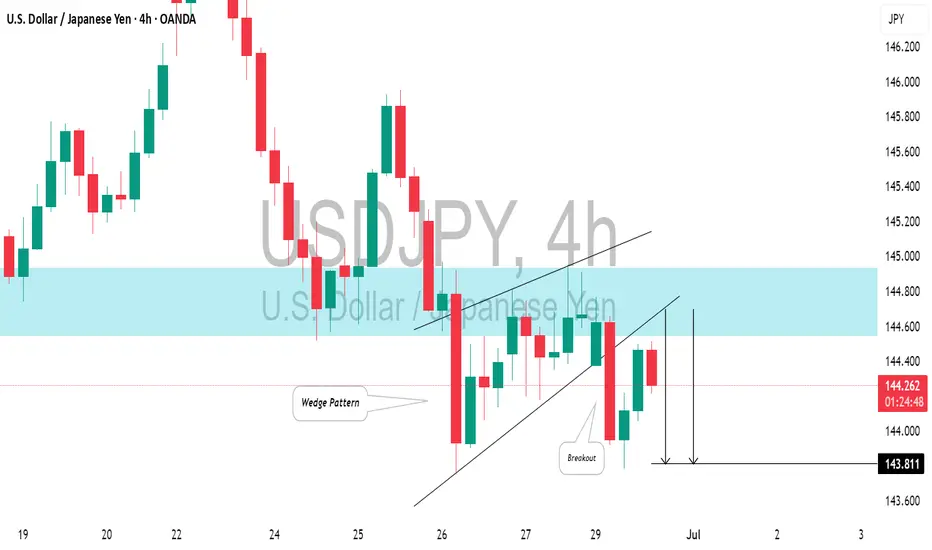
USDJPY: Intraday Bearish ConfirmationLast week, I shared an update on a confirmed structure breakout for 📉USDJPY on a 4-hour chart.
On retesting the broken structure, the price showed a strong bearish signal.
I observed a rising wedge pattern with a broken support line
This breakout suggests a high likelihood that the price will decline to the 143.81 / 143.31 levels.
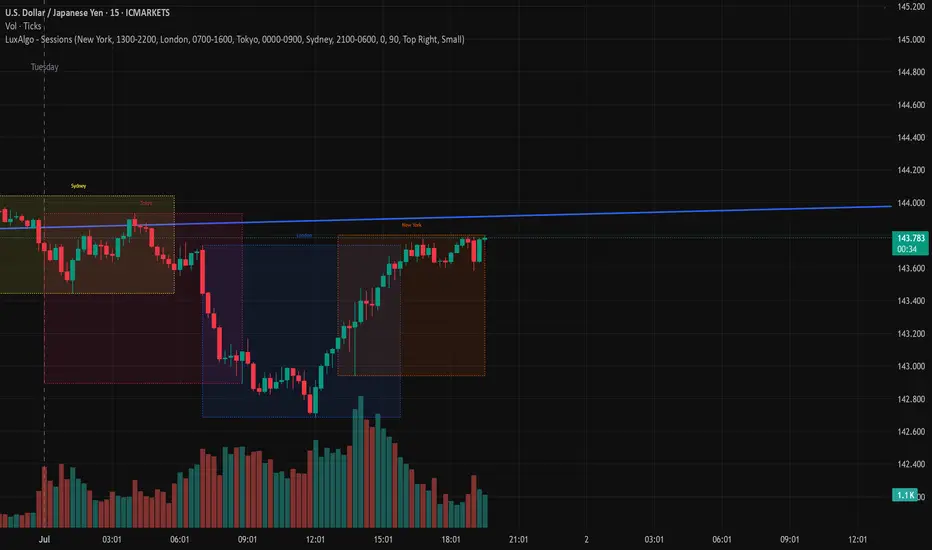
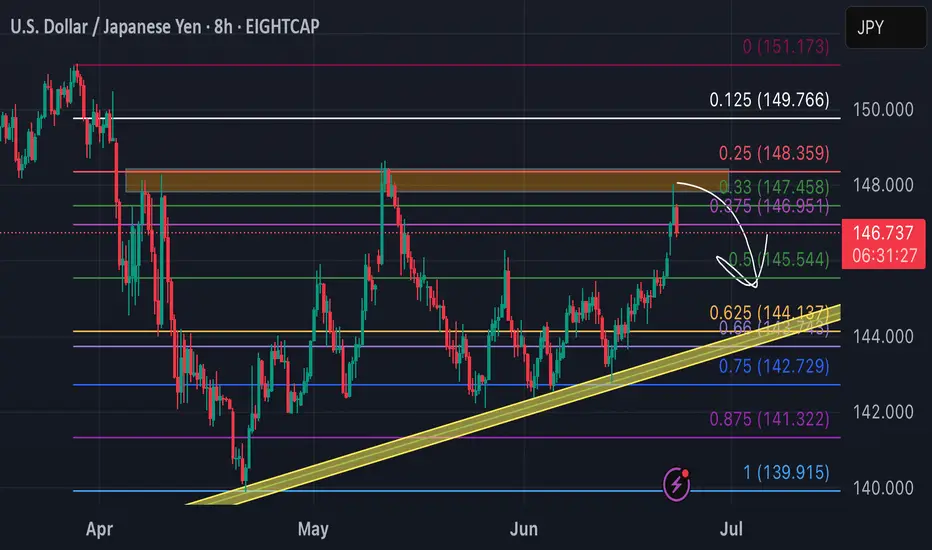
back to daily support USDJPY touched 148 this morning ahead of US PMI.
According to methodology
1. Resistance Zone:
• The 0.125 level (147.820) acted as a resistance point where selling pressure overwhelmed buying pressure, causing the price to reverse downward. Since the price reached 148.000 (just above 147.820), it tested and failed to sustain above this level, reinforcing its role as a barrier.
2. Daily Support
•The daily support trend line (yellow box) has been an area to watch as price continues to try and get over the 148 hump. Until then, this pair is going to wedge until a break confirmation.
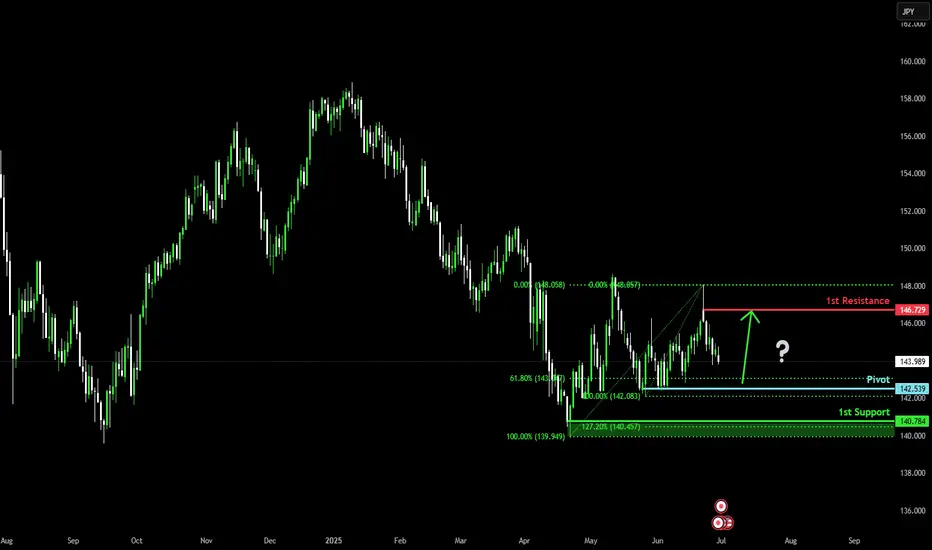
Bullish bounce off pullback support?USD/JPY is falling towards the pivot and could bounce to the 1st resistance, which is a pullback resistance.
Pivot: 142.53
1st Support: 140.78
1st Resistance: 146.72
Risk Warning:
Trading Forex and CFDs carries a high level of risk to your capital and you should only trade with money you can afford to lose. Trading Forex and CFDs may not be suitable for all investors, so please ensure that you fully understand the risks involved and seek independent advice if necessary.
Disclaimer:
The above opinions given constitute general market commentary, and do not constitute the opinion or advice of IC Markets or any form of personal or investment advice.
Any opinions, news, research, analyses, prices, other information, or links to third-party sites contained on this website are provided on an "as-is" basis, are intended only to be informative, is not an advice nor a recommendation, nor research, or a record of our trading prices, or an offer of, or solicitation for a transaction in any financial instrument and thus should not be treated as such. The information provided does not involve any specific investment objectives, financial situation and needs of any specific person who may receive it. Please be aware, that past performance is not a reliable indicator of future performance and/or results. Past Performance or Forward-looking scenarios based upon the reasonable beliefs of the third-party provider are not a guarantee of future performance. Actual results may differ materially from those anticipated in forward-looking or past performance statements. IC Markets makes no representation or warranty and assumes no liability as to the accuracy or completeness of the information provided, nor any loss arising from any investment based on a recommendation, forecast or any information supplied by any third-party.
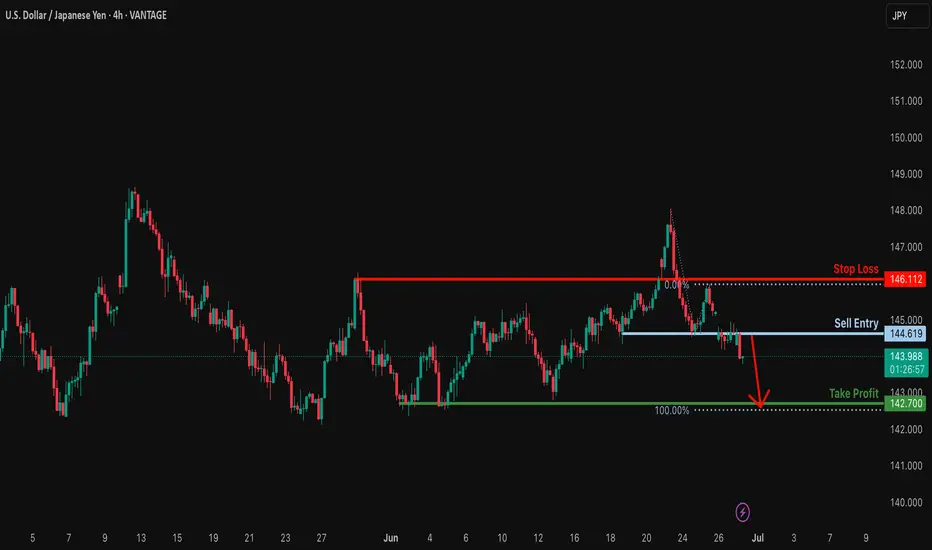
Potential bearish drop?USD/JPY has rejected off the resistance level which is a pullback resistance and could drop from this level to our take profit.
Entry: 144.61
Why we like it:
There is a pullback resistance level.
Stop loss: 146.11
Why we like it:
There is a pullback resistance level.
Take profit: 142.70
Why we like it:
There is a pullback support level that lines up with the 100% Fibonacci projection.
Enjoying your TradingView experience? Review us!
Please be advised that the information presented on TradingView is provided to Vantage (‘Vantage Global Limited’, ‘we’) by a third-party provider (‘Everest Fortune Group’). Please be reminded that you are solely responsible for the trading decisions on your account. There is a very high degree of risk involved in trading. Any information and/or content is intended entirely for research, educational and informational purposes only and does not constitute investment or consultation advice or investment strategy. The information is not tailored to the investment needs of any specific person and therefore does not involve a consideration of any of the investment objectives, financial situation or needs of any viewer that may receive it. Kindly also note that past performance is not a reliable indicator of future results. Actual results may differ materially from those anticipated in forward-looking or past performance statements. We assume no liability as to the accuracy or completeness of any of the information and/or content provided herein and the Company cannot be held responsible for any omission, mistake nor for any loss or damage including without limitation to any loss of profit which may arise from reliance on any information supplied by Everest Fortune Group.
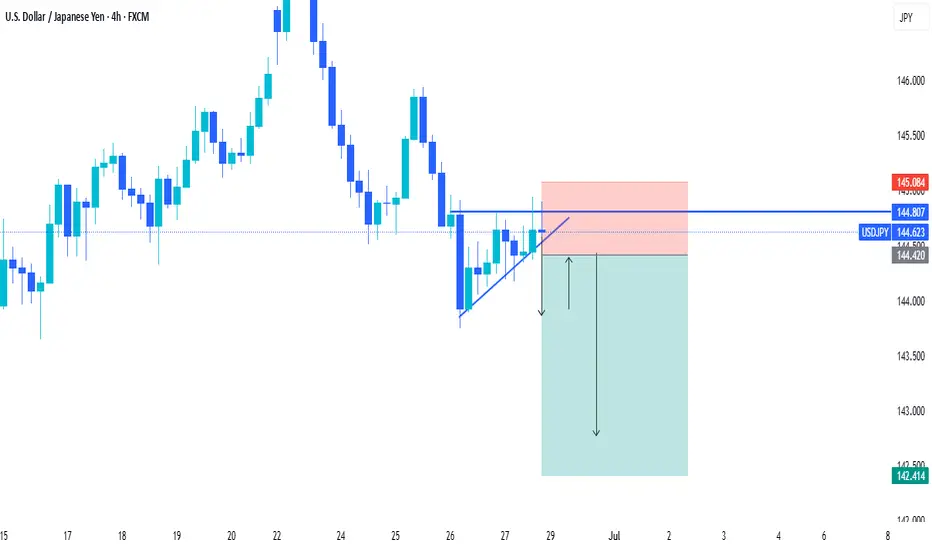
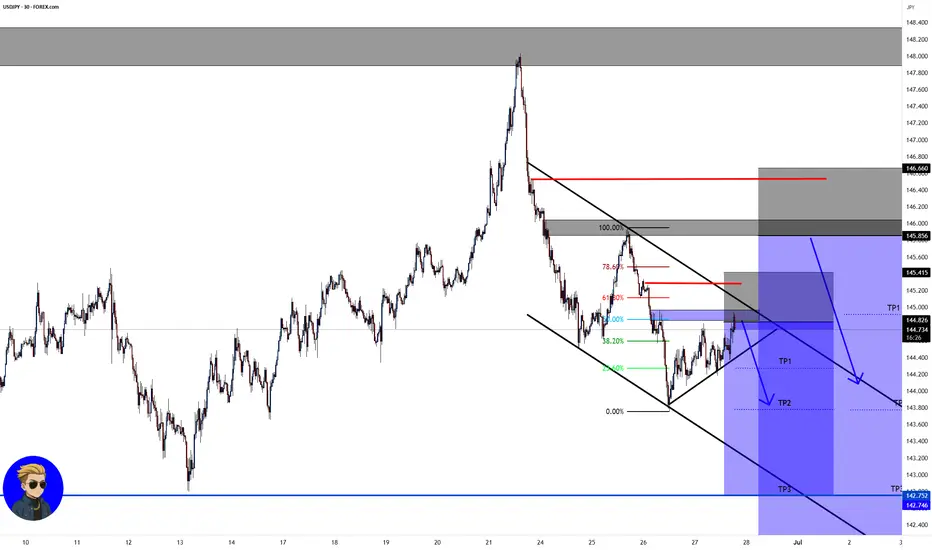
USD/JPY💰Symbol: { USD/JPY }
🟩Price: { 144.790 & 145.856 }
🟥Stop: { 145.415 & 146.660 }
1️⃣profit: { 144.279 & 144.916 }
2️⃣profit: { 143.780 & 143.780 }
3️⃣profit: { 142.746 & 142.746 }
4️⃣profit: { 142.139 }
📊Check your chart before entering.
🚨Check before use to make sure there is no important news.🚨
USDJPY GOING SHORT🔥 Sellers in control after breaking structure.
🎯 TP: Demand Zone below
🛑 SL: Just above Supply
🔴 Looking to sell the premium and ride the drop!
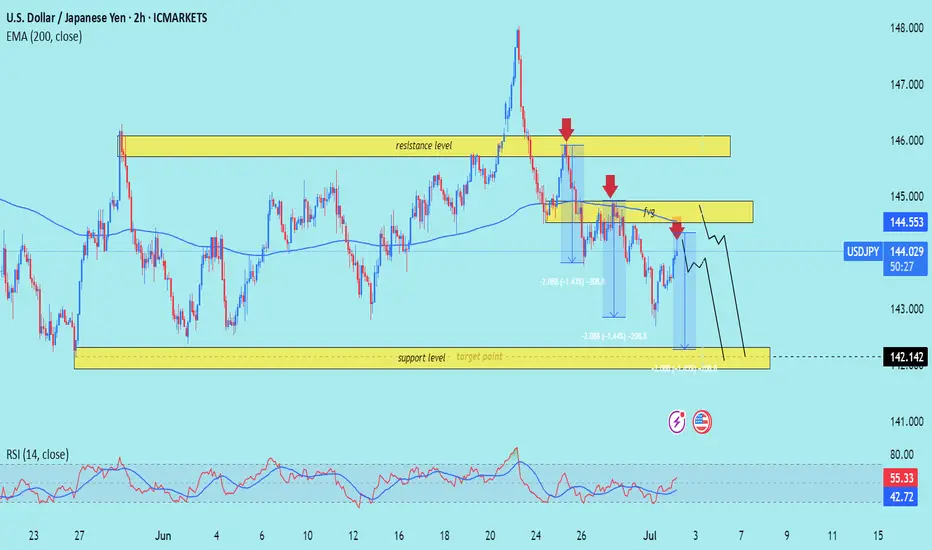
USD/JPY) Back support level Read The captionSMC trading point update
Technical analysis of USD/JPY pair using a combination of price action, resistance/support levels, and indicators. Here's a breakdown of the idea behind the analysis:
---
Chart Breakdown (2H - USD/JPY)
1. Key Zones:
Resistance Level (Yellow Box at Top):
Price has previously been rejected from this zone multiple times.
Recent bearish wicks and aggressive sell-offs are marked by red arrows—showing strong seller interest.
Support Level / Target Point (Bottom Yellow Box):
Price has found strong buying interest around 142.142.
This zone is the anticipated downside target if the bearish scenario plays out.
2. Bearish Bias Justification:
Liquidity Grab / Fakeout (labeled “fug”):
The price briefly broke above the smaller resistance block but quickly reversed.
This "fake breakout" often traps buyers, strengthening the bearish case.
EMA 200 (Blue Line):
Price is currently near or slightly under the 200 EMA (144.553), suggesting a potential rejection area aligning with resistance.
RSI Indicator:
RSI shows divergence and has not confirmed a bullish breakout.
The values (56.77 and 42.82) indicate loss of bullish momentum.
3. Projection (Black Lines):
The black zig-zag lines represent a forecasted drop to the support level.
Suggests a short setup near 144.50–145.00 with targets near 142.14.
Mr SMC Trading point
---
Summary:
Bias: Bearish
Entry Zone: Near resistance area (144.50–145.00)
Target: 142.142 (support zone)
Invalidation: Strong break above 145.00 and hold
Confirmation: Rejection from resistance with bearish candle pattern
---
Please support boost 🚀 this analysis)
Forecast USDJPY Disclaimer:
This is not financial advice, and I do not encourage anyone to follow my analysis blindly. I’m simply sharing my personal market view based on my strategy, experience, and interpretation of the data.
Everyone is responsible for their own decisions.
The USD/JPY market has likely just exited
its accumulation phase after several weeks of quiet consolidation. What we’re seeing now is a clear buy-side manipulation orchestrated by major players. Despite weak fundamentals for the dollar — disappointing NFP, rising unemployment, and a slowdown in services — price exploded to the upside, trapping early sellers and drawing in retail buyers through a false breakout.
Technically, the market is overbought on H1 and H4, with a hidden bearish divergence extending all the way from the historical highs of 1971, combined with a confirmed bearish reversal divergence on the weekly chart. On top of that, institutional speculators (COT data) are heavily short USD/JPY, reinforcing the idea that this rally is not genuine but engineered for liquidity grabs.
I’m not rushing in. I’m waiting for 146.00, a key psychological and structural level where this manipulation could reach its peak. That zone would likely mark the end of the fake bullish move and the beginning of a real distribution phase. All signals — technical, macro, and behavioral — are aligned. This could be one of the best short opportunities on USD/JPY in months.
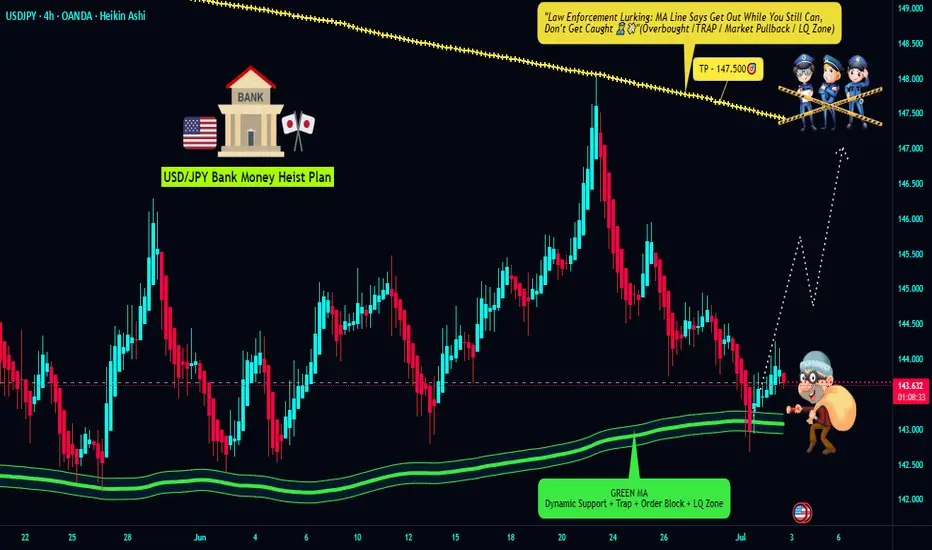
USD/JPY "The Ninja Heist" – Bullish Loot Grab!🌟 Hey, Thieves & Market Bandits! 🌟
💰 Ready to raid the USD/JPY "The Gopher" vault? 💰
Based on 🔥Thief Trading Style🔥 (technical + fundamental heist analysis), here’s the master plan to swipe bullish profits before the market turns against us! Escape near the high-risk Yellow MA Zone—overbought, consolidation, and bear traps ahead! 💸 "Take the money and run—you’ve earned it!" 🏆🚀
🕵️♂️ Heist Strategy:
📈 Entry (Bullish Raid):
The vault’s unlocked! Buy any price—this heist is LIVE!
Pullback lovers: Set buy limits at recent/swing lows for extra loot.
🛑 Stop Loss (Escape Route):
Thief SL at recent/swing low (4H/Day trade basis).
Adjust based on your risk, lot size, and multiple orders.
🎯 Target (Profit Escape):
147.500 (or flee earlier if bears ambush!)
⚔️ Scalpers’ Quick Strike:
LONG ONLY! If rich, attack now. If not, join swing traders & rob slowly.
Trailing SL = Your bodyguard! 💰🔒
💥 Why This Heist?
USD/JPY "The Ninja" is bullish due to key factors—check:
📌 Fundamental + Macro + COT Report
📌 Quantitative + Sentiment + Intermarket Analysis
📌 Future Targets & Overall Score (Linkks In the profile!) 🔗🌍
🚨 Trading Alert (News = Danger!):
Avoid new trades during news—volatility kills!
Trailing SL saves profits on running positions.
💖 Support the Heist Team!
💥 Smash the Boost Button! 💥
Help us steal more money daily with Thief Trading Style! 🏆🚀
Stay tuned—another heist is coming soon! 🤑🎯
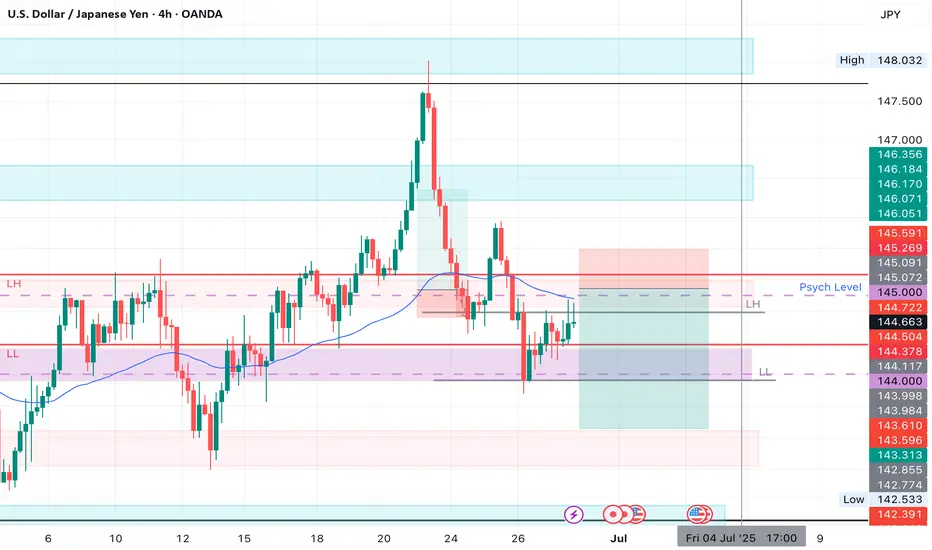
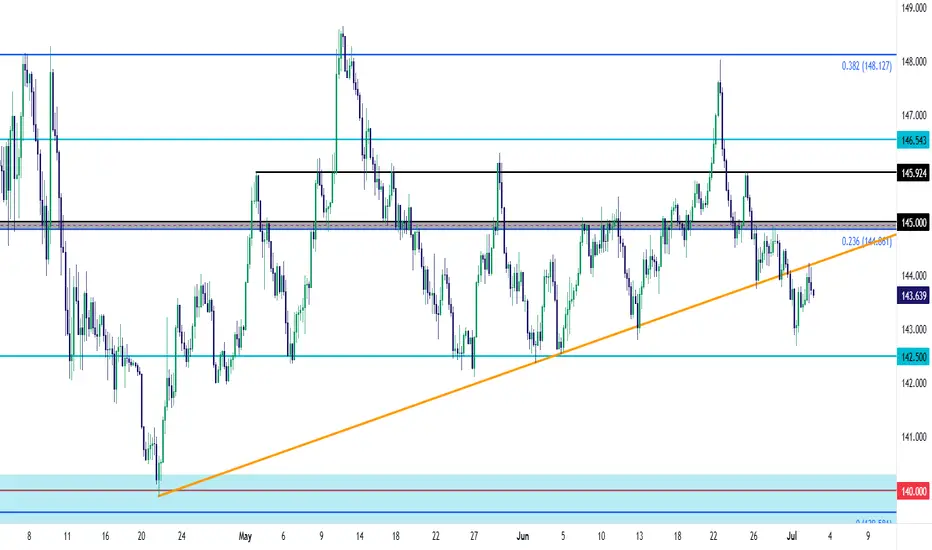
USD/JPY Trendline Now as ResistanceDespite the massive move of weakness in USD in Q2, USD/JPY has held up relatively well, especially over the past two months.
The 140.00 level held the lows in April and then it was the 142.50 level. The bullish trendline connecting those two points had some additional higher-low context.
But as looked at last week, the 145.00 zone was now set up as possible lower-high resistance and that last bounce from the trendline found sellers there, leading to a breach earlier this week.
Now that trendline is showing up as resistance potential. Notably bears were unable to stretch down for re-test of 142.50, and if we do end up with a larger short squeeze in the USD, the pair could become interesting on the long side again. For that, the 145.00 level remains key and buyers will first need to take that out to exhibit some element of control on a shorter-term basis. - js
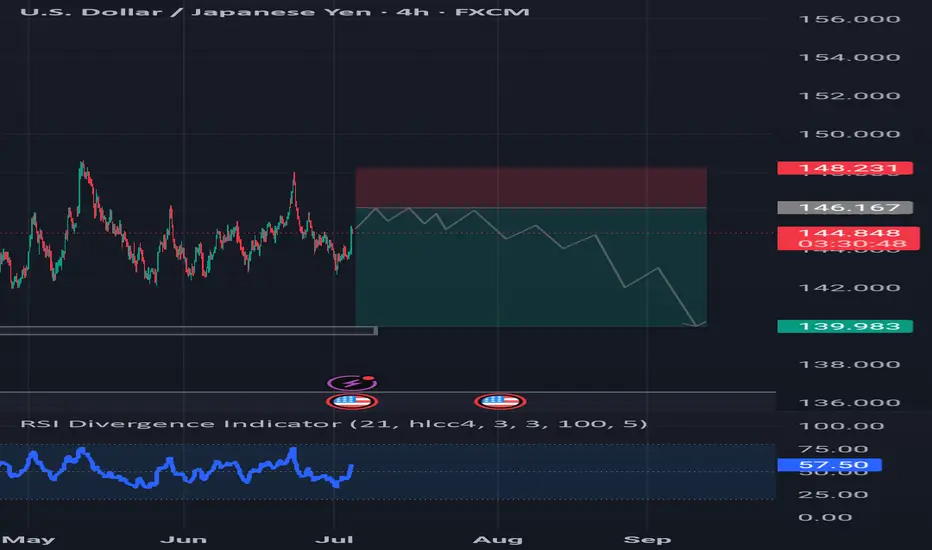
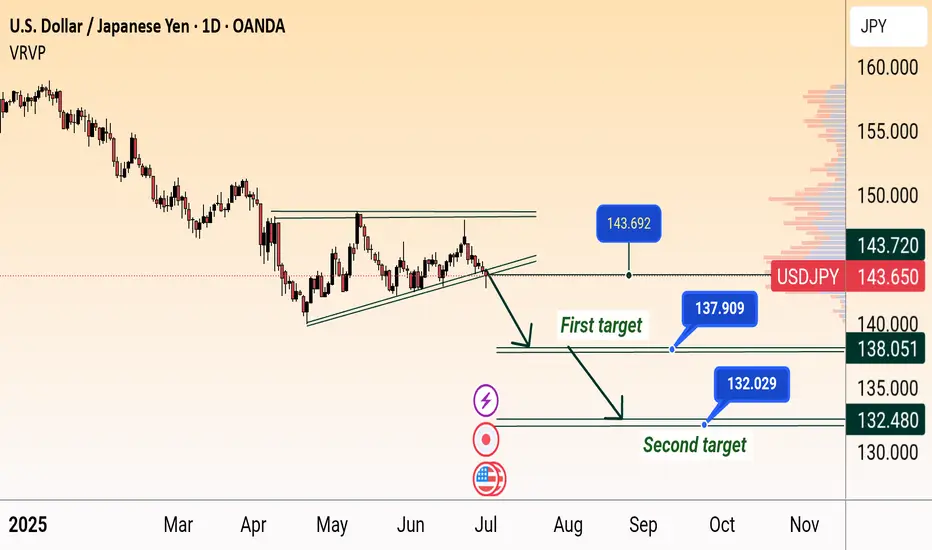
USD/JPY Bearish Breakdown Targets 138 & 132USD/JPY Bearish Breakdown Setup (Daily Chart)
USD/JPY breaks below rising wedge support near 144, signaling potential downside. Price targets are marked at 138.051 (first target) and 132.480 (second target), indicating possible continued weakness if the bearish momentum holds.
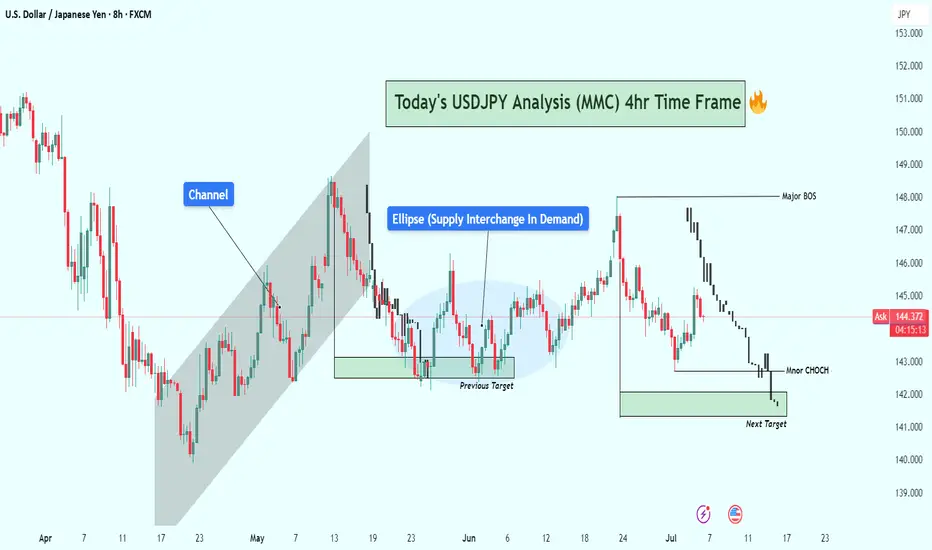
USDJPY 4-Hour Technical Analysis (Smart Money Concept Breakdown)📈 Overall Market Structure Overview:
The chart reflects a multi-phase Smart Money playbook, consisting of:
Bullish channel structure
Breakout followed by liquidity sweep
Supply zone flip to demand
Price mitigation and structure shift
Anticipated reaction zone for upcoming move
🔎 Phase-by-Phase Analysis:
🧱 1. Ascending Channel Formation
Price was moving upward in a controlled bullish ascending channel, suggesting institutional accumulation with planned distribution above highs.
The channel breakout was the first significant liquidity event, where early breakout traders were baited.
💧 2. Fakeout and Supply Interchange into Demand (Ellipse Zone)
Once the channel broke, price sharply reversed, retracing into a previous supply zone.
However, institutions defended this zone, flipping it into a demand area.
This behavior, marked with the blue ellipse, signals “Supply Interchange in Demand” – a core SMC concept.
Here, orders were absorbed
Liquidity was trapped below
A bullish push confirmed institutional intent
🎯 3. Previous Target Hit – Completion of Bullish Leg
Price made a strong rally from the demand zone, hitting the previous target near 147–148 zone.
This bullish leg created a Major Break of Structure (BOS) confirming bullish dominance at that phase.
⚠️ 4. Distribution Begins: Shift in Momentum
After reaching the Major BOS area, price failed to hold higher levels.
A decline followed, indicating distribution by smart money.
The reaction was sharp and consistent, creating lower highs, signaling weakness.
🔄 5. Minor CHoCH Formation – Early Reversal Signal
A Minor Change of Character (CHoCH) occurred around the 144.000–143.000 area.
This is a key transition, where smart money transitions from bullish intent to potential bearish delivery.
📦 6. Next Target Zone – Bullish POI (Point of Interest)
The chart identifies a next target demand zone around 141.800–141.200, marked in green.
This zone:
Holds unmitigated demand
Sits below a recent liquidity pool
Aligns with past support
This is where Smart Money could re-enter, offering a long opportunity if a bullish CHoCH or BOS forms from that zone.
📊 Trade Scenarios & Forecast:
🔻 Bearish Short-Term Play (Sell Setup):
If price respects current resistance (144.500–145), and a lower high forms:
Short entry opportunity
Target: 142.000–141.200 demand zone
Confirmation: Strong bearish candle, CHoCH below minor support
🔺 Bullish Reversal Play (Buy Setup):
At the demand zone:
Look for bullish reaction + CHoCH or BOS
Long entry potential
Target: Retest of 144.000 or even 147.000 if liquidity allows
🔐 Smart Money Tactics in Play:
Liquidity Engineering:
Price trapped both bulls (at highs) and bears (below ellipse zone)
Supply into Demand Flip:
A classic trap where supply becomes a launchpad for bullish delivery
Minor CHoCH:
Early signal of intent change
Next POI (Point of Interest):
Potential reaccumulation zone below major liquidity grab
🧠 Educational Takeaway:
This analysis illustrates:
Why breakouts are often traps without confirmation
How to identify real institutional zones
The role of CHoCH/BOS in planning ahead
Importance of waiting for price to come to your levels, not chasing
⚠️ Risk & Caution:
News catalysts can cause deviation from technical levels
Always use stop loss and proper risk management
SMC is about patience and precision, not prediction
✅ Summary:
USDJPY is showing early signs of a smart money distribution and a potential pullback toward demand.
Watch closely for confirmation at the key zone (141.800–141.200) before engaging long. Until then, short setups on rallies may be favorable.
what will be the next move for usdjpy price has been going down for the bast few days , so we will see the price going up for the next day