USD/JPY 4-Hour Forex Chart4-hour chart from FOREX.com displays the exchange rate between the U.S. Dollar (USD) and the Japanese Yen (JPY). The current rate is 147.446, with a slight increase of 0.072 (+0.05%). The chart shows recent price movements, including a notable drop within a highlighted support and resistance zone (light green and pink areas). Buy and sell prices are marked at 147.446 and 147.444, respectively, with additional price levels indicated on the right side ranging from 146.943 to 149.000. The chart includes candlestick patterns and is timestamped up to July 22, 2025.
USDJPY trade ideas

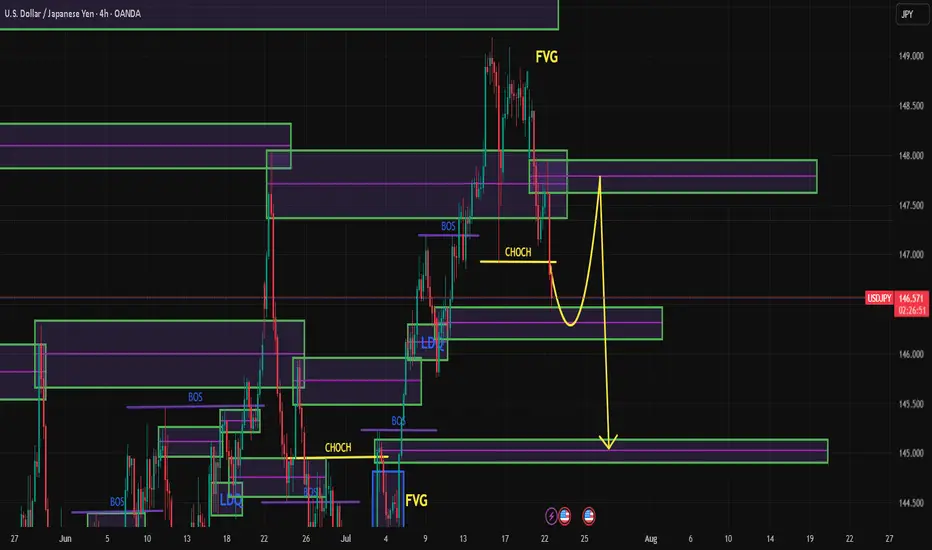
USDJPY Q3 | D24 | W30 | Y25 VIDEO EXPLANATION 📊USDJPY Q3 | D24 | W30 | Y25
Daily Forecast🔍📅
Here’s a short diagnosis of the current chart setup 🧠📈
Higher time frame order blocks have been identified — these are our patient points of interest 🎯🧭.
It’s crucial to wait for a confirmed break of structure 🧱✅ before forming a directional bias.
This keeps us disciplined and aligned with what price action is truly telling us.
📈 Risk Management Protocols
🔑 Core principles:
Max 1% risk per trade
Only execute at pre-identified levels
Use alerts, not emotion
Stick to your RR plan — minimum 1:2
🧠 You’re not paid for how many trades you take, you’re paid for how well you manage risk.
🧠 Weekly FRGNT Insight
"Trade what the market gives, not what your ego wants."
Stay mechanical. Stay focused. Let the probabilities work.
FRGNT

USDJPY Structure Analysis – Liquidity Filled, Rejection + Target🧠 Overview:
This 2-hour chart of USDJPY highlights a clear bearish structure following a smart money-driven move. The price action reflects market maker behavior, liquidity manipulation, trendline rejections, and strategic zone targeting. Let's break down the key elements for today’s USDJPY analysis.
🔍 Key Technical Breakdown:
1. 🏦 Liquidity Grab & Fill (July 17th)
The marked green zone shows an aggressive liquidity sweep where the price dipped sharply into a previous demand zone, triggering stop losses and collecting institutional orders.
This movement represents a classic "liquidity fill", often engineered by market makers to trap retail buyers/sellers.
After sweeping liquidity, price quickly reversed upwards — a signal that large buy orders were triggered and filled.
2. 🎯 Central Zone as a Distribution Region
The market retraced to the "Central Zone", highlighted on the chart, which acted as a distribution area:
Price consolidated and created indecision before rejecting sharply again.
This zone reflects a short-term supply where institutional players may have offloaded positions.
Key clue: This consolidation occurred below the major trendline, increasing its strength as resistance.
3. 🔻 QFL Zones (Quasimodo Failure Levels)
Two QFL levels are marked, which denote structure breaks and retracements in MMC/SMC strategy:
First QFL marks a major support break – a signal of shifting market sentiment from bullish to bearish.
Second QFL confirms continued lower lows formation – solidifying bearish market structure.
These levels are critical in identifying market intent and anticipating future moves.
4. 📉 Descending Trendline Rejection
The descending trendline drawn from recent highs is being respected continuously:
Price tested the trendline multiple times but failed to break above.
These rejections represent seller dominance and validate the trendline as a dynamic resistance.
A break above this line would invalidate the current bearish structure.
5. 🎯 Next Target – Major Demand Zone (145.00–145.20)
Price is heading toward a major demand zone marked in green around 145.000:
This area is a strong buy-side liquidity zone, where institutional buyers may show interest again.
If this zone is tapped, we may see either:
A bounce (bullish reaction), or
A breakdown and continuation lower if bearish momentum continues.
Traders should monitor this area closely for price action signals (engulfing candles, rejection wicks, or bullish divergence).
🧠 Strategic View:
Bias: Bearish, unless trendline breaks with strong volume.
Ideal Entry: Look for short entries on lower timeframe pullbacks into minor resistance (like trendline or last supply zone).
Target Area: 145.00 – ideal zone to book profits or switch bias.
Invalidation: A break and close above the descending trendline + central zone.
🔑 Confluences in This Analysis:
Concept Details
✅ Liquidity Grab Trap & Fill strategy at prior lows
✅ Central Zone Bearish distribution and rejection
✅ Trendline Repeated resistance rejections
✅ Structure Lower lows and QFL confirmations
✅ Target Area Clear next demand zone identified
⚠️ Risk Note:
As always, wait for confirmation before entering trades. The market may fake out near zones. Use proper risk management (1-2% risk per trade) and adjust your strategy as new candles form.
📌 Conclusion:
This chart paints a textbook scenario of how institutional movements and structure-based analysis (MMC/SMC) can offer high-probability setups. We expect further downside toward the 145.00 region before any significant reversal. Keep an eye on reaction from this demand zone for the next play.

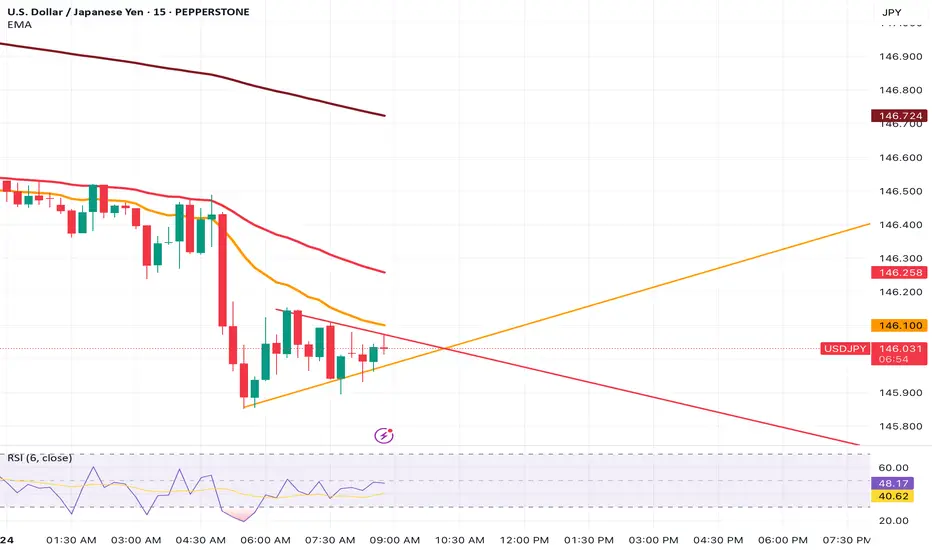
USDJPY LTF Triangle being formedUSDJPY is going down in all TF's
We want to see a SELL position.
On the 15M, we see a Triangle being formed.
If it breaks below, we want to enter into a SELL position.
**New Buy Signal – USD/JPY** (Recovery Plan)* You **can enter now** or set a **pending buy at 146.400** if price pulls back slightly.

USDJPY
Date:
July 21,2025
Session:
New York Open
Pair:
USDJPY
Bias:
Long
1. Clean liquidity pool left unswept from last week's NYC Open (Thursday).
2. NY session typically retraces or extends from London reversal, giving directional momentum.
Entry:147.544
Stop Loss:147.250
Target:148.794
RR:4.11

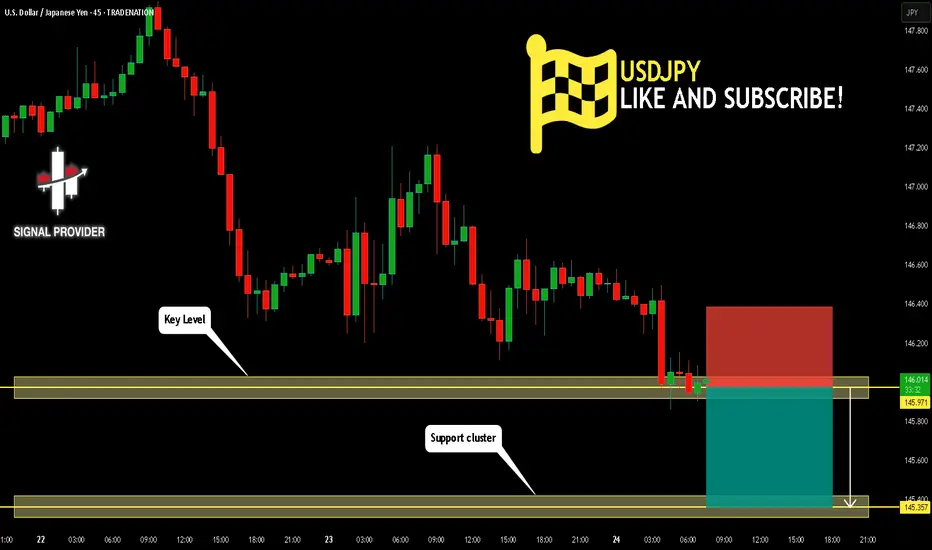
USDJPY Will Go Lower From Resistance! Sell!
Please, check our technical outlook for USDJPY.
Time Frame: 45m
Current Trend: Bearish
Sentiment: Overbought (based on 7-period RSI)
Forecast: Bearish
The market is approaching a significant resistance area 145.971.
Due to the fact that we see a positive bearish reaction from the underlined area, I strongly believe that sellers will manage to push the price all the way down to 145.357 level.
P.S
Overbought describes a period of time where there has been a significant and consistent upward move in price over a period of time without much pullback.
Disclosure: I am part of Trade Nation's Influencer program and receive a monthly fee for using their TradingView charts in my analysis.
Like and subscribe and comment my ideas if you enjoy them!
USD/JPY Fibo Support Test NearbyUSD/JPY continues to brew traps on both sides of the pair as last week's push up to fresh three-month highs has been followed by a decisive snap back in the pair. The drive behind the move is also of interest, as Japanese election results over the weekend haven't been completely digested by Japanese markets, as they were closed on Monday for a public holiday. So the next 24 hours will be key for seeing the way that this theme gets priced-in.
In USD/JPY, there's a support level nearby in the form of the 61.8% retracement of the September-January move. Notably, this was the price that caught the low last Wednesday after the Trump-fueled sell-off took over in the USD, just after the threat to fire Jerome Powell.
Fears of a more dovish Fed make sense for USD-weakness as that could pressure further unwind of the carry trade. But with the LDP losing a majority in the upper chamber, it seems that greater political vulnerability would make for a more difficult road for the Bank of Japan to hike rates. Nonetheless, the response to support is what matters here, and there's quite a bit of structure lurking below the Fibonacci level, with 146.54 and 145.93 both of note, and that's before the 145.00 level comes back into play. - js
USD/JPY(20250724)Today's AnalysisMarket news:
U.S. President Trump continued to lash out at the Federal Reserve on Tuesday, but seemed to back off from the remaining plan to fire Chairman Powell. "I think he's doing a bad job, but he's going to be out of office soon anyway," Trump said in an exchange with reporters at the White House. "In eight months, he'll be out of office."
Technical analysis:
Today's buying and selling boundaries:
146.60
Support and resistance levels:
147.70
147.29
147.02
146.18
145.92
145.51
Trading strategy:
If the price breaks through 146.60, consider buying in, with the first target price at 147.02
If the price breaks through 146.18, consider selling in, with the first target price at 145.92

BULLISH SCENARIO A piece of prcie action with a blend of key levels and the various candle stick formation
but in all we keep watch as an eagle
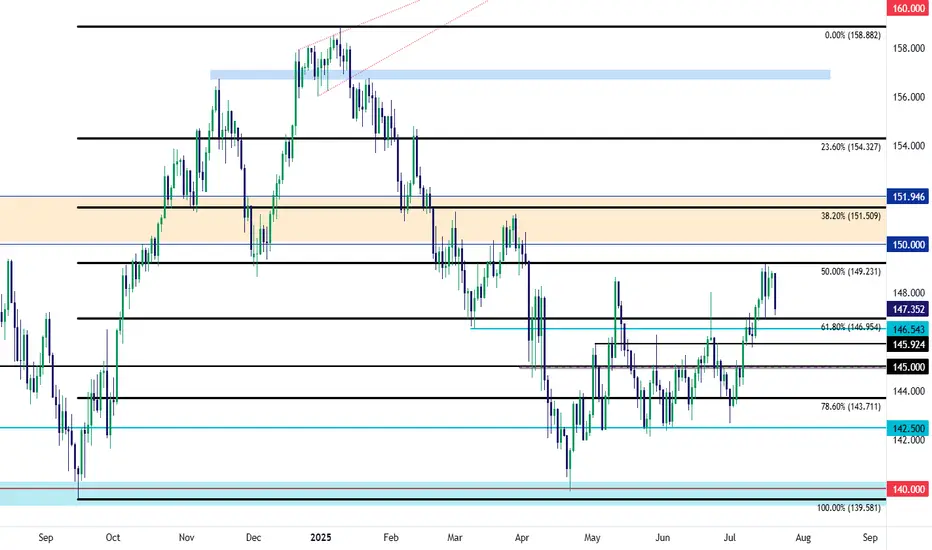
USDJPY Technical Analysis – Key Support Zone in Focus!USDJPY Technical Analysis – Key Support Zone in Focus!
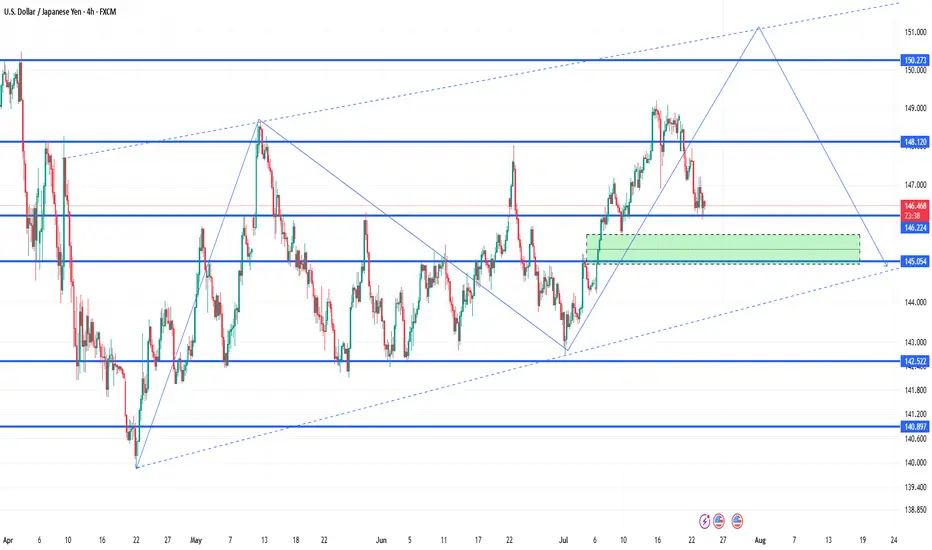
As shown in the chart, USDJPY has broken out of its long-term trendline and is now trading within a rising channel structure. Currently, the price is sitting near a crucial support zone at 145.190, which could play a decisive role in the pair’s next move.
🔹 If this support holds, we may see a bullish continuation towards the following key resistance levels:
First target: 151.110
Next target: 160.100 (upper bound of the channel)
🔻 However, if the 145.190 support fails, the price could decline toward the bottom of the rising channel, with the next major support near:
136.000
📌 This area is critical for swing and position traders. Price action in this zone will likely provide strong signals for entry or exit.
📊 Follow for more real-time analysis and trading insights!

USDJPY 30Min Engaged ( Bullish Entry Detected )➕ Objective: Precision Volume Execution
Time Frame: 30-Minute Warfare
Entry Protocol: Only after volume-verified breakout
🩸 Bullish From now Price : 147.900
➗ Hanzo Protocol: Volume-Tiered Entry Authority
➕ Zone Activated: Dynamic market pressure detected.
The level isn’t just price — it’s a memory of where they moved size.
Volume is rising beneath the surface — not noise, but preparation.
🔥 Tactical Note:
We wait for the energy signature — when volume betrays intention.
The trap gets set. The weak follow. We execute.
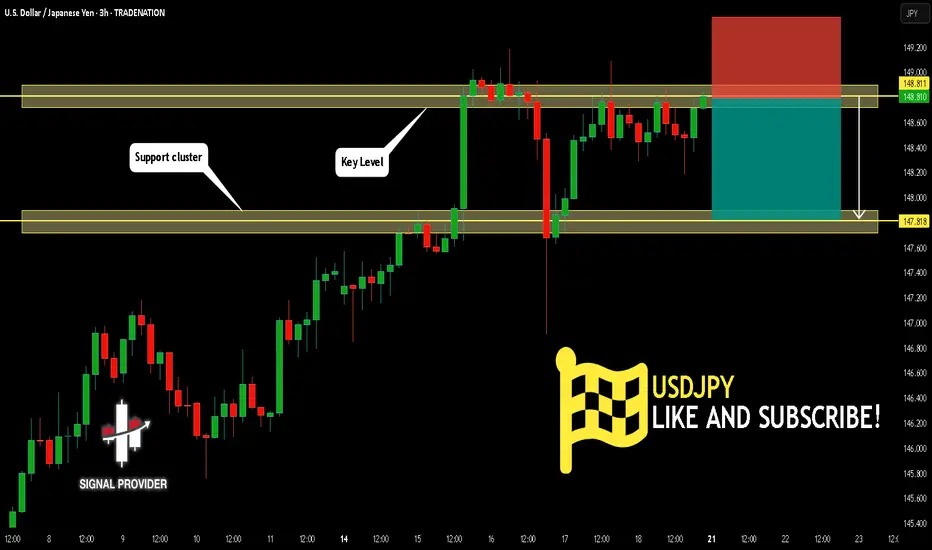
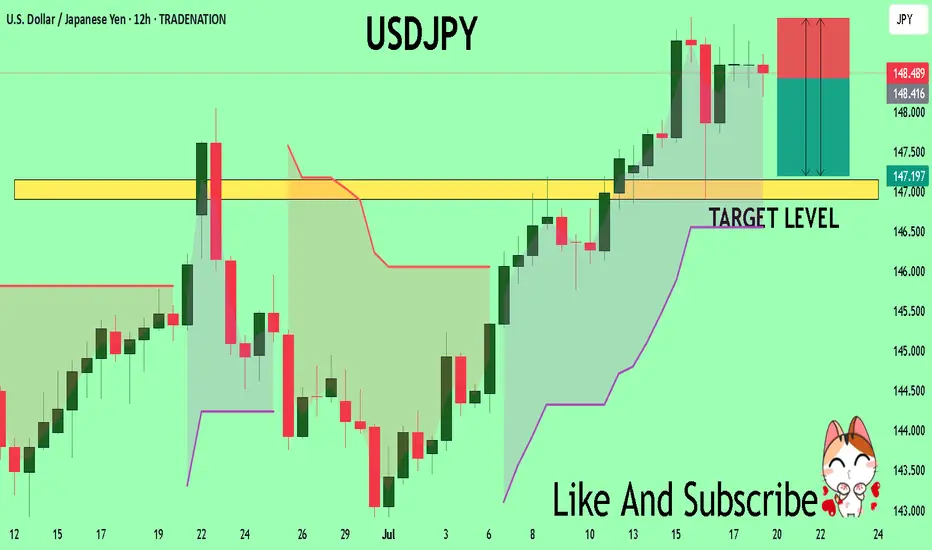
USDJPY Is Very Bearish! Sell!
Please, check our technical outlook for USDJPY.
Time Frame: 3h
Current Trend: Bearish
Sentiment: Overbought (based on 7-period RSI)
Forecast: Bearish
The market is trading around a solid horizontal structure 148.811.
The above observations make me that the market will inevitably achieve 147.818 level.
P.S
We determine oversold/overbought condition with RSI indicator.
When it drops below 30 - the market is considered to be oversold.
When it bounces above 70 - the market is considered to be overbought.
Disclosure: I am part of Trade Nation's Influencer program and receive a monthly fee for using their TradingView charts in my analysis.
Like and subscribe and comment my ideas if you enjoy them!
USDJPY short position 23/07/2025English : According to our analysis, we anticipate a bearish scenario.
Morocan Darija : kanchofo d'apres l'analyse dyalna antsanaw hboot
ATENTION : I only share my ideas, not signals
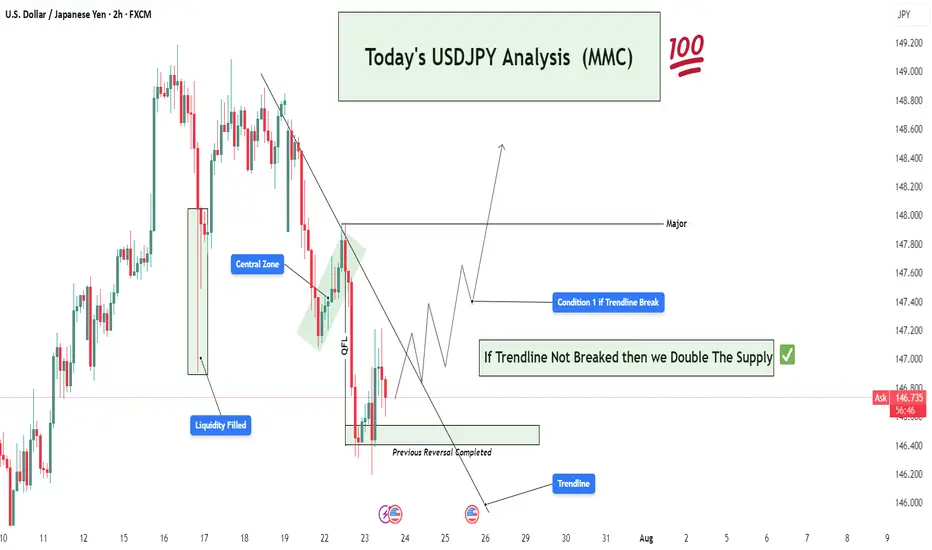
USDJPY 2H Analysis : Trendline Break or Double the Supply?🧠 Market Context:
The market has recently undergone a liquidity grab followed by a temporary bullish reaction, indicating that large players (institutions or market makers) are manipulating price around sensitive zones before committing to a direction.
🧱 Key Technical Zones & Observations:
🟩 1. Liquidity Filled Zone (Smart Money Move)
Location: Around July 17.
Explanation: Price dropped impulsively into a pre-marked liquidity pocket. This filled buy-side liquidity resting below previous lows.
Implication: Smart money has now captured trapped breakout sellers. Expectation of reversal or bullish mitigation.
🟧 2. Central Zone (Supply/Distribution Area)
This zone was tested multiple times, signaling it as a supply-rich region.
Acted as a base for previous strong bearish move.
If the trendline is broken, price may retest this Central Zone, potentially acting as resistance again.
🟩 3. QFL Formation (Quantity Following Line)
Nature: Base breakout with a fast snap-back indicates institutional demand.
The structure signals a failed breakdown or liquidation trap.
Actionable Insight: Strong bounce potential here, ideal for sniper long entries if market structure shifts bullish.
🟦 4. Trendline (Critical Validation Tool)
The descending trendline from July 18 has acted as dynamic resistance.
Multiple rejections validate its significance.
Main Conditional Setup hinges on this trendline:
Break = Bullish structure shift
No break = Trend continuation (retest of demand or breakdown)
🔁 5. Previous Reversal Completed
Price action has printed a reversal model (possibly Wyckoff-style accumulation or spring).
Completion of the pattern aligns with upcoming directional decision.
✅ Conditional Trade Scenarios:
🔺 Condition 1: Bullish Breakout Above Trendline
Setup: Price breaks and closes above the trendline with volume and momentum.
Action: Buy on retest of broken trendline or confirmation candle.
Targets:
Short-term: 147.50
Major: 148.00 – strong resistance/supply zone
Validation: Structure shift + momentum + rejection of prior supply.
🔻 Condition 2: Rejection from Trendline (Trendline Holds)
Setup: Price respects the trendline and fails to break.
Action: Short on bearish engulfing/rejection.
Plan: "Double the supply zone" as per your label.
Targets: 146.20 → 146.00 zone
This respects the previous price memory and liquidity void.
🧠 Deeper MMC Insight:
The market is in indecision phase, balancing between continuation and reversal.
Institutional footprints (QFL + liquidity fills + trendline rejections) suggest preparation for a trap-spring-accumulate or distribution-breakdown move.
Watch for fakeouts around the trendline – MMC logic says market makers often induce both directions before committing.
🧭 Trade Management Tips:
If long: Protect below the QFL base.
If short: Watch for manipulation around the Central Zone.
Wait for confirmation: Don’t pre-enter before structure validates direction.
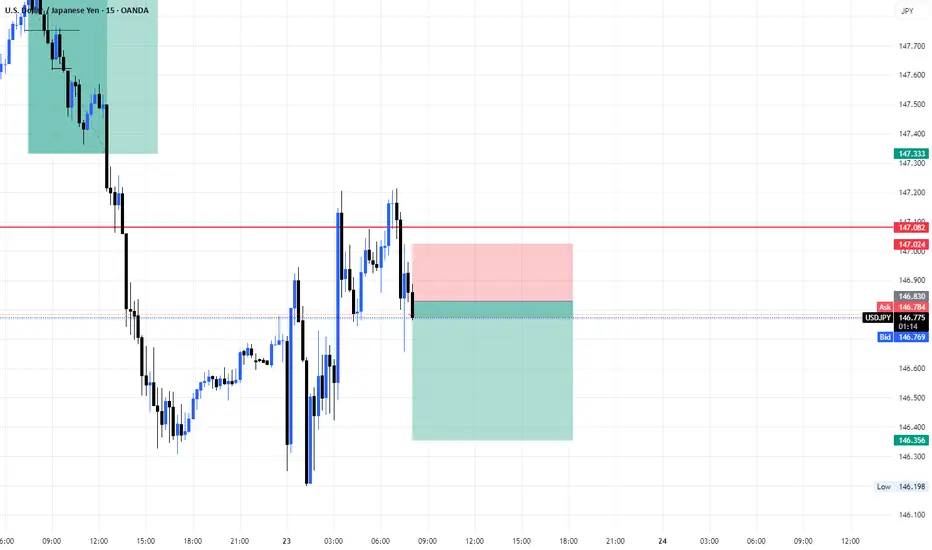
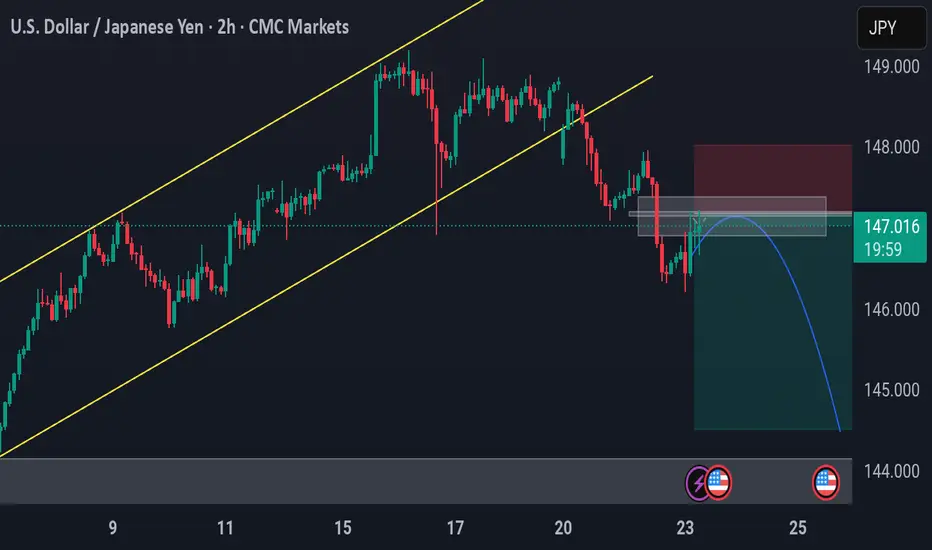
USD/JPY – Bearish Rejection After Channel BreakUSD/JPY – Bearish Rejection After Channel Break
🔹 2H Chart Analysis by PULSETRADESFX
USD/JPY has broken down from a rising channel and is now rejecting a key supply zone around 147.000 – 147.250. The pair is showing early signs of bearish continuation after retesting this zone as resistance.
This setup favors short positions targeting deeper levels, especially with price failing to reclaim the broken structure.
📌 Trade Setup:
Entry: 146.808
Stop Loss: 147.350 (Above supply zone)
TP1: 146.000 (Recent low)
TP2: 145.250 (Demand support)
TP3: 144.300 (Major structural zone)
This is a clean break–retest–continuation scenario with risk-to-reward aligning well for short-term and swing traders.
✅ Bearish Confluences:
Rising channel break
Supply zone rejection
Lower high structure
Bearish engulfing reaction
TP levels mapped to recent price memory zones
📅 July 23, 2025
📊 CMC Markets Feed | USD/JPY (2H)
#USDJPY #ForexAnalysis #BearishBreakdown #TechnicalSetup #PriceAction #TradingView #PULSETRADESFX

USDJPY BUY Setup🗾 USDJPY BUY Setup – Reversal from Demand Zone (H1 Analysis)
📅 22 July 2025
USDJPY has shown strong bearish momentum recently, but price has now tapped into a clear demand zone (marked in green), which previously acted as a launchpad for bullish moves.
🟦 Entry: Buy @ 146.37
🔵 SL: Below 146.00 (just beneath demand zone)
🟩 TP: 149.10 – targeting the recent H1 structure high
🔍 Why I took this trade:
• Clean reaction from a historical demand zone
• Strong rejection wick forming on the hourly
• RSI divergence and volume exhaustion confirmed the buy
• Risk-to-reward ratio > 3:1
⏳ Waiting for confirmation on lower timeframes (M15/M5) before scaling in further.
📊 Let’s see how this plays out – following price action closely!

USDJPY Under Pressure! SELL!
My dear friends,
Please, find my technical outlook for USDJPY below:
The instrument tests an important psychological level 148.46
Bias - Bearish
Technical Indicators: Supper Trend gives a precise Bearish signal, while Pivot Point HL predicts price changes and potential reversals in the market.
Target - 147.15
Recommended Stop Loss - 149.17
About Used Indicators:
Super-trend indicator is more useful in trending markets where there are clear uptrends and downtrends in price.
Disclosure: I am part of Trade Nation's Influencer program and receive a monthly fee for using their TradingView charts in my analysis.
———————————
WISH YOU ALL LUCK
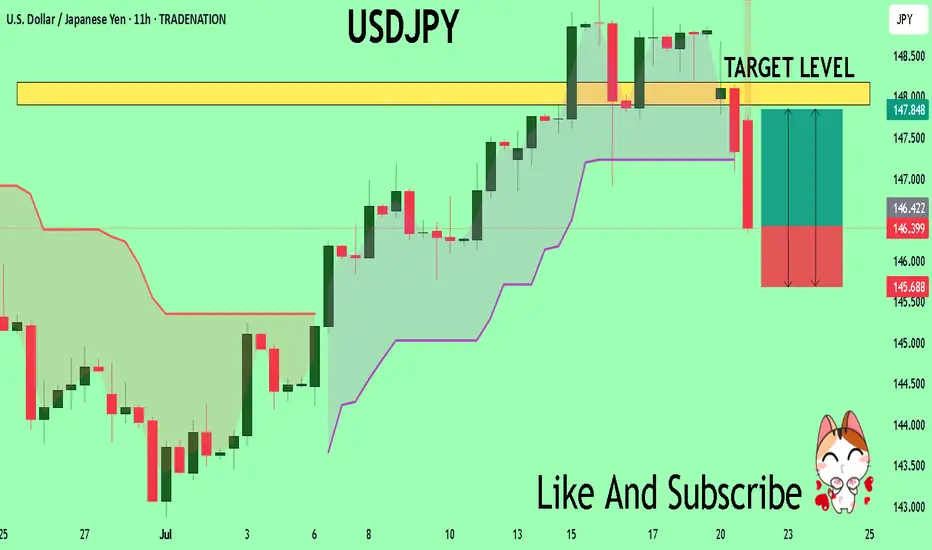
USDJPY Sellers In Panic! BUY!
My dear subscribers,
My technical analysis for USDJPY is below:
The price is coiling around a solid key level - 146.36
Bias - Bullish
Technical Indicators: Pivot Points Low anticipates a potential price reversal.
Super trend shows a clear buy, giving a perfect indicators' convergence.
Goal - 147.90
My Stop Loss - 145.68
About Used Indicators:
By the very nature of the supertrend indicator, it offers firm support and resistance levels for traders to enter and exit trades. Additionally, it also provides signals for setting stop losses
Disclosure: I am part of Trade Nation's Influencer program and receive a monthly fee for using their TradingView charts in my analysis.
———————————
WISH YOU ALL LUCK
USDJPY Smart Money Analysis – Bearish OutlookAfter a confirmed 1-hour bearish divergence @149.202, price initiated a downward structure. We saw a bounce from a bearish 4H Order Block (OB) @147.356, but this bounce did not invalidate the initial bearish divergence structure.
Price then broke below that 4H OB slightly, before retracing back into the same OB zone, forming another 4H bearish OB at that level, indicating reinforced institutional interest. This was followed by a clean CHoCH @146.943, confirming further bearish pressure.
Price reacted next from a bullish 4H OB @146.496, initiating a short-term retracement.
📌 Expectations:
🔁 We expect price to retrace back into the newly created 4H bearish OB @147.626, which is a refined point of interest.
📉 If that level holds as expected, the bearish move is likely to continue towards the next bearish OB sitting around 145.148, which is a potential demand exhaustion zone.
🧠Summary of Key Zones:
1H Bearish Divergence: 149.202
Initial 4H Bearish OB: 147.356
CHoCH Confirmation Level: 146.943
Bullish OB Reaction: 146.496
Expected Retracement POI (4H OB): 147.626
Final Bearish Target OB: 145.148
⚠️Risk Management Note:
This analysis is based on Smart Money Concepts and market structure observation.
Always use proper risk management — risking no more than 1–2% of your capital per trade.
Ensure your stop-loss and lot sizes match your account equity.
News events and volatility can invalidate technical zones quickly.
Trade safe. 🧠💼📉
USDJPY Correction Complete, Is the Bullish Trend Back in play?After pulling back from the recent high near 149.17, USDJPY has shown signs of strength again, rebounding off the confluence support at the ascending trendline. The bullish narrative is supported by a hawkish FOMC tone and news that a U.S. federal court temporarily blocked Trump-era tariffs. The pair now awaits upcoming U.S. economic data for further directional clarity.
🔍 Technical Outlook – Structure & Momentum
✅ Primary trend: Bullish
✅ Correction phase: Completed near CP zone and trendline
✅ Key structural areas: FVG Zone, CP Zone, and trendline remain intact
Price has responded positively from the CP Zone + OBS Buy Zone around 147.438, aligning with the uptrend line. As long as this structure holds, buyers may push the market toward the next resistance zones.
🧭 Trade Scenarios
🔸 Bullish Bias (preferred scenario):
As long as price holds above 147.438, we expect continuation toward the FVG zone, with immediate targets at the GAP + OBS Sell Zone (148.703) and extended potential to the Buy-side Liquidity zone at 149.122.
A clean breakout above 149.122 opens the door to Fibonacci extensions: 149.72 and 150.05.
🔹 Bearish Scenario (if invalidated):
If price breaks below 147.438 and loses the trendline, we may see a deeper drop toward the Liquidity Buy Zone at 146.825, where strong buying interest is expected to re-enter the market.
⚠️ Macro Risk Drivers
Hawkish FOMC minutes continue to support USD strength
Paused trade tariffs reduce political headwinds, improving risk sentiment
Upcoming U.S. economic data could trigger sharp intraday moves → watch closely
📌 Key Price Zones
Liquidity Buy Zone 146.825 Major long re-entry zone
CP + OBS Buy Zone 147.438 Current active support
FVG Zone 148.20 – 148.68 Intraday bullish target
GAP + OBS Sell Zone 148.703 Short-term resistance
Buy-side Liquidity Zone 149.122 Final bullish objective
💬 Structure remains bullish unless the trendline breaks. Stay patient, wait for confirmations at key zones, and follow your plan with disciplined risk management.
