U.S. Dollar / Japanese Yen forum
2/2 Summary of Key Levels
Daily & 4-Hour Support and Resistance
Daily Support Levels: 144.000, 143.800, 143.500
Daily Resistance Levels: 144.500, 145.000, 145.500
4-Hour Support Levels: 144.150, 143.900, 143.750
4-Hour Resistance Levels: 144.300, 144.600, 145.000
Exponential Moving Average (EMA) Levels
Daily EMA Levels:
EMA 50: 144.300
EMA 100: 144.000
EMA 200: 143.750
EMA 400: 143.200
4-Hour EMA Levels:
EMA 50: 144.200
EMA 100: 144.000
EMA 200: 143.800
EMA 400: 143.500
Weekly Pivots
Pivot Level 1: 144.500
Pivot Level 2: 144.200
Pivot Level 3: 143.900
Daily Pivots
Pivot Level 1: 144.300
Pivot Level 2: 144.150
Pivot Level 3: 143.800
Fibonacci Retracement Levels
23.6% Level: 144.546
38.2% Level: 145.062
50.0% Level: 145.392
61.8% Level: 145.812
Fundamental Analysis and Upcoming USD News
As we analyze the USDJPY market, it’s essential to consider the broader economic context, particularly regarding the USD. Upcoming economic events that could impact the USDJPY market include:
Non-Farm Payrolls (NFP): Scheduled for July 7, 2025, this report provides critical insights into employment trends in the U.S. and can significantly influence USD strength.
Consumer Price Index (CPI): To be released on July 12, 2025, the CPI report will shed light on inflation trends, impacting Federal Reserve policies and, consequently, the USD.
Federal Reserve Meeting: On July 25, 2025, any announcements regarding interest rate changes or economic outlook could lead to volatility in the USD and affect USDJPY prices.
Traders should remain vigilant during these periods, as significant fluctuations in USD can lead to corresponding movements in the USDJPY pair.
Conclusion
In conclusion, the current market analysis for USDJPY at 144.172 USD highlights critical support and resistance levels, Fibonacci retracement levels, EMA trends, and other technical indicators. By understanding these market dynamics and keeping an eye on upcoming economic events, traders can make informed decisions and enhance their trading strategies. As always, maintaining a disciplined approach to risk management will be key to navigating the complexities of the forex market successfully.
1/1 🟡 USDJPY Daily Market Analysis—July 2, 2025
Introduction
In the world of forex trading, understanding market dynamics is crucial for making informed decisions. Today, we delve into the USDJPY currency pair, currently trading at 144.172 USD. This analysis will cover both daily and 4-hour timeframes, utilizing various technical indicators such as Fibonacci Retracement Levels, Exponential Moving Averages (EMAs), RSI divergence, weekly and daily pivots, Smart Money Concepts (SMC), support and resistance levels, order blocks, and MACD. By examining these elements, we aim to provide a comprehensive market overview that can aid traders in their decision-making processes.
Market Analysis
Current Market Overview
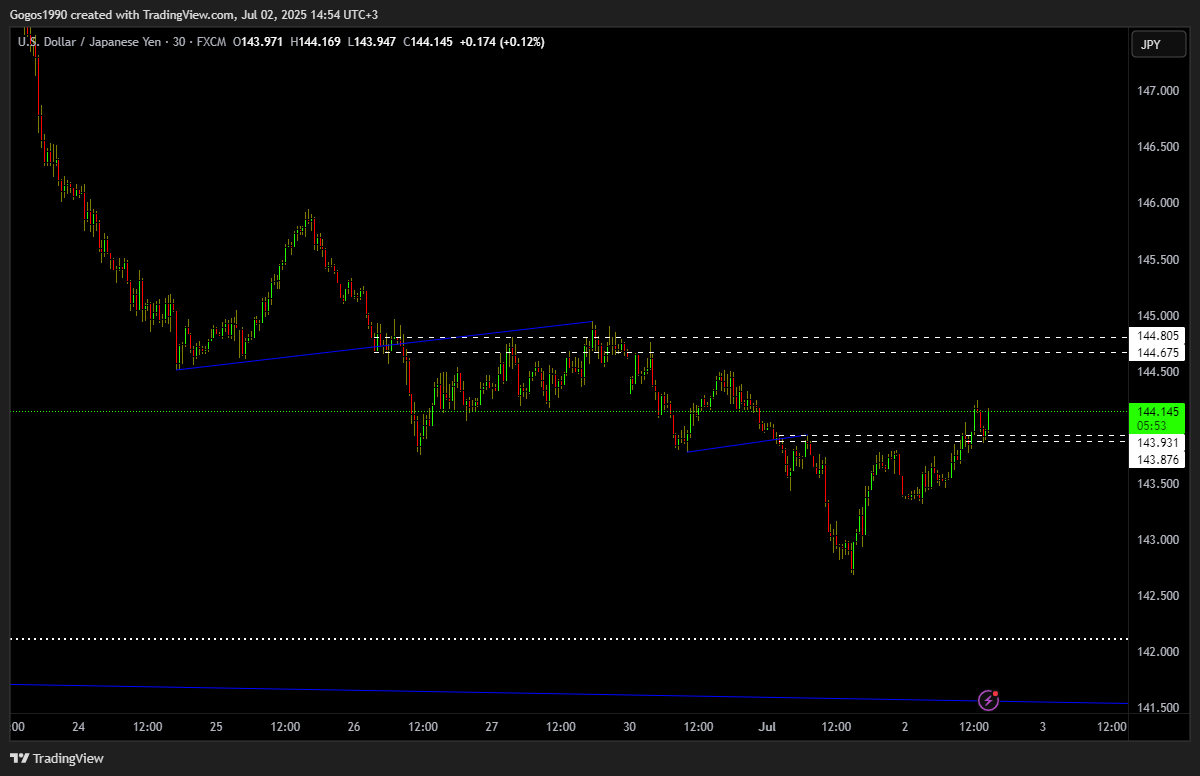
As of the latest data, the USDJPY pair is experiencing fluctuations around the 144.172 USD mark. The recent swing high was recorded at 148.032, while the swing low was at 143.752. This range sets the stage for our analysis, allowing us to identify critical support and resistance levels, as well as potential entry and exit points.
Support & Resistance Levels
Daily Timeframe
Support Levels:
144.000: A psychological level that often attracts buying interest.
143.800: A previous resistance level that has turned into support.
143.500: A significant level where the price has previously reacted.
Resistance Levels:
144.500: A level that has seen selling pressure in the past.
145.000: Another psychological barrier that traders watch closely.
145.500: A level that aligns with previous price action highs.
4-Hour Timeframe
Support Levels:
144.150: A recent low that may provide support.
143.900: A level where buying interest has emerged recently.
143.750: Close to the swing low, offering strong support.
Resistance Levels:
144.300: A level that has been tested multiple times.
144.600: A key resistance level where selling has occurred.
145.000: A strong resistance level that coincides with the daily timeframe.
Fibonacci Retracement Levels
Using the recent swing high of 148.032 and swing low of 143.752, we can identify the following Fibonacci retracement levels:
23.6% Level: 144.546
38.2% Level: 145.062
50.0% Level: 145.392
61.8% Level: 145.812
These levels serve as potential areas of interest for traders, indicating where price reversals may occur.
Exponential Moving Averages (EMA)
Daily Timeframe
EMA 50: 144.300
EMA 100: 144.000
EMA 200: 143.750
EMA 400: 143.200
The EMAs on the daily timeframe indicate a bullish trend, with the price currently above the EMA 50 and EMA 100, suggesting upward momentum.
4-Hour Timeframe
EMA 50: 144.200
EMA 100: 144.000
EMA 200: 143.800
EMA 400: 143.500
On the 4-hour chart, the price remains above the EMA 50, reinforcing the bullish sentiment in the short term.
RSI Divergence
The Relative Strength Index (RSI) currently shows divergence on the daily timeframe. While the price reached higher highs, the RSI has started to form lower highs, indicating potential weakening momentum. Traders should watch for possible price corrections as the market may be signaling a reversal.
Order Blocks
Identifying order blocks can provide insights into where institutional buying or selling has occurred. In our analysis:
Bullish Order Block: Located around 143.800, where significant buying interest has previously emerged.
Bearish Order Block: Found near 145.200, where selling pressure has increased.
These order blocks can act as potential support and resistance zones, guiding traders on where to place their orders.
MACD Analysis
The Moving Average Convergence Divergence (MACD) indicator currently shows a bullish crossover, with the MACD line above the signal line. This suggests that the upward momentum could continue, supporting the overall bullish outlook for the USDJPY pair.
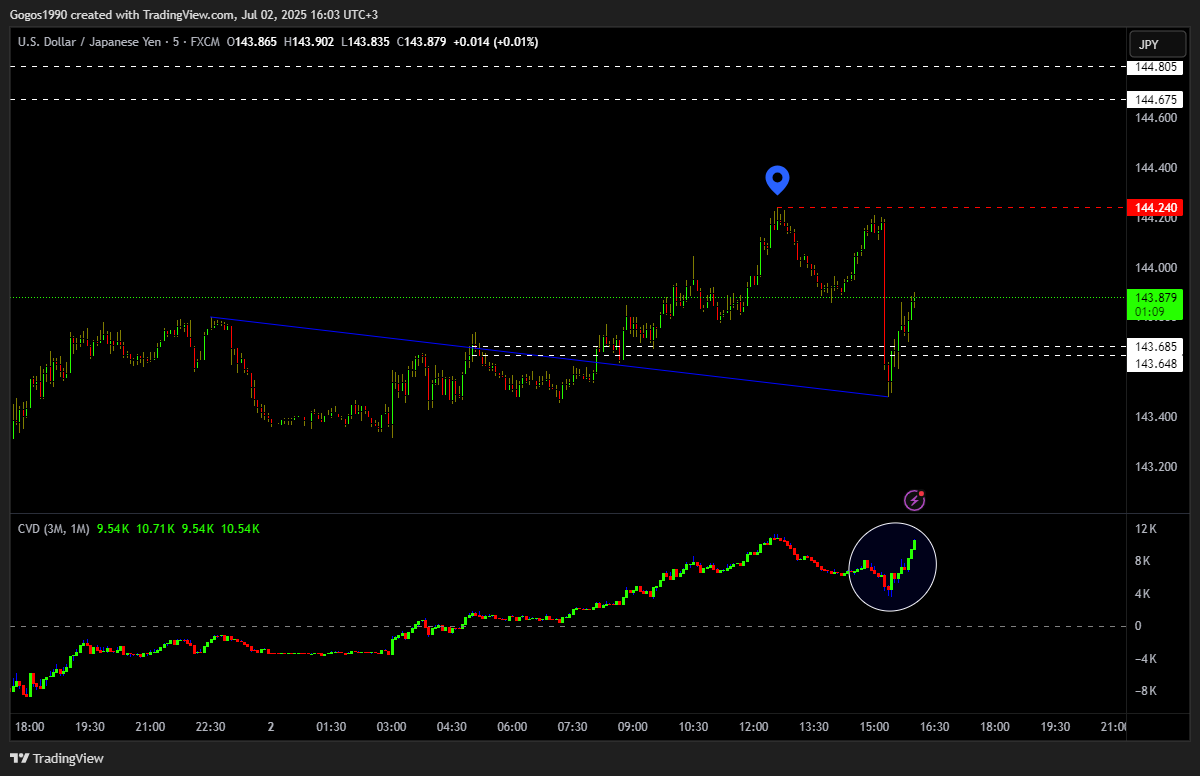
profit target 141.55
stoploss: 144.30
patience is key
slow and steady.
stick to the plan
avoid impulse