U.S. Dollar / Japanese Yen forum
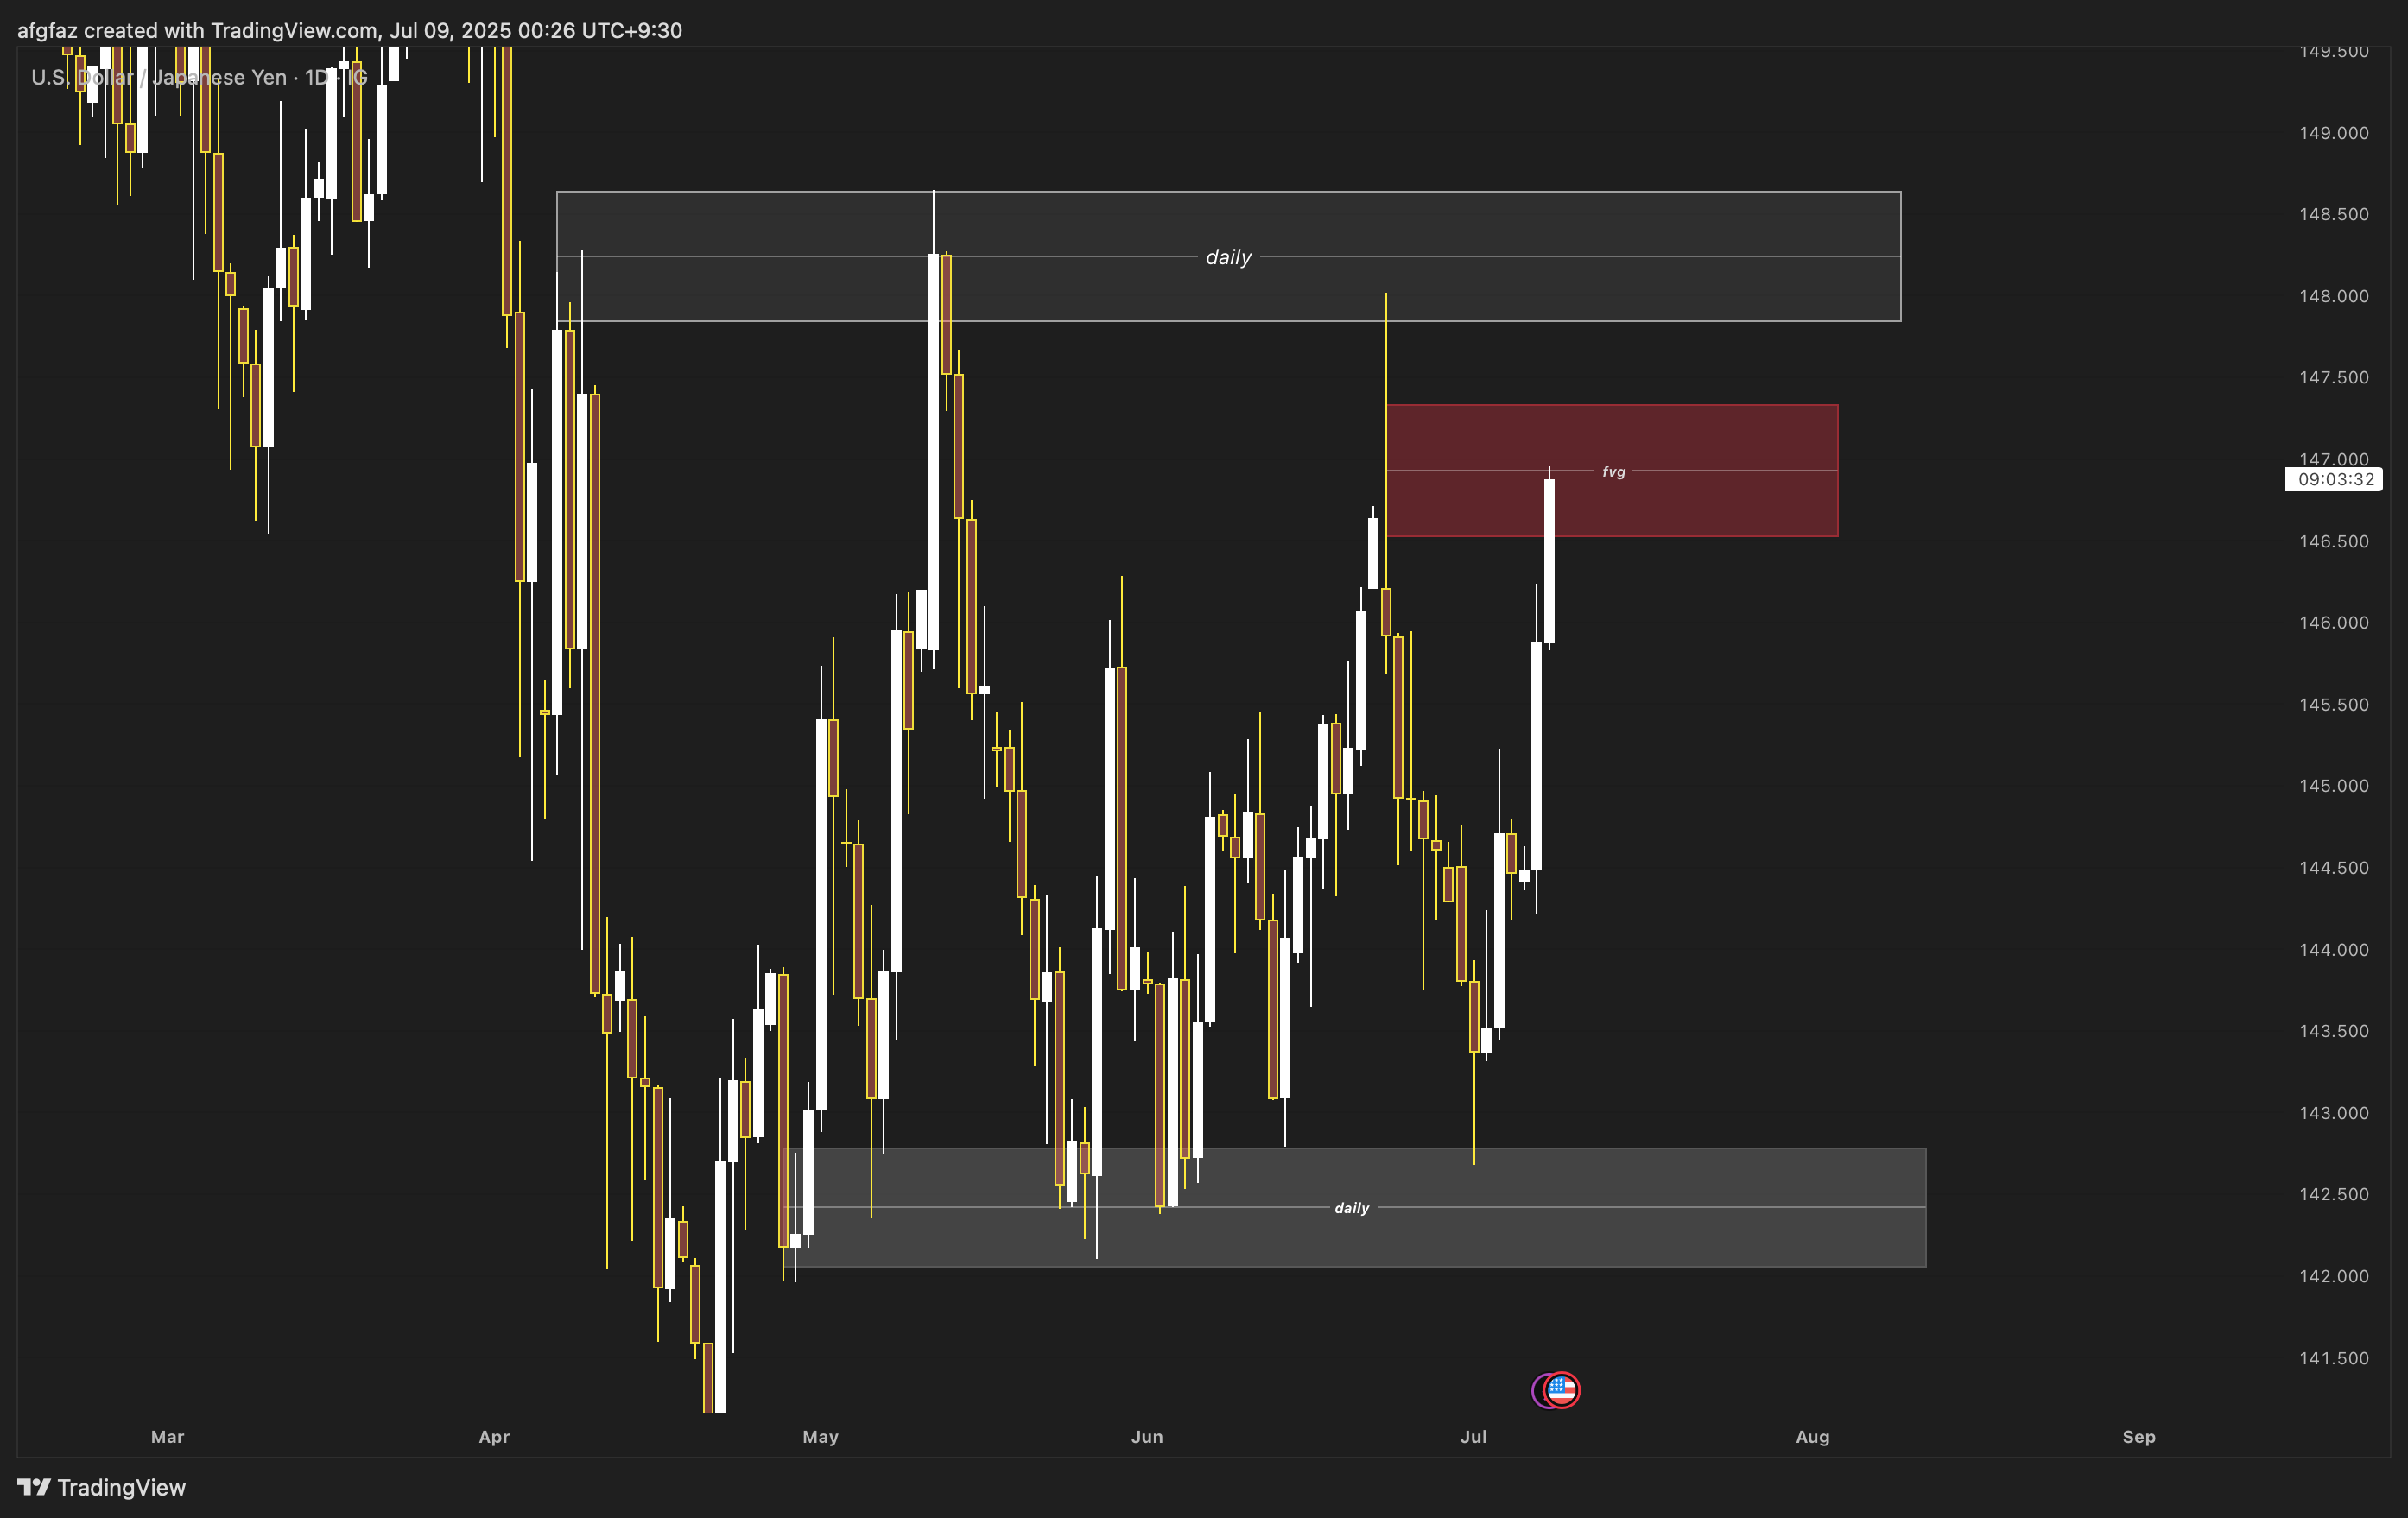
for me .. down & down from this zone..
monthly charts and rsi
Nice Ride right off structure
2/2 Summary of Key Levels
Daily & 4-Hour Support and Resistance
Daily Support: 145.500, 144.800, 144.200
Daily Resistance: 147.500, 148.000, 148.500
4-Hour Support: 146.000, 145.700, 145.300
4-Hour Resistance: 146.800, 147.200, 147.600
Exponential Moving Average (EMA) Levels
Daily EMA:
EMA 50: 146.250
EMA 100: 145.800
EMA 200: 144.500
EMA 400: 143.200
4-Hour EMA:
EMA 50: 146.500
EMA 100: 146.200
EMA 200: 145.900
EMA 400: 145.600
Weekly Pivots
Pivot Point: 146.000
Resistance 1: 147.000
Support 1: 145.000
Daily Pivots
Pivot Point: 146.500
Resistance 1: 147.200
Support 1: 145.800
Fibonacci Retracement Levels
23.6%: 145.900
38.2%: 146.600
61.8%: 147.400
Fundamental Analysis and Upcoming USD News 📈
As we look ahead, several key economic events may impact the USDJPY market:
US Non-Farm Payrolls (NFP): Scheduled for next week, this report will provide insights into the employment situation in the US, which is a critical indicator of economic health.
Federal Reserve Interest Rate Decision: The upcoming FOMC meeting is expected to address interest rate adjustments, which directly influence USD strength.
Consumer Price Index (CPI): This inflation measure will be released shortly and could significantly affect market sentiment and USD valuation.
These events are crucial as they can lead to increased volatility in the USDJPY pair, providing both risks and opportunities for traders.
Conclusion
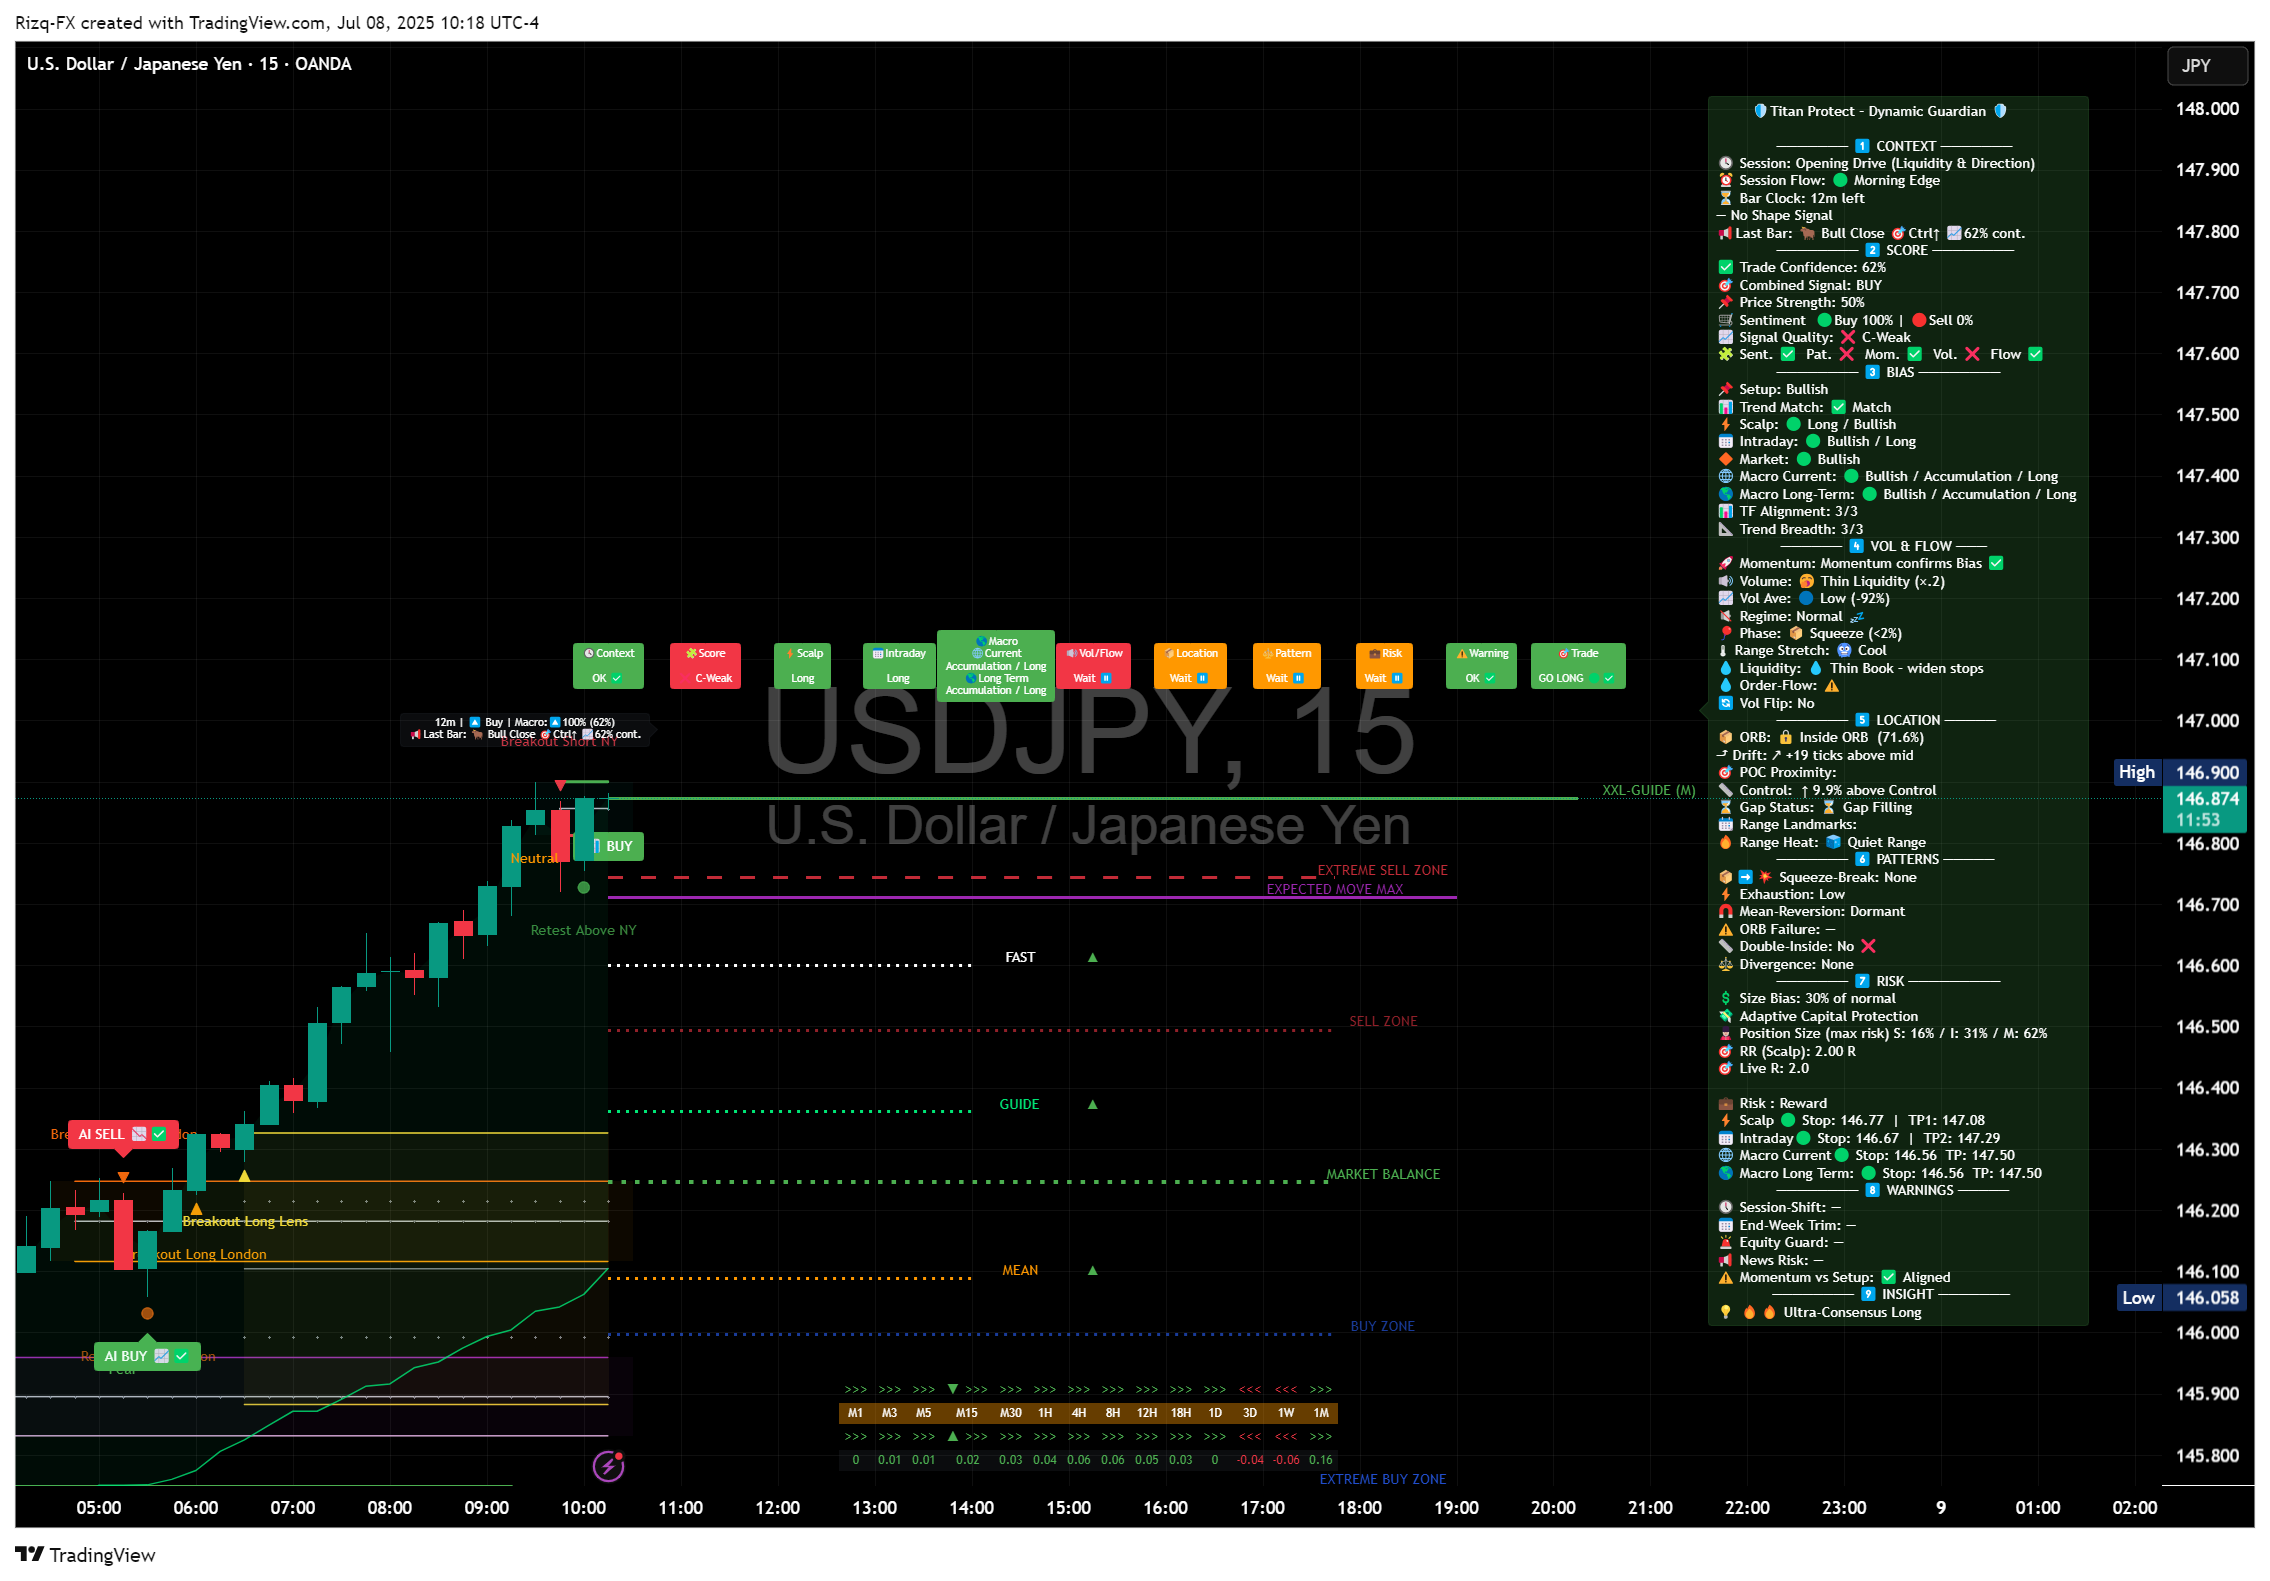
In summary, the USDJPY pair is currently trading at 146.561, with various technical indicators providing valuable insights into potential price movements. The support and resistance levels, along with Fibonacci retracement levels and EMA analysis, suggest a complex market environment. Traders should remain vigilant of upcoming economic events that could influence market dynamics and adjust their strategies accordingly.
1/1 🟡 USDJPY Daily Market Analysis—July 8, 2025
Introduction
In today's analysis, we delve into the USDJPY currency pair, which is currently trading at 146.561 USD. This report will cover both the daily and 4-hour time frames, utilizing various technical analysis tools including Fibonacci Retracement Levels, Exponential Moving Averages (EMAs), RSI divergence, weekly and daily pivots, Smart Money Concepts (SMC), support and resistance levels, order blocks, and MACD. Our goal is to provide a comprehensive overview of the current market conditions and potential trading opportunities.
Market Overview
Current Price Action
The USDJPY has shown considerable volatility, with a recent swing high of 148.032 and a swing low of 142.682. This range presents a fertile ground for analysis, particularly with the use of Fibonacci levels and EMA indicators to identify potential reversal points and trends.
Technical Analysis
Support & Resistance Levels
Daily Time Frame
Support Levels:
1st Support: 145.500
2nd Support: 144.800
3rd Support: 144.200
Resistance Levels:
1st Resistance: 147.500
2nd Resistance: 148.000
3rd Resistance: 148.500
4-Hour Time Frame
Support Levels:
1st Support: 146.000
2nd Support: 145.700
3rd Support: 145.300
Resistance Levels:
1st Resistance: 146.800
2nd Resistance: 147.200
3rd Resistance: 147.600
Fibonacci Retracement Levels
Using the swing high of 148.032 and swing low of 142.682, the key Fibonacci retracement levels are:
23.6%: 145.900
38.2%: 146.600
61.8%: 147.400
These levels can act as potential reversal points, providing traders with insights into entry and exit strategies.
Exponential Moving Averages (EMA)
Daily Time Frame
EMA 50: 146.250
EMA 100: 145.800
EMA 200: 144.500
EMA 400: 143.200
4-Hour Time Frame
EMA 50: 146.500
EMA 100: 146.200
EMA 200: 145.900
EMA 400: 145.600
The EMAs are crucial for identifying the trend direction. If the price is above the EMAs, it suggests a bullish trend, while a price below indicates a bearish trend.
RSI Divergence
The Relative Strength Index (RSI) is currently at 55, indicating a neutral market. However, observing divergences can provide valuable insights:
Bullish Divergence: If the price makes a lower low while the RSI makes a higher low, it could indicate a potential reversal to the upside.
Bearish Divergence: Conversely, if the price makes a higher high while the RSI makes a lower high, it may signal a potential reversal to the downside.
Order Blocks
Order blocks are significant areas where institutional traders have placed large orders. In the current market context:
Bullish Order Block: Located around 145.500, where buying interest may emerge.
Bearish Order Block: Found near 147.500, where selling pressure could increase.
MACD Analysis
The Moving Average Convergence Divergence (MACD) is currently showing a bullish crossover, suggesting upward momentum. The MACD line is above the signal line, indicating that the bullish trend may continue unless there is a significant reversal.