U.S. Dollar / Japanese Yen forum
Key drivers include Fed-BoJ policy divergence and strong U.S. yields.
You’re here to survive.
Trading is not a battle of strategy. It's a battle of survival.
2/2 Summary of Key Levels
Daily & 4-Hour Support and Resistance
Daily Support Levels: 145.500, 144.800, 144.200
Daily Resistance Levels: 147.500, 148.000, 148.500
4-Hour Support Levels: 146.200, 145.800, 145.300
4-Hour Resistance Levels: 147.000, 147.600, 148.000
Exponential Moving Average (EMA) Levels
Daily EMA Levels:
EMA 50: 146.500
EMA 100: 145.800
EMA 200: 144.300
EMA 400: 143.200
4-Hour EMA Levels:
EMA 50: 146.800
EMA 100: 146.200
EMA 200: 145.600
EMA 400: 144.500
Weekly and Daily Pivots
Weekly Pivots:
Pivot Point: 146.500
Resistance 1: 147.000
Support 1: 145.000
Daily Pivots:
Pivot Point: 146.750
Resistance 1: 147.250
Support 1: 146.250
Fibonacci Retracement Levels
23.6% Level: 146.034
38.2% Level: 145.500
50% Level: 145.357
61.8% Level: 144.214
78.6% Level: 143.500
Fundamental Analysis and Upcoming USD News
📈 As traders analyze the USDJPY market, it is essential to consider upcoming economic events that may influence the USD. This week, the following key U.S. economic indicators are scheduled for release:
Consumer Price Index (CPI): Expected to be released on July 12, 2025. A higher than expected CPI may bolster the USD, leading to potential upward pressure on USDJPY.
Retail Sales Data: Scheduled for July 15, 2025. Strong retail sales figures can indicate consumer confidence and spending, further supporting the USD.
Federal Reserve Meeting Minutes: Expected on July 18, 2025. Insights into future monetary policy could significantly impact market sentiment and the USDJPY exchange rate.
The outcomes of these events could create volatility in the USDJPY pair, making it crucial for traders to stay informed and adjust their strategies accordingly.
Conclusion
In summary, the USDJPY pair is currently trading at 146.896, situated between key support and resistance levels. The technical indicators analyzed—Fibonacci retracement levels, EMAs, RSI divergence, order blocks, and MACD—provide a comprehensive view of the market dynamics.
1/1 🟡 USDJPY Daily Market Analysis—July 11, 2025
Introduction
In the world of forex trading, the USDJPY pair stands out as one of the most actively traded currency pairs. As of today, the live price of USDJPY is 146.896 USD. This analysis will delve into the daily and 4-hour time frames, utilizing a variety of technical indicators, including Fibonacci Retracement Levels, Exponential Moving Averages (EMA), RSI divergence, Weekly and Daily Pivots, Smart Money Concepts (SMC), Support and Resistance Levels, Order Blocks, and MACD.
By examining these indicators, traders can gain valuable insights into potential price movements and make informed trading decisions.
Market Overview
Current Price Action
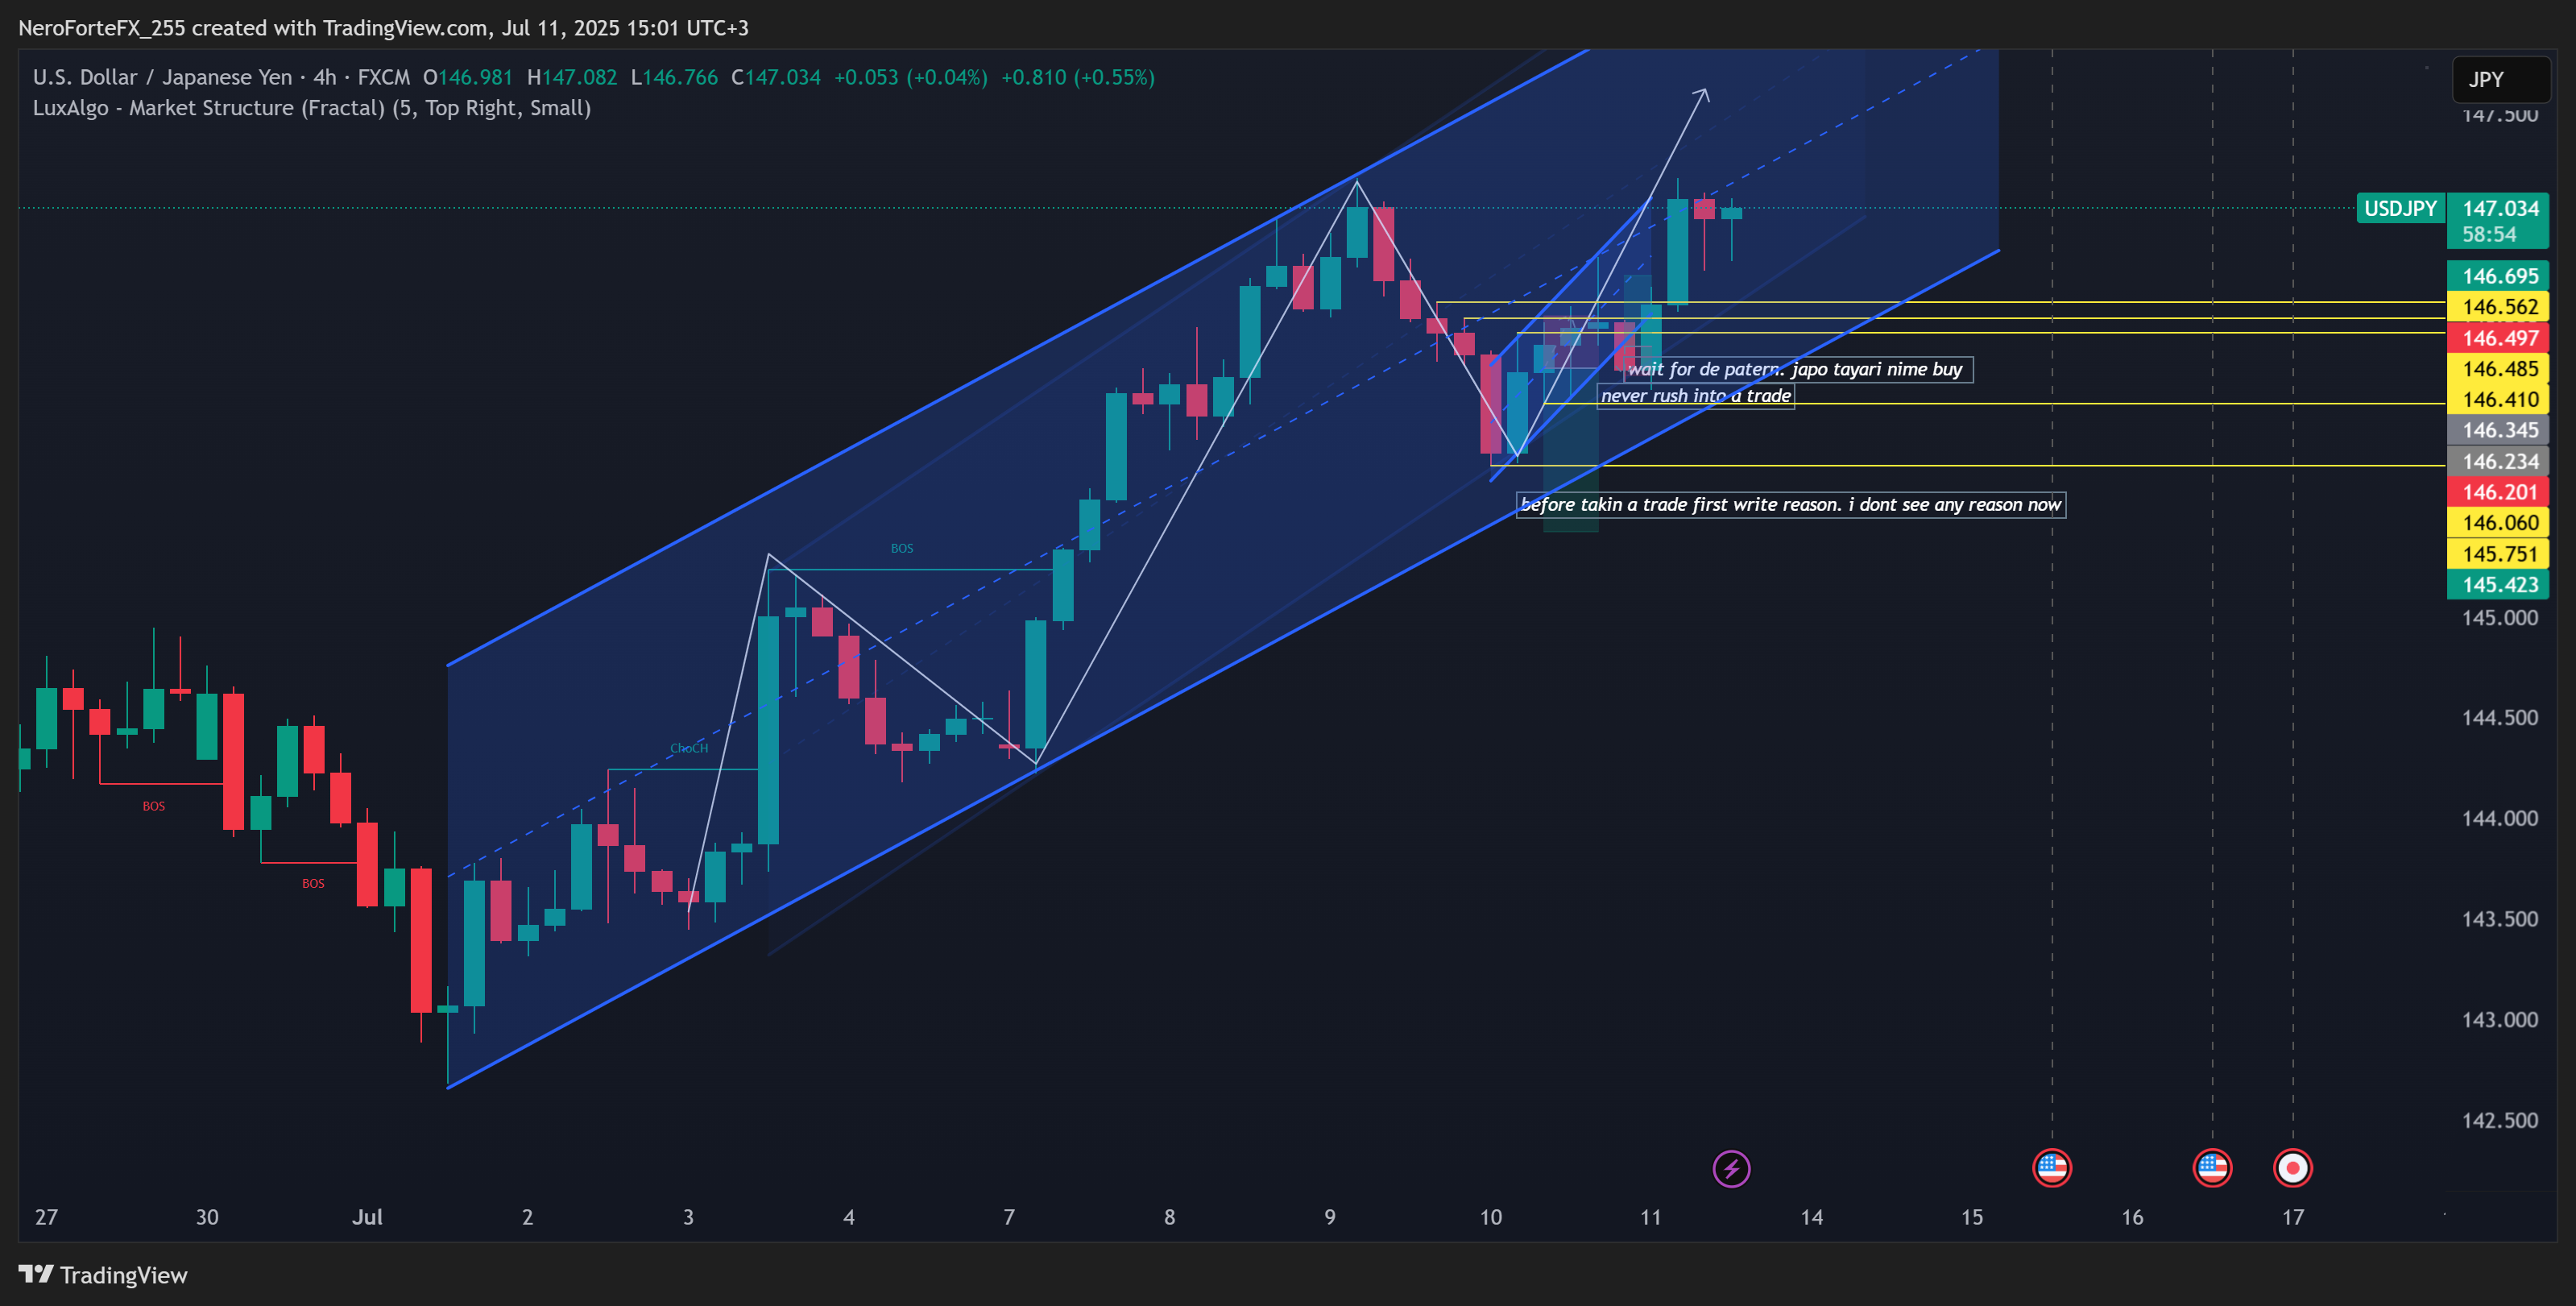
The USDJPY is currently trading at 146.896, which is situated between significant swing high and swing low levels. The swing high is noted at 148.032, while the swing low stands at 142.682. This range provides a framework for analyzing potential support and resistance levels.
Key Technical Indicators
Support & Resistance Levels
Daily Time Frame:
Support Levels:
First Support: 145.500
Second Support: 144.800
Third Support: 144.200
Resistance Levels:
First Resistance: 147.500
Second Resistance: 148.000
Third Resistance: 148.500
4-Hour Time Frame:
Support Levels:
First Support: 146.200
Second Support: 145.800
Third Support: 145.300
Resistance Levels:
First Resistance: 147.000
Second Resistance: 147.600
Third Resistance: 148.000
Fibonacci Retracement Levels
Using the swing high of 148.032 and swing low of 142.682, the Fibonacci retracement levels are calculated as follows:
23.6% Level: 146.034
38.2% Level: 145.500
50% Level: 145.357
61.8% Level: 144.214
78.6% Level: 143.500
These levels are crucial for identifying potential reversal points in the market.
Exponential Moving Averages (EMA)
Daily Time Frame:
EMA 50: 146.500
EMA 100: 145.800
EMA 200: 144.300
EMA 400: 143.200
4-Hour Time Frame:
EMA 50: 146.800
EMA 100: 146.200
EMA 200: 145.600
EMA 400: 144.500
The EMAs provide insights into the prevailing trend. The positioning of the price relative to these EMAs can indicate bullish or bearish momentum.
RSI Divergence
The Relative Strength Index (RSI) is currently showing some divergence on the daily chart. As the price approaches the swing high of 148.032, the RSI is not confirming the same strength, suggesting potential exhaustion in the upward movement. This divergence could signal a possible reversal or correction in the near term.
Order Blocks
Order blocks on the daily chart are identified around the 146.500 level, where significant buying occurred previously. This zone could act as a strong support level if the price retraces. Conversely, the area around 147.500 has shown selling pressure, indicating a potential resistance zone.
MACD Analysis
The MACD indicator is currently in a bullish crossover, suggesting that the momentum is favoring the buyers. However, traders should watch for any signs of convergence or divergence that may indicate a shift in momentum.
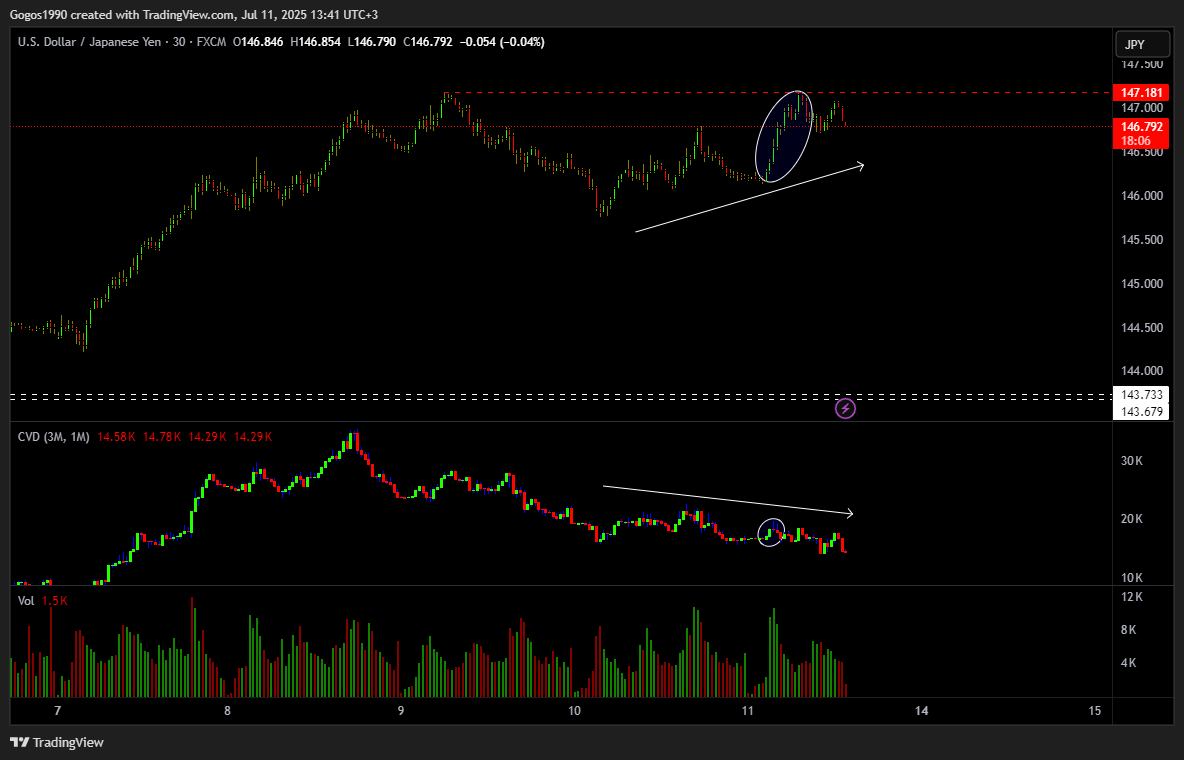
However, observing the CVD (Cumulative Volume Delta), it’s clear that this upward move lacked aggressive volume. In other words, the effort (volume) required to push price that high was minimal, and there was little to no absorption along the way. To me, this signals potential manipulation—when high prices are reached with minimal volume effort.
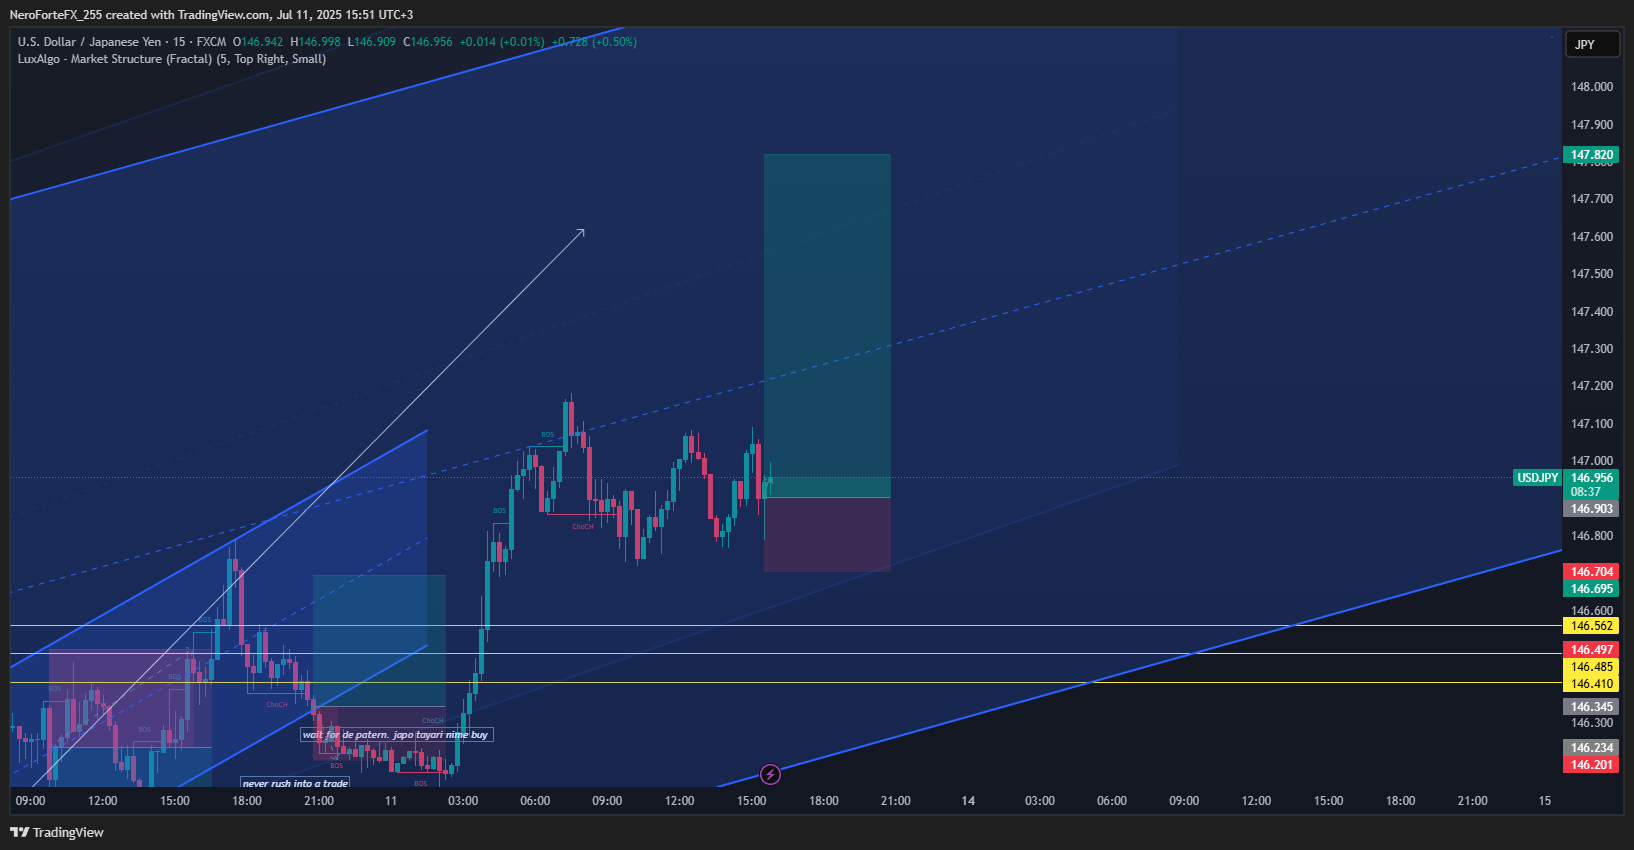
Now let’s see whether price returns to align with the original structural path.
On Friday, the USD/JPY pair advanced to 146.93, marking a three-week high as the US dollar continued to strengthen against a backdrop of escalating global trade...